Swinject: Using weak scope is leaking objects?
I have this dummy object
protocol DevTestProtocol: class {}
class DevTest: DevTestProtocol {}
which is registered like follows (I'm using an assembly)
container.register(DevTestProtocol.self) { _ in
    return DevTest()
}
.inObjectScope(.weak)
For testing purposes I added a property in my app delegate
var devTest: DevTestProtocol?
and in applicationDidFinishLaunchingWithOptions I resolve the object then forget about it
self.devTest = DI.resolve(DevTestProtocol.self)!
self.devTest = nil
Is the DevTest instance supposed to be gone by now?
Because it's not. It still shows in the debug memory graph as a leak (see screenshot).

I guess this isn't expected behaviour? Am I missing something?
It looks like a bug to me and it's messing up my whole setup.
What can we do about this?
 alexisbronchart
All 11 comments
Can you post the DevTest class as well? Are there any retain cycles that are keeping it alive?
 mpdifran
on 23 May 2017
mpdifran
on 23 May 2017
That's what I'm wondering. At least they don't show up in the debug memory graph.
This actually happens with the empty implementation of DevTest I provided at the top of my post.
alexisbronchart
on 23 May 2017
Ok, I can look into adding some tests for this (if there aren't already some), and see if I can track down the problem.
mpdifran
on 24 May 2017
Allright thanks, you can checkout this project to reproduce the issue if needed: https://github.com/alexisbronchart/SwinjectWeakLeak
alexisbronchart
on 24 May 2017
I just found that if DevTest inherits from NSObject then the leak doesn't show up in the debug memory graph.
alexisbronchart
on 25 May 2017
Thanks @alexisbronchart and @mpdifran!
 yoichitgy
on 6 Jun 2017
yoichitgy
on 6 Jun 2017
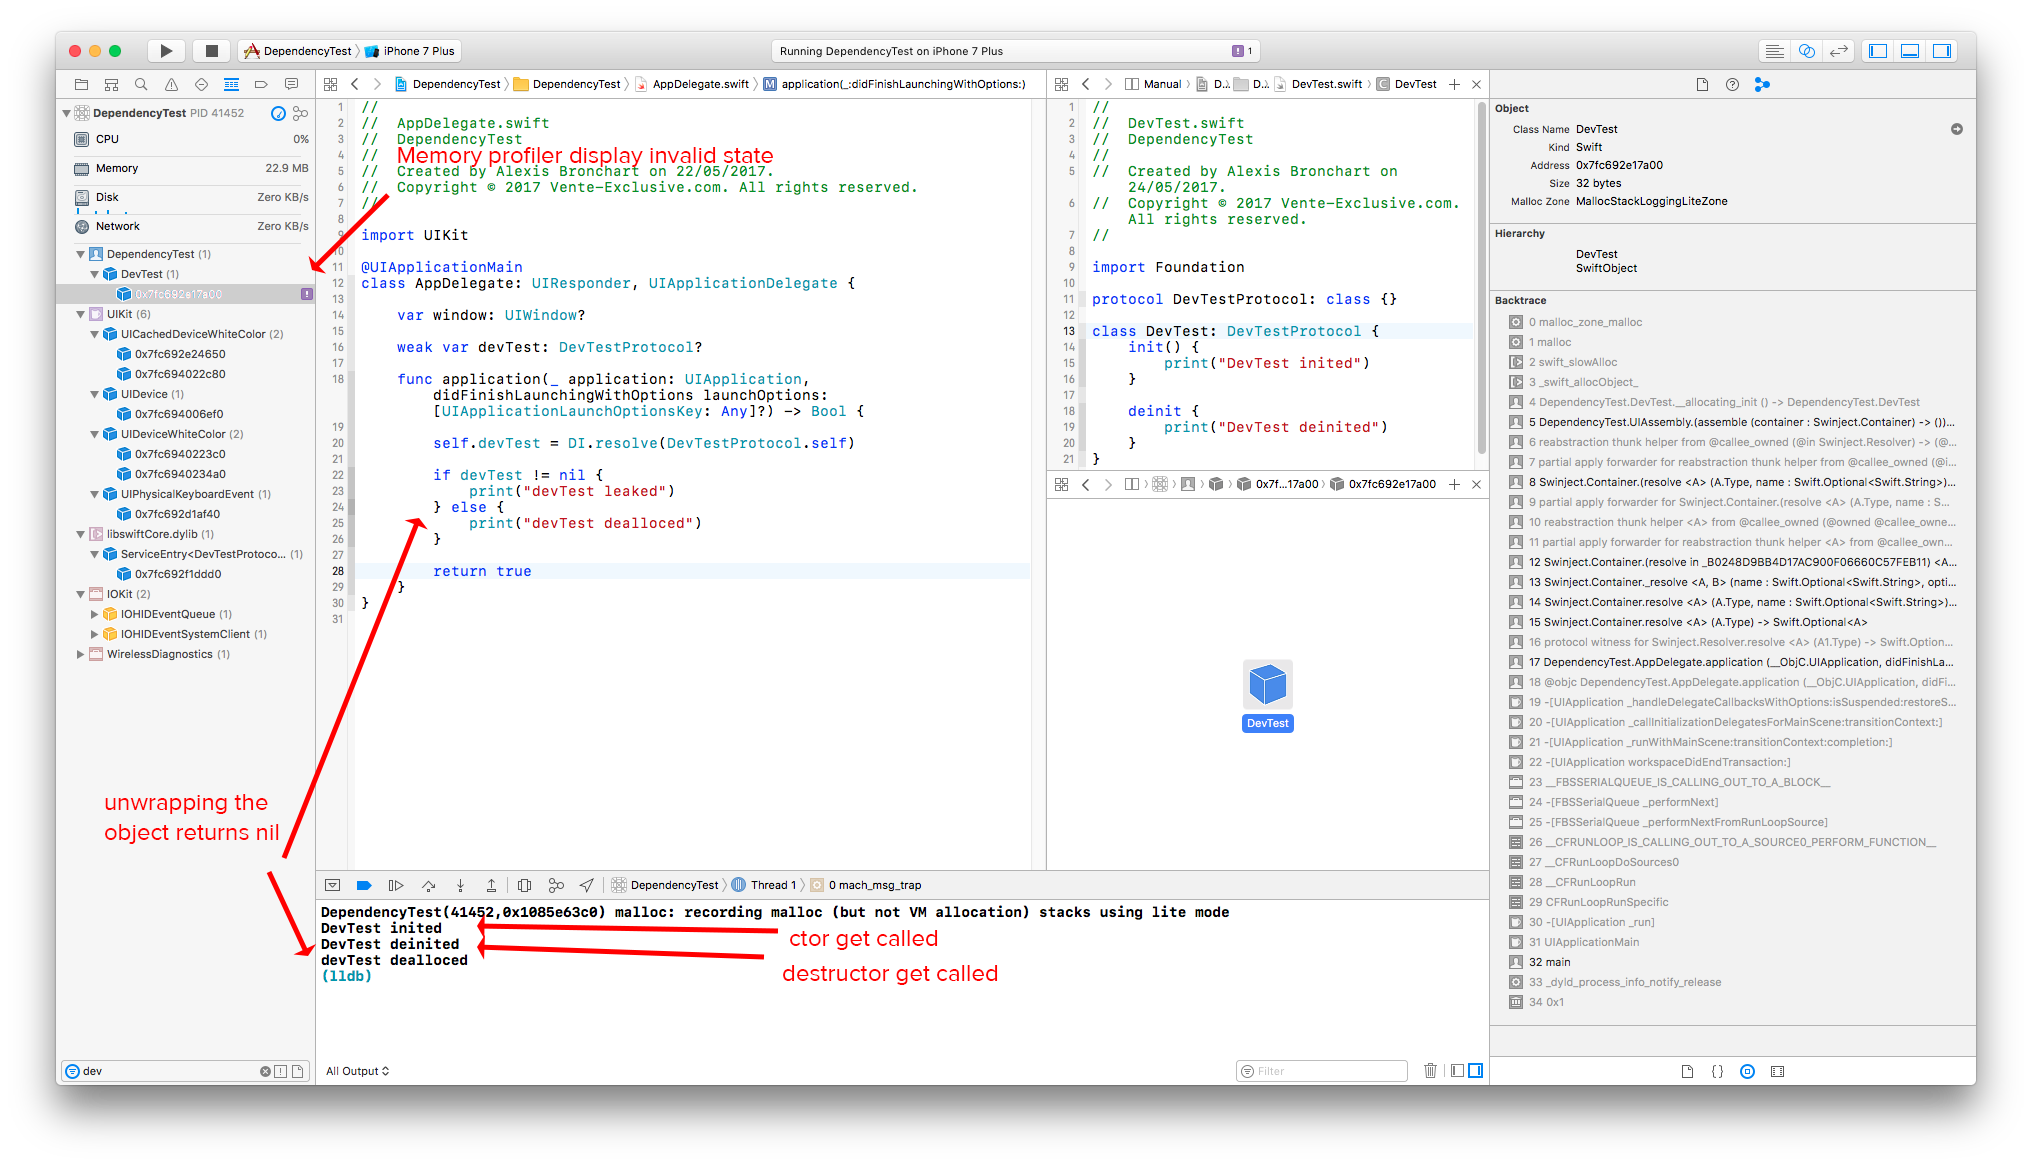
UPDATED: There is a bug in Memory Profiling instruments in Xcode v8.x. DevTest object life time is correct. Instruments doesn't update the memory state. (@alexisbronchart, I changed your example a little bit) See screenshot attached
 igorkotkovets
on 31 Jul 2017
igorkotkovets
on 31 Jul 2017
Thanks @igorkotkovets for the investigation 👍👍👍 I'll check it.
yoichitgy
on 4 Aug 2017
Any updates on this issue? I'm seeing it as well. I'm not sure it's an Xcode8 profiling issue. I started noticing it in the app, then confirmed it with the profiler.
 jodyscho
on 2 Oct 2017
jodyscho
on 2 Oct 2017
Ok, I tried the leak sample project and it doesn't appear to be leaking for me.
My leak happens when I use SwinjectStoryboard. I'll keep digging to make sue it's not on my end. And if not, I'll raise a bug for SwinjectStoryboard.
jodyscho
on 2 Oct 2017
Thanks @jodyscho for the investigation😃 I’m going to close this issue in Swinject project.
Please anyone feel free to reopen this issue, or open an issue in SwinjectStoryboard project if you find the leak issue is reproducible👍
yoichitgy
on 2 Oct 2017
Related issues
 drekka
·
3Comments
drekka
·
7Comments
drekka
·
3Comments
drekka
·
7Comments
 Mackarous
·
4Comments
Mackarous
·
4Comments
 diwengrum
·
5Comments
igorkotkovets
·
7Comments
diwengrum
·
5Comments
igorkotkovets
·
7Comments
Most helpful comment
Ok, I can look into adding some tests for this (if there aren't already some), and see if I can track down the problem.