Stylecopanalyzers: Investigating analyzer impact on build times
StyleCop Classic used to write information about files it analyzed, including analysis results, in an XML cache called StyleCop.Cache, to speed the time it takes to analyze a project if some of the source code files are unchanged in the meantime. Although StyleCop Analyzers also has caches, they are limited to storing using aliases and copyright texts, but nothing like a results cache like StyleCop Classic used to have.
In my experience, running the StyleCop analyzer takes a considerable part of a project's build time even if it ultimately finds few or no violations, and I feel that having a results cache (like StyleCop.Cache) will speed up this time because StyleCop would then focus analysis on only those files that have changed, which is often not many files.
 peteroupc
All 17 comments
@peteroupc StyleCop Analyzers is not StyleCop Classic. If you find an indication of a performance problem, please file an issue and we will work to resolve it directly.
 sharwell
on 10 Jul 2019
sharwell
on 10 Jul 2019
I can't speak of the slow performance of StyleCop Analyzers except in general terms. I know that StyleCop Analyzers is more than doubling build time of my projects but I don't know where to start in finding a specific "performance problem" of the kind you have in mind.
peteroupc
on 10 Jul 2019
What was the build time prior to StyleCop Analyzers, and the build time after?
Do you have any other analyzers installed in your project?
sharwell
on 10 Jul 2019
For one project of mine, the build time (msbuild /t:rebuild) was—
- about 1:06 without StyleCop Analyzers, and
- about 2:54 with StyleCop Analyzers,
resulting in almost triple the build time. This project used no other analyzers than StyleCop Analyzers.
peteroupc
on 10 Jul 2019
@peteroupc The last time I measured it, the performance cost of StyleCop Analyzers was about 90% in the analyzer driver (enabled whenever any analyzer is installed and enabled) and about 10% StyleCop Analyzers itself. This project only has control over the performance of the latter. The easiest way to see if this is impacting you is to install another analyzer, e.g. FXCop Analyzers, and then re-run your comparison between StyleCop Analyzers installed or not. In this scenario, I would expect the difference between the two cases to be much less than 1:48.
The other thing that can impact performance is the number of diagnostics reported by the analyzers. This is the same as the number of diagnostics you see if the project has no suppressions. StyleCop Analyzers is optimized for cases where no diagnostics are reported. A few diagnostics wouldn't make much difference, but if are seeing and/or suppressing thousands of diagnostics, it would have a noticeable impact.
sharwell
on 10 Jul 2019
The build time for the same project is—
- about 1:39 with FxCop analyzers version 2.6.4, and
- about 3:22 with FxCop analyzers version 2.6.4 and StyleCop Analyzers.
Also, several rules were disabled in the project in question; enabling them raised the build time to about 4:01 (with just StyleCop Analyzers) and added almost 5000 additional warnings (mostly SA1500 and SA1513); though this may be due to overhead from displaying those warnings.
peteroupc
on 10 Jul 2019
Can you try adding /p:ReportAnalyzer=true to your MSBuild command line to see execution times by analyzer?
sharwell
on 10 Jul 2019
@peteroupc If the results from ReportAnalyzer don't show in your output, you can add /bl:Build.binlog to your MSBuild command line as well. This will create an output file Build.binlog that you can open with the MSBuild Structured Log Viewer. This output format contains the information you would normally see with diagnostic level output, but is much faster than /v:d and the log viewer contains search functionality.
When you open the log in the viewer, you'll want to search for the following:
"Total analyzer execution time"
Then you can click on a line on the left pane to get details.

sharwell
on 10 Jul 2019
@peteroupc I reopened this as a question so we can work through the issue and find the root cause
sharwell
on 10 Jul 2019
I got useful information from adding /v:detailed to the command line. Notably, the output shows that the analysis spends about 22% on a single rule: SA1604, "element documentation must have summary". Presumably this has to do with the fact that I include most of my project's XML documentation (including summaries) in a separate XML file and the analyzer may be loading and reloading that XML file each time it checks the XML documentation. Another reason may be the XPath overhead of resolving XML paths.
The following checks consumed a noticeable part of the analysis time, but to a much lesser extent (at most 3% each):
SA1009, SA1027, SA1137, SA1008, SA1120, SA1101, SA1000
Note that the above is from a project with StyleCop.Analyzers _and_ FxCop Analyzers, and the latter's checks take considerably less time.
peteroupc
on 10 Jul 2019
I may be able to improve performance of that scenario. I'll take a look, and if I can get a private build up on AppVeyor I'll show you how to reference it for testing.
sharwell
on 10 Jul 2019
I'm not sure I'll be able to address the SA1604 issue in short order. I would suggest disabling it for now.
Is there a reason you use <include> so much? I'm wondering if a better experience would be had by inlining the documentation to the comments.
sharwell
on 10 Jul 2019
Disabling SA1604 didn't have much effect; rather it simply shifted the bulk of the analysis time to another documentation-related check, this time SA1614.
I include XML documentation in my projects because having all the documentation for a project or library in a single file is more convenient for me, for such purposes as editing.
peteroupc
on 10 Jul 2019
You may need to iterate a few times to disable all impacted rules. Both of the expensive pieces of the <include> evaluation are cached across analyzers, so it will only impact the first one that evaluates a given comment.
sharwell
on 10 Jul 2019
I believe the solution ultimately lies in improving the performance or caching the results of GetDocumentationCommentXml, which has an implementation that I don't know about and is beyond the reach of StyleCop Analyzers. It may be a method deep in the analysis engine. Does GetDocumentationCommentXml cache XML documents if the same document (same <include file='...'>) is included more than once in the same project? I don't know. Does it cache XPath results to avoid reevaluating the same XPath for the same XML file? I don't know.
peteroupc
on 12 Jul 2019
Just chiming in. I'm trying to cut the inner loop (make change + run tests) time down in two particular projects. With about half the rules disabled, I found that StyleCop Analyers adds an additional 3.7 seconds (+67%) to the build time in our most common scenario. I'm prioritizing our developers' trains of thought over catching style issues before PR.
 jnm2
on 11 Aug 2019
jnm2
on 11 Aug 2019
I don't see the suite of analyzers added through this project adding unexpectedly large delays to my solutions. Since I use a _lot_ of analyzers I do end up having the need to selectively disable live analysis or even do so during a build, though, on a machine-to-machine basis.
It looks like a recent Visual Studio update brought us settings to configure each:
(Click to read the release notes.)
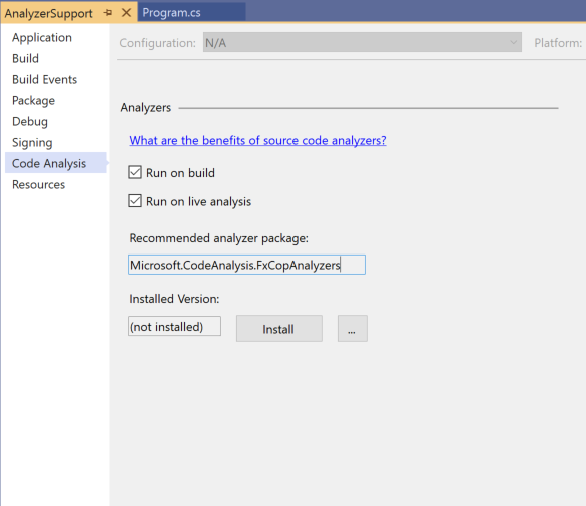
Each checkbox adds a property to the .csproj and thus can be used by us manually, to speed things up as needed:
<RunAnalyzersDuringLiveAnalysis>false</RunAnalyzersDuringLiveAnalysis>
<RunAnalyzersDuringBuild>false</RunAnalyzersDuringBuild>
 bddckr
on 20 Aug 2019
bddckr
on 20 Aug 2019
Related issues
 vweijsters
·
3Comments
vweijsters
·
3Comments
 drewnoakes
·
3Comments
drewnoakes
·
3Comments
 wmjordan
·
6Comments
wmjordan
·
6Comments
 patriksvensson
·
6Comments
patriksvensson
·
6Comments
 Genarij
·
7Comments
Genarij
·
7Comments