Stryker: Performance benchmark: Express
As discussed here https://github.com/stryker-mutator/stryker/issues/1514#issuecomment-678246993
To get a better feel for the performance impact of changes in Stryker we should add some more benchmarks.
For this benchmark, we'll use https://github.com/expressjs/express.
This is a simple one for a straightforward node case:
- Common JS with no instrumentation
- Well tested (1147 tests)
- Decent size (1800 lines of source code, 4064 lines total)
- Mocha test framework
Baseline results
[email protected]
| % score | # killed | # timeout | # survived | # no cov | # error | duration
|---------|----------|-----------|------------|----------|---------|-----|
| 98.21 | 1432 | 492 | 35 | 0 | 155 | 00:08:15
[email protected]
| % score | # killed | # timeout | # survived | # no cov | # error | duration
|---------|----------|-----------|------------|----------|---------|-----|
| 89.01 | 1541 | 201 | 207 | 8 | 68 | 00:04:17
With "maxConcurrentTestRunners": 8:
| % score | # killed | # timeout | # survived | # no cov | # error | duration
|---------|----------|-----------|------------|----------|---------|-----|
| 88.50 | 1623 | 109 | 217 | 8 | 68 | 00:05:55
 Lakitna
All 97 comments
I've tried to get a basic idea for how long this benchmark would take (on my pc anyway) and I actually ran into a very obscure bug.
It's so obscure that I'm not even sure if it should be fixed. I've detailed it in #2418
Lakitna
on 25 Aug 2020
Thanks a lot for wanting to add the benchmark! And the issue is also a juicy one we should fix.
Beers for everyone! 🍻
 nicojs
on 25 Aug 2020
nicojs
on 25 Aug 2020
Beers for everyone! 🍻
But not yet in file paths! 🍻
Lakitna
on 25 Aug 2020
The issue should be fixed @Lakitna so feel free to proceed 😉
Do you want me to release a new beta version?
nicojs
on 27 Aug 2020
Awesome!
I'll make it work without a new release. Though it is a shame that we can't make this benchmark work for Stryker@3 as a comparison.
Lakitna
on 27 Aug 2020
Hmm good point. Maybe we can remove the tests that use the fixture?
nicojs
on 27 Aug 2020
Or we can backport this fix, your choice.
nicojs
on 27 Aug 2020
Maybe we can remove the tests that use the fixture?
Yeah... I had a bit of a brainfart there... I'm so used to never skipping tests that I didn't even consider it. But for a benchmark that's not an issue.
Lakitna
on 27 Aug 2020
I'm running in an issue here. It feels like I'm missing a symlink or something.
I've created my branch in master so we can run this benchmark to compare Stryker@3 with Stryker@4. But following the Contributing docs do not allow me to run npm run perf or npm run e2e. Both fail on a require:
    "Error: Cannot find module '../src/StrykerCli'\r\n" +
    'Require stack:\r\n' +
    '- C:\\Data\\stryker\\e2e\\test\\angular-project\\node_modules\\@stryker-mutator\\core\\bin\\stryker\r\n' +
See also full logs:
Am I wrong in assuming that the master branch contains correct code?
Lakitna
on 27 Aug 2020
I see you've figured it out already (PR).
Question: what are your thoughts on running these tests? Just from time to time on our own (dev) pcs? Or on Github actions hardware? Want to use tools for it?
Any guidance here would be excellent, I have not a lot of experience in this field.
nicojs
on 27 Aug 2020
I see you've figured it out already (PR).
I sadly didn't. The PR is WIP because it currently pulls Stryker from NPM.
I also don't have a lot of experience with performance testing, especially in an open-source setting. We can't enforce a periodical performance test here. Not the way you can do it when you have a dedicated team anyway. However, this is a topic I'm interested in.
It might be good to create a quick perf test at some point that can be used to ensure that a new PR does not introduce a major slowdown. After that, I think we should test at least before every release. But that would either take a long time (run perf tests on the current version (from NPM) and on the new version (release candidate)) or require identical hardware every time. In any case, I'll read up on the subject and come back to you.
Lakitna
on 27 Aug 2020
I'll be working on this today @Lakitna.
I'll be investigating if it makes sense to use git submodules for our performance test. I was pointed in this direction by @hugo-vrijswijk . It saves disk space, but also makes it easier to keep them up-to-date.
This will be my first endeavour with git submodules 🤞.
nicojs
on 28 Aug 2020
Git submodules would not work in this case, because we have to skip that one test that fails in Stryker@3. Other than that, it would be a good improvement.
but also makes it easier to keep them up-to-date
I'm not sure we should want to update benchmarks. Benchmarks are most useful if they're always the same. This is why I mention the specific commit on which the benchmark is based https://github.com/stryker-mutator/stryker/pull/2431/files?file-filters%5B%5D=.js#diff-c10b5c0440a9a6b469ebef610ebc860aR4
Lakitna
on 28 Aug 2020
Git submodules would not work in this case, because we have to skip that one test that fails in Stryker@3.
Way ahead of you #2433 😎
(either that or initial test run failed locally and took me a while to figure out why and had a personal facepalm moment 🤦♂️)
nicojs
on 28 Aug 2020
My results:
Baseline results
Hardware
DELL Intel
Latitude 5500
Windows 10
Core™ i7-8665U
cores: 8
physicalCores: 4
[email protected]
| % score | # killed | # timeout | # survived | # no cov | # error | duration
|---------|----------|-----------|------------|----------|---------|-----|
| 82.40 | 1597 | 18 | 345 | 0 | 154 | 00:09:32 |
[email protected]
| % score | # killed | # timeout | # survived | # no cov | # error | duration
|---------|----------|-----------|------------|----------|---------|-----|
| 82.52 | 1592 | 23 | 334 | 8 | 68 | 00:07:42 |
So a performance improvement for me 😎
nicojs
on 28 Aug 2020
Wait, 82.40%? I got 98.2%... That's a big difference.
Your result
| Stryker | % score | # killed | # timeout | # survived | # no cov | # error | duration
|---------|---------|----------|-----------|------------|----------|---------|-----|
| 3.3.1 | 82.40 | 1597| 18| 345| 0 | 154| 00:09:32
My result
| Stryker | % score | # killed | # timeout | # survived | # no cov | # error | duration
|---------|---------|----------|-----------|------------|----------|---------|-----|
| 3.3.1 | 98.21 | 1432 | 492 | 35 | 0 | 155 | 00:08:15
Looks like I had a lot of timeouts where you did not. I'll take a look later today if I can pinpoint this. I think it might be maxConcurrency. I was running 16 instances on 16 cores.
Lakitna
on 28 Aug 2020
I think it might be
maxConcurrency. I was running 16 instances on 16 cores.
It might have to do with that, indeed. Old fashion process starvation. What did you do during testing? For example, browsing the internet is usually enough to screw up the run when running at max concurrency. I brought an additional laptop to work today 😎
nicojs
on 28 Aug 2020
I've updated my comment with the results. So 00:07:42 with [email protected], a significant performance _improvement_. This is unfortunate in a way, I was hoping to reproduce your experience @Lakitna, but alas.
@Lakitna, could you maybe also try it out with the new instructions in #2402?
nicojs
on 28 Aug 2020
I tried to run but ran into an issue with the submodule. By now you might have noticed that git submodules is a feature that has not been given a lot of love. In this case, I ran into the fact that it defaults to using SSH over HTTPS. I have no SSH set up for Github, so it failed on git submodule update.
I think you're working on the branch fix/test-perf-tests at the moment, but I can't commit to that. All you have to do is change line 3 in .gitmodules:
[submodule "perf/test/express"]
    path = perf/test/express
    url = https://github.com/expressjs/express.git
then:
git submodule sync
git submodule init
git submodule update
Now the submodule if pulled over HTTPS, making it easier for everyone to clone Stryker.
Also: I got build errors on master, and fix/test-perf-tests is beta (and fails on the Angular project). Which branch should I be looking at?
Edit: I found the global PERF_TEST_GLOB_PATTERN and am now testing Express with [email protected] on fix/test-perf-tests :)
Lakitna
on 31 Aug 2020
Hardware
| | |
|--|--|
| CPU | Intel Core i9-9880H |
| Physical cores | 8 |
| Logical cores | 16 |
| OS | Windows 10 2004 |
I also have a pretty powerful GPU, but Stryker does not make use of it. Maybe an interesting one for the far future. :) Though I'm not sure how well it would work.
[email protected]
| % score | # killed | # timeout | # survived | # no cov | # error | duration
|---------|----------|-----------|------------|----------|---------|-----|
| 89.01 | 1541 | 201 | 207 | 8 | 68 | 00:04:17
That's some speed improvement! There are still timeouts, though I'm definitely not running on a clean environment. When running with "maxConcurrentTestRunners": 8 I run between 50-90% CPU utilisation (and over the machines cooling capacity):
| % score | # killed | # timeout | # survived | # no cov | # error | duration
|---------|----------|-----------|------------|----------|---------|-----|
| 88.50 | 1623 | 109 | 217 | 8 | 68 | 00:05:55
Edit: I can get rid of the timeouts when I increase the timeout "timeoutMS": 30000 (without maxConcurrentTestRunners):
| % score | # killed | # timeout | # survived | # no cov | # error | duration
|---------|----------|-----------|------------|----------|---------|-----|
| 86.65 | 1680 | 14 | 253 | 8 | 70 | 00:06:33
Lakitna
on 31 Aug 2020
Intel Core i9-9880H
Have to admit, a bit jealous 😉
fix/test-perf-tests
It's since then merged to epic/mutation-switching (which is currently our "develop branch"). Will delete the branch. I see there are a lot open branches 😳 will do a cleanup 😅
Great to see you're having the same performance improvement. I'm curious to know how your specific use case differs from express 🤷♂️. Maybe very large source files? Which get even bigger with mutation switching?
I can't really explain the timeouts in your settings. Setting timeoutMS to 30 seconds is a kind of "shotgun approach". It will work, but it worsens the performance more than needed. There are 14 timeouts. I assume they are valid timeouts, as in mutants that result in an infinite loop for example. That means that 14 times, the test runner will hang for 30 seconds before it is killed.
Stryker's own calculation for the timeout per mutant should work: timeoutForTestRun = netTime * timeoutFactor + timeoutMS + overhead. Could you try to add a higher timeoutFactor? That might be a better fit for your use case.
nicojs
on 31 Aug 2020
Have to admit, a bit jealous 😉
I know right! I had to endure a few years of maddening slowness before I got it though 😒
The timeoutMS did feel like an imperfect solution. I tried it to see if we need a larger default timeout. I've taken a look at the remaining timeouts and they are legit. while loops and for loops mainly.
Compared to my (closed source) project express has a lot larger files.
| Project | Lines of source code | # Source files | Avg source lines per file | # mutants (Stryker@3) | # tests | Test run duration as reported by Mocha |
|---|---|---|---|---|---|---|
| Express | 1824 | 11 (11 mutated) | 165.81 | 2114 | 1148 (0 skipped) | 2581ms |
| My project | 6514 | 110 (87 mutated) | 59.22 | 3286 | 1070 (18 skipped) | 1220ms |
Are any of these numbers triggering anything for you?
Lakitna
on 31 Aug 2020
Could you try to add a higher
timeoutFactor?
| timeoutFactor | # timeouts | runtime |
|---|---|---|
| 1.5 (default) | 205 | 00:04:14 |
| 3 | 205 | 00:05:03 |
| 6 | 96 | 00:06:06 |
| 12 | 18 | 00:06:50 |
| 24 | 17 | 00:06:53 |
As expected, the total runtime gradually increases. I am surprised how high I had to crank timeoutFactor.
I've never encountered anything remotely like this in my project. Has anyone?
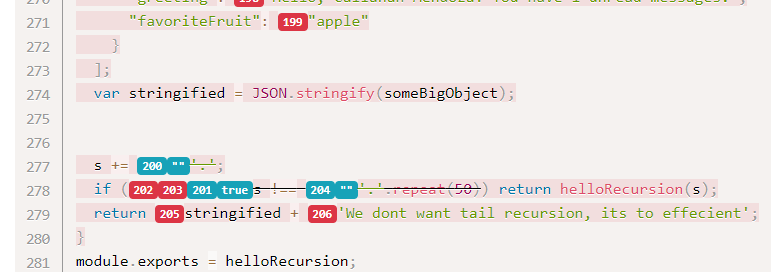
edit: I've re-run beta on my project, and there too I got more timeouts. Though I only got 2 extras. They appeared in this code:
    const component = _.omit(someObject, [
        'a',
        'b',
        'c',
        'd',
        'e',
        'f',
        'g',
        'h',
        'i',
        'j',
        'k',
        'l',
        'm',
        'n',
    ]);
There are two timeouts reported here. One on the mutation [] (line 1) and on '' (line 4)
Lakitna
on 31 Aug 2020
Do you have a hard disk by any chance (instead of SSD)? Maybe the disk is busy with I/O and that is causing the timeouts?
The @stryker-mutator/mocha-runner is clearing node's require cache between each run, so depending on how the OS handles these IO calls, it might get bottlenecked there. That would explain how your CPU is not at max while running with --concurrency equal to your logical core count.
Maybe some other reasons why timeouts appear? Encoding 4k video in the background? Mining bitcoin? There can be many reasons for these timeouts. Maybe there is tooling that can monitor your PC better?
Running with higher timeout settings is fine for Stryker, you're just waiting a bit longer than you probably strictly must. We will be implementing #1472 soon after Stryker 4, so you will be able to exclude the specific mutations with a comment. Not ideal, but better than nothing.
nicojs
on 31 Aug 2020
I'm sporting an SSD, and it's barely in use during a run (max 4%). So that would be unlikely.
I did observe the following in my project though. It is not as pronounced in the Express bench.

You're looking at _available_ memory (RAM) during the run. It looks like something is causing a memory leak. You can also see that something panicked when it couldn't get more memory and quickly cleaned up at about 90% into my run. The vertical line on the end is the end of the run.
However, I do think this is unrelated to the timeouts issue.
Lakitna
on 1 Sep 2020
Maybe some other reasons why timeouts appear? Encoding 4k video in the background? Mining bitcoin? There can be many reasons for these timeouts. Maybe there is tooling that can monitor your PC better?
I'm not running on a dedicated machine. I definitely have other programs open. But hardware usage is minimal. Below is the almost idle baseline in which I run Stryker.

With my kind of hardware and this much of it available I shouldn't have to worry about timeouts.
Lakitna
on 1 Sep 2020
However, I do think this is unrelated to the timeouts issue.
The available RAM _might_ cause an issue. Running tests creates a lot of garbage that needs collecting. Unfortunately, we're not able to choose when the garbage collecting occurs. This is the main reason for the high value for default timeoutMS. We want to allow the nodejs process to do garbage collecting. It would be awesome if we could choose the time that garbage collection occurs (similar to GC.Collect).
Another problem can be a memory leak in your tests (or one of the libraries). For example, you might use sinon.stub() without sinon.restore() in an afterEach. Maybe some of your dependencies leak memory? However, if this was the case, I would expect some logging, because the test runner should eventually crash and we've added logging and recovery for that specific case.
nicojs
on 1 Sep 2020
Maybe you can try this: https://www.npmjs.com/package/expose-gc to force gc.collect after each test run? See if that solves the issue?
nicojs
on 1 Sep 2020
I am able to keep the RAM under control with expose-gc but it only seems to slow down the test run. The rapid decrease in memory usage is probably Node running the garbage collector when hitting the RAM ceiling while actively running code. And Node can keep up because I have not seen any page file usage. After thinking about it, I'm not too worried about the RAM thing. Especially because in the Express bench, this is not an issue.
I am more interested in why the Express bench results in about 200 unexpected timeouts on my machine. My hardware is powerful enough that I shouldn't have to worry about this. And it's even weirder to me that you are not getting these seemingly random timeouts. Could it have something to do with the core count I'm working with? Is the CPU just dropping the ball here?
I have a desktop where I can give it a whirl. That one rocks an AMD Ryzen 7 3700X (8 physical cores, 16 logical cores). Unlike my laptop, that one should have no thermal issues.
Lakitna
on 1 Sep 2020
I've run it on my desktop. During the run, I was running an average of about 90% CPU usage.
Hardware
| | |
|--|--|
| CPU | AMD Ryzen 7 3700X |
| Physical cores | 8 |
| Logical cores | 16 |
| OS | Windows 10 2004 |
[email protected]
| % score | # killed | # timeout | # survived | # no cov | # error | duration
|---------|----------|-----------|------------|----------|---------|-----|
| 88.55 | 1503 | 230 | 216 | 8 | 68 | 00:04:15
Again I got a lot of timeouts :(. I think we can at least conclude that it's not a hardware issue.
Lakitna
on 1 Sep 2020
My hardware is powerful enough that I shouldn't have to worry about this.
I feel like how powerful your hardware is shouldn't matter. If we look at the function: timeoutForTestRun = netTime * timeoutFactor + timeoutMS + overhead. The netTime time here is calculated during the initial test run so that one should be lower on your powerful hardware. That makes the total timeoutForTestRun automatically lower.
Again I got a lot of timeouts :(. I think we can at least conclude that it's not a hardware issue.
Thanks again, I'll give the express benchmark another go here as well.
nicojs
on 1 Sep 2020
Maybe it's just regression in the epic/mutation-switching branch. Can you try again on the current master branch?
nicojs
on 1 Sep 2020
Yeah, maybe it's a regression. I now had 27 timeouts. So it seems pretty unstable. Also tried the benchmark on Stryker@3 again and had 10 timeouts, which is less than what I had previously. So it might have been this way for a while.
On the other hand, running inside GitHub actions has always been stable. I've got the feeling that we're simply asking too much from the hardware. For example, right now I'm typing here in firefox while running the bench. Firefox with more than 10 plugins. In the background, I'm running slack, teams, vscode (10+ processes). Maybe 100% of the cores (default --concurrency) is simply too much to ask.
nicojs
on 1 Sep 2020
It might be too much, yeah. But realistically, it's also how Stryker will be run in the real world. If it's part of your workflow there will always be other programs open.
I just remembered that in Stryker@4 you switched to one control thread or something like that right? Could that be the source of the issues when running with many cores? I can imagine the one core being overwhelmed when it has to serve too many others. That would also explain why Actions is stable, those machines have only 2 cores.
Lakitna
on 1 Sep 2020
Something weird is going on. If I run the express bench on WSL2 (ubuntu on Windows Subsystem for Linux 2) on the master branch I get a _very different_ report than when I run it on Windows.
96.69 mutation score (vs 82.40 what it should have been). It's also much faster than even [email protected]. This is a headscratcher. I'm wondering if I should investigate or leave it like it is (since it is the old version). 🙄
I just remembered that in Stryker@4 you switched to one control thread or something like that right? Could that be the source of the issues when running with many cores? I can imagine the one core being overwhelmed when it has to serve too many others. That would also explain why Actions is stable, those machines have only 2 cores.
Yeah, Stryker@3 will use 16 worker processes in your case, while Stryker@4 only creates 15. So if anything, Stryker 4 should yield a more consistent result.
I have a hypothesis. Maybe we should use the number of physical cores available, rather than the number of logical cores. If I run the express bench with --concurrency 4 (my number of physical cores) I still see a very high CPU utilization. So maybe that would yield a better result?
[email protected]
| OS | --concurrency | % score | # killed | # timeout | # survived | # no cov | # error | duration
|---|----|---------|----------|-----------|------------|----------|---------|-----|
| Windows | 7 (default) | 82.52 | 1592 | 23 | 334 | 8 | 68 | 00:07:42 |
| WSL2 | 4 | 86.05 | 1670 | 14 | 265 | 8 | 68 | 00:09:07 |
As you can see, some performance degradation, but it _does_ report the correct number of timeouts.
@Lakitna could you also try it with default timeout settings and --concurrency 8 (or 7)?
nicojs
on 1 Sep 2020
| OS | --concurrency | % score | # killed | # timeout | # survived | # no cov | #error | duration |
|---|---|---|---|---|---|---|---|---|
| Windows | 8 | 88.04 | 1647 | 76 | 226 | 8 | 0 | 00:05:35 |
It should have plenty of headroom to not time out.
I do not have WSL on this machine. I do on my desktop, but that is currently being used for GTA :)
Lakitna
on 1 Sep 2020
I think I might have found the cause of (some of) the issues.
Could you go to packages/mocha-runner/src/MochaOptionsLoader.ts and change line 39:
   public load(strykerOptions: MochaRunnerWithStrykerOptions): MochaOptions {
     const mochaOptions = { ...strykerOptions.mochaOptions } as MochaOptions;
-    return { ...DEFAULT_MOCHA_OPTIONS, ...this.loadMochaOptions(mochaOptions), ...mochaOptions };
+    return { ...DEFAULT_MOCHA_OPTIONS, ...this.loadMochaOptions(mochaOptions), ...mochaOptions, timeout: 0 };
   }
(don't forget to install again in perf. So npm run build, cd perf, npm i)
This will make sure the @stryker-mutator/mocha-runner turns off the mocha timeout setting. What previously happened is that the default of 2000 was kept. This means that if a test runs for 2 seconds, mocha will report it as timeout (the test fails). Next: Stryker will reuse that process to start a new test run. This means that, potentially, a lot of events get to build up on the nodejes eventloop.
Please try it out, you should see more timeout mutants (because they were previously (wrongfully) marked as killed). Try it 3 times and see if the number of timeouts is now stable.
nicojs
on 2 Sep 2020
Indeed I'm seeing more timeouts:
Run | % score | # killed | # timeout | # survived | # no cov | # error |
----------------|---------|----------|-----------|------------|----------|---------|
1 | 88.91 | 1424 | 316 | 209 | 8 | 68 |
2 | 88.81 | 1435 | 303 | 211 | 8 | 68 |
3 | 89.01 | 1432 | 310 | 207 | 8 | 68 |
4 | 88.76 | 1435 | 302 | 212 | 8 | 68 |
That looks decently stable to me. Though there is definitely something else going on.
In the process of getting some more logging, I changed the perf test output so it logs everything. Now I can see the following warning (Click me 👻)
18:19:02 (22936) WARN ChildProcessProxy Child process [pid 21972] exited unexpectedly with exit code 1 (without signal). Last part of stdout and stderr was:
        (node:21972) DeprecationWarning: Configuration via mocha.opts is DEPRECATED and will be removed from a future version of Mocha. Use RC files or package.json instead.
        (Use `node --trace-deprecation ...` to show where the warning was created)
        events.js:291
              throw er; // Unhandled 'error' event
              ^

        Error: connect EADDRINUSE 127.0.0.1:58534
            at TCPConnectWrap.afterConnect [as oncomplete] (net.js:1144:16)
        Emitted 'error' event on Socket instance at:
            at emitErrorNT (internal/streams/destroy.js:100:8)
            at emitErrorCloseNT (internal/streams/destroy.js:68:3)
            at processTicksAndRejections (internal/process/task_queues.js:80:21) {
          errno: -4091,
          code: 'EADDRINUSE',
          syscall: 'connect',
          address: '127.0.0.1',
          port: 58534
        }
         ChildProcessCrashedError: Child process [pid 21972] exited unexpectedly with exit code 1 (without signal). Last part of stdout and stderr was:
        (node:21972) DeprecationWarning: Configuration via mocha.opts is DEPRECATED and will be removed from a future version of Mocha. Use RC files or package.json instead.
        (Use `node --trace-deprecation ...` to show where the warning was created)
        events.js:291
              throw er; // Unhandled 'error' event
              ^

        Error: connect EADDRINUSE 127.0.0.1:58534
            at TCPConnectWrap.afterConnect [as oncomplete] (net.js:1144:16)
        Emitted 'error' event on Socket instance at:
            at emitErrorNT (internal/streams/destroy.js:100:8)
            at emitErrorCloseNT (internal/streams/destroy.js:68:3)
            at processTicksAndRejections (internal/process/task_queues.js:80:21) {
          errno: -4091,
          code: 'EADDRINUSE',
          syscall: 'connect',
          address: '127.0.0.1',
          port: 58534
        }

    at ChildProcessProxy.handleUnexpectedExit (C:\Data\stryker\perf\test\express\node_modules\@stryker-mutator\core\src\child-proxy\ChildProcessProxy.js:32:37)
    at ChildProcess.emit (events.js:314:20)
    at maybeClose (internal/child_process.js:1051:16)
    at Process.ChildProcess._handle.onexit (internal/child_process.js:287:5) {
  innerError: undefined,
  pid: 21972,
  exitCode: 1,
  signal: null
}
The—not very helpful—warning comes up once or twice per run.
Lakitna
on 2 Sep 2020
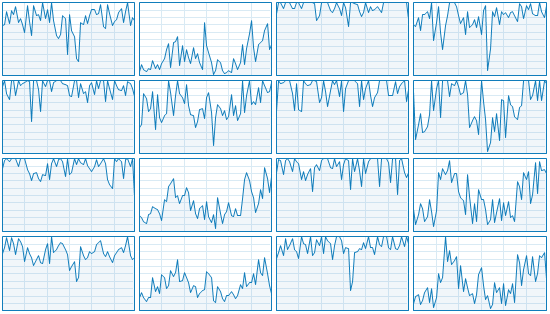
Oh interesting. I just found out about the dots reporter (the JSON schema should probably get an enum for reporters). With dots we can visualize when the timeouts happen.
Run 1 (Click me 🧷)
EE.....EE......S......S.S................SE.EEE....S.SSS.....S........S..SS.....
E.E......EE..E.E.S..............................ETSE.STT.EET..TT.T.T..ET........
................................T.......T...S..S......S.S..................S..E.
SSSTT....T.TTTTT.TTT.TT.T.TTTTTT...STSETT.TTTT.T.ETTTTETEETTESSSSTSTTTET..S.....
...T............T.....TS..T.........SSSSST.SSSS.SS............SSSS......S.......
..............TTT...............TT..................S.......STTTTTTTTTT.TT.TTT.T
TTTT...TT.T.ST.............S..T..T.E.......................TTT.......S......S.S.
TT..T....S.S...SSSS.....TT..............T..STTT.........TTTTTTTTTTTTTTTT..TTTTTT
TTTSSSS.TTT.T..T.....T.....T.TTT.TTST..T....................................S...
................S......S...............S.................T.T...........T........
TT..T..T.STTSTTT....TTTTT.........T..TT.T..STTTST..........TTTTT.........T......
........TSTTT.T.....S.......S...........TTT....TTTT...TTTT.T......T.............
..........TTST.S....SS........................S.......................SS.....TS.
.......S.T.T......SS.SSSS.TTS...TSTTT....SSS.SS....T.........S.S.......T...T.T..
..TTT.T.......ET..E.SE...T...S......SSSSS.SS............SSSSS.........T.S.T.....
..T..................S.STT.....S.T......T.SS......T..................TT.T.......
.........S.....T.....S..S...T.........................S..SS........S.SS...SSS...
...................T..S......T....S...S...TT.T........EE.ETTTTS.T.EEEETE.T.E..E.
EEE....TTTTT..E...E.............TST..TTTTTTTTT.TTTTTT..S...S..ST.........TT.....
SS..SS..SS..S.....T...TT....S....ST.......................SSSSSEESSEEE..........
.....TTTT........TT...TT.T...TT..T..T.S....T...T..T.................T....S...S..
.SSSS.E...........S..SSS..S.S.......S.S...T............ST.S.ST.S.TST.S..........
...............SSSE...EE.E.EE..S.SSS.TE.TTT..TT....TT.T..........S..........ST..
..S.S.......S..T.SSSSSSSS...T..EE......TT......E..T.T......TT..T............EETT
T...EEESETT...TT.....T.........................SS..S..SS..............SS....T...
S...TS.STTTT.TT.T
Run 2 (Click me :octocat:)
EEEE...................S...................SEEEE.SSS........S.....TT..S........E
T..E..E...E..E.E.STT............................E..E.....EETT.........E.........
T.T.....T..T..........T...........S.....T.....S.SS......S.S................STTS.
ESSSS..........TTTTT....TTTTTT.TTT..SSE..TT.TT..E.T...E...EEES.SSSS.T.E.........
..............T.TTT...............TSSSSSSS.SSTTTT.STT.ST..T..S.S.S..............
...S....................................................S......S..TTT.TTTTT.TTTT
TT...T....T..S..T.TTT........ST....E.........................T.....T..S....S..S.
....T.......SSS.SSS..T.....................S...TT.TTTT.TT...TTTTTTTTTT.T.T..TTSS
SS.TTTT.T.TTTTT......T.T.......S.......T........S.S...........T.........S.STT...
................S......S..T.T.T..........S.....................S...T............
...........TSTT....TTTTT.TTT...T....T.....T.TSSTT.......T...TTT........T........
..T...T.TTTT.TT...............S.TSS........TTTT...............T........TT..T....
...........SS......S..S......................S.......................SS.....S...
.....S.........TSSS...SSS..TS...TTSTT....S..........T......SS..TT.T..........TT.
..............ESETTETT........S.......SSSSSSS.......S......SSSSS.....TT.TT.....T
...............T...T..SS......S.T.........SST..TT......................T.T......
.....S...............S..S.......T....................S.S...S.......S.SS..SSS....
..................................S..S.S..........T.TTEETTETS..TTTETEEEE..TSTTEE
EEE.......T.T.E...ET....TT......T.S.....TTTTT..TT.T.TTT....S.S..S.........T..T.S
....SSS..S..SS..............S.S..T....T...........S..SSS......E..EEEE..........T
..................TTTTT.T.TT........TTTTS.....................................S.
..SSSSTE........T....TSSSS..S.....S....S....S............SSS.T.S.SS.............
............T.SSS.E...EE..EE..E..SSSS.E......T.TT....T.T.....T..S....SS.........
S....S....T.....SSSSSSSS..T....EE....TTTT..TTTTET.T..TTTT..TTT.T..S........ETET.
EEEES.TT......T.ST........T.T.T..................SS...S.S.S.........T...........
..S.TS.TSSST....T
If I replace the Ss and Es with .s (we care about the Ts here)
Run 1 (Click me 🧷)
................................................................................
.................................................T....TT...T..TT.T.T...T........
................................T.......T.......................................
...TT....T.TTTTT.TTT.TT.T.TTTTTT....T..TT.TTTT.T..TTTT.T..TT.....T.TTT.T........
...T............T.....T...T..............T......................................
..............TTT...............TT...........................TTTTTTTTTT.TT.TTT.T
TTTT...TT.T..T................T..T.........................TTT..................
TT..T...................TT..............T...TTT.........TTTTTTTTTTTTTTTT..TTTTTT
TTT.....TTT.T..T.....T.....T.TTT.TT.T..T........................................
.........................................................T.T...........T........
TT..T..T..TT.TTT....TTTTT.........T..TT.T...TTT.T..........TTTTT.........T......
........T.TTT.T.........................TTT....TTTT...TTTT.T......T.............
..........TT.T...............................................................T..
.........T.T..............TT....T.TTT..............T...................T...T.T..
..TTT.T........T.........T............................................T...T.....
..T.....................TT.......T......T.........T..................TT.T.......
...............T............T...................................................
...................T.........T............TT.T............TTTT..T.....T..T......
.......TTTTT....................T.T..TTTTTTTTT.TTTTTT..........T.........TT.....
..................T...TT..........T.............................................
.....TTTT........TT...TT.T...TT..T..T......T...T..T.................T...........
..........................................T.............T....T...T.T............
.....................................T..TTT..TT....TT.T......................T..
...............T............T..........TT.........T.T......TT..T..............TT
T........TT...TT.....T......................................................T...
....T...TTTT.TT.T
Run 2 (Click me :octocat:)
..................................................................TT............
T.................TT.......................................TT...................
T.T.....T..T..........T.................T...................................TT..
...............TTTTT....TTTTTT.TTT.......TT.TT....T.................T...........
..............T.TTT...............T..........TTTT..TT..T..T.....................
..................................................................TTT.TTTTT.TTTT
TT...T....T.....T.TTT.........T..............................T.....T............
....T................T.........................TT.TTTT.TT...TTTTTTTTTT.T.T..TT..
...TTTT.T.TTTTT......T.T...............T......................T............TT...
..........................T.T.T....................................T............
...........T.TT....TTTTT.TTT...T....T.....T.T..TT.......T...TTT........T........
..T...T.TTTT.TT.................T..........TTTT...............T........TT..T....
................................................................................
...............T...........T....TT.TT...............T..........TT.T..........TT.
.................TT.TT...............................................TT.TT.....T
...............T...T............T...........T..TT......................T.T......
................................T...............................................
..................................................T.TT..TT.T...TTT.T......T.TT..
..........T.T......T....TT......T.......TTTTT..TT.T.TTT...................T..T..
.................................T....T........................................T
..................TTTTT.T.TT........TTTT........................................
......T.........T....T.......................................T..................
............T................................T.TT....T.T.....T..................
..........T...............T..........TTTT..TTTT.T.T..TTTT..TTT.T............T.T.
......TT......T..T........T.T.T.....................................T...........
....T..T...T....T
@Lakitna it is strange for me that it runs much slower and you get more timeouts than me :/ I have much worse processor and less RAM....
Just to be sure I have made allocation track and I'll be analising it soon
 kmdrGroch
on 2 Sep 2020
kmdrGroch
on 2 Sep 2020
So I was thinking... How do we support infinite loops in mutation tests?? I guess if there is no return and we are waiting for the memory overflow isnt a big performance and memory issue? Maybe we could somehow detect in a better way if we are in infinite loop?
kmdrGroch
on 2 Sep 2020
Memory overflow only occurs with infinite recursion, not with loops. For loops we rely on the timeout.
Detecting obvious infinite loops is very doable. I've seen @nicojs talk about it before. But we would still need a catch-all for complexer cases.
I am now wondering about the impact infinite recursion though.
Lakitna
on 2 Sep 2020
i mean if it is a simple recursion there shouldnt be any problem, but if you add some expensive data structures + adding them to for example global array/object it could increase memory usage...
kmdrGroch
on 2 Sep 2020
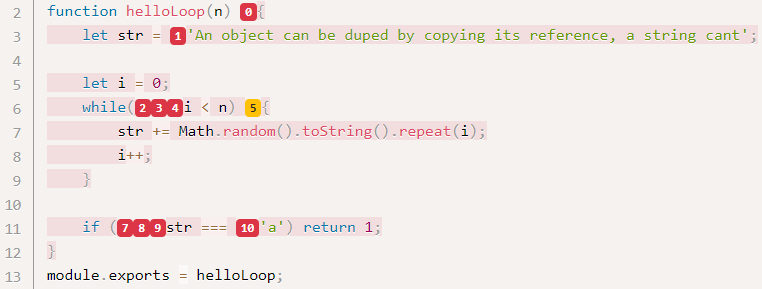
infinite recursion could be somewhat checked, but im not sure if its good tho... Simple recursion:
function fib(a, b) {
   return fib(a + b, a -b);
}
(its not working code, but just to ilustrate)
we could check if one function calls itself and if it does (for example 50 times), we could consider it as a leak
kmdrGroch
on 2 Sep 2020
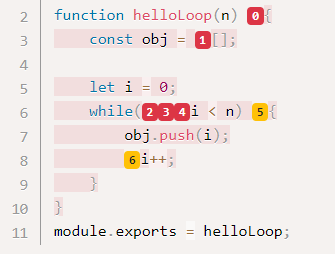
@Lakitna
what about
const obj = [];
let i = 0;
while(true) { // mutated
 obj.push(i);
  i++;
}
that would add elements to obj infinitely 🤔
kmdrGroch
on 2 Sep 2020
I've been trying to break stuff. Infinite recursion doesn't really seem to be an issue here.
It kills all mutations that cause infinite recursion, but the impact on memory and CPU usage is minimal.
I'll try to set up your example @kmdrGroch
Lakitna
on 2 Sep 2020
@kmdrGroch your example also seems to be not very impactful. It might be V8 stepping in with optimisations though.
I've tried my best to worsen the situation, but again not a huge impact. It just has to wait for the timeout.
Notice how it threw a different timeout here.
Of course, there is a time cost here. When running the code as above it took about 26 seconds. When swapping it out for a for loop it takes 15. These things do have an impact, but it's not so bad in practice.
That being said, I think we should investigate these things further at some point.
Lakitna
on 2 Sep 2020
Thanks for these examples @Lakitna they will probably help us in the future :)
kmdrGroch
on 2 Sep 2020
Ok, did some more tests and have more bad news. Without focussing on the flaky timeouts.
(--concurrency left to _default_)
| Stryker version | Coverage Analysis | OS | % score | # killed | # timeout | # survived | # no cov | # error | duration | AVG tests/mutant |
|---|---|---|----|---------|----------|-----------|------------|----------|--|--|
| 4.0.0-beta.4 | perTest | WSL2 | 85.64 | 1518 | 158 | 273 | 0 | 68 | 00:08:29 | 78.23 |
| 4.0.0-beta.4 | all | WSL2 | 95.40 | 1774 | 93 | 82 | 0 | 68 | 00:08:57 | 157.17 |
| 3.3.1 | perTest | WSL2 | 98.37 | 1909 | 20 | 32 | 0 | 153 | 00:01:58 | 32.07 |
| 3.3.1 | all | WSL2 | 98.78 | 1893 | 44| 24| 0 | 153 | 00:02:18 | 27.28 |
- Comparing
perTestv4.beta to the rest, you can see that the score is a big difference. This is definetly a problem. - You can also see the average tests per mutant is far higher in v4.beta compared to v3. This also needs to be investigated.
- You can also see that V3.3.1 also runs _a lot faster_ on v3 on WSL2. This might be a bug in v3, or problems in V4. Needs investigating.
🤷♂️
nicojs
on 3 Sep 2020
I've got the feeling it has to be something specific to express in this case. Running Stryker on @stryker-mutator/core yields far more predictable results.
| Stryker version | Coverage Analysis | OS | score | killed | timeout | survived | no cov | error | duration |
|---|---|---|----|---------|----------|-----------|------------|----------|--|
| 4.0.0-beta.4 | all | WSL2 | 67.21% | 1861 | 47 | 491 | 440 | 1 | 00:27:20 |
| 4.0.0-beta.4 | perTest | WSL2 | 67.07% | 1865 | 39 | 495 | 440 | 1 | 00:05:55 |
The difference in survived here needs investigation. See #2456
As for express, I will try to find the cause for the changes a little bit longer, but if we can't find it, I think we should move to a different project for our performance testing 😥
nicojs
on 3 Sep 2020
You can also see the average tests per mutant is far higher in v4.beta compared to v3. This also needs to be investigated.
This might be the issue in my project. That's mainly a runtime issue. It stands to reason that a higher test/mutation ratio results in a significantly longer run.
As for express, I will try to find the cause for the changes a little bit longer, but if we can't find it, I think we should move to a different project for our performance testing 😥
I'll go ahead and look for a decently sized Typescript project. It would give more data points as well as something with instrumentation.
Lakitna
on 3 Sep 2020
It took me way to long to come with this suggestion: We're facing issues in a mutli-threaded thing (It's actually multi-process—semantic details). Any time an issue arises in such a process the first thought should be race conditions. In this case, it's actually pretty easy to find out if we're dealing with a race condition. We can run with concurrency: 1.
Running this way obviously increases execution time dramatically. That's ok, we're looking for stability here.
Stryker version | concurrency | Coverage Analysis | OS | score | killed | timeout | survived | no cov | error | avg mutants/test | duration | log |
|---|---|---|---|---|---|---|---|---|---|---|---|---|
4.0.0-beta.4 | 1 | perTest | Win10 2004 | 84.82% | 1527 | 133 | 289 | 8 | 68 | 0.00 | 00:33:43 | run1.log
4.0.0-beta.4 | 1 | perTest | Win10 2004 | 84.77% | 1527 | 132 | 290 | 8 | 68 | 0.00 | 00:32:41 | run2.log
4.0.0-beta.4 | 1 | perTest | Win10 2004 | 84.82% | 1531 | 129 | 289 | 8 | 68 | 0.00 | 00:32:44 | run3.log
4.0.0-beta.4 | 1 | perTest | Win10 2004 | 83.80% | 1506 | 134 | 309 | 8 | 68 | 0.00 | 00:33:32 | run4.log
4.0.0-beta.4 | 1 | perTest | Win10 2004 | 86.36 | 1566 | 124 | 259 | 8 | 68 | 0.00 | 00:31:47 | run5.log
I think it's safe to say that instabilities exist without any of the multi-process stuff. The only conclusion I can draw from this is that there must be a race condition or something in each process.
Some questions that come to mind here:
- How much of Stryker is async?
- How often are the following used:
Promises.any,Promises.race. - How often are operations blocked?
- I/O
- Promises
- Long-running sync code
- etc.
I'll see if I can run the bench with the 0x profiler. I'm not sure if it'll even work for child processes though.
Lakitna
on 4 Sep 2020
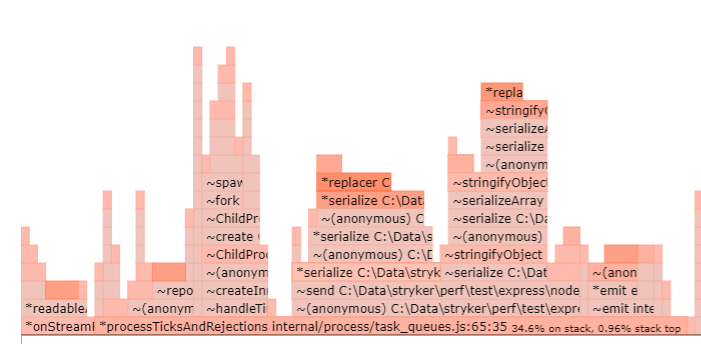
I've run again with concurrency: 1. This time I asked a profiler to take a look with me. The profiler was nice enough to generate this report.
I'm not familiar enough with the codebase to get any meaningful data out of it. @nicojs can you take a look? The flame graph shows how long each function was on the top of the stack. With this, you can find which parts of Stryker take a lot of time.
The graph was generated with 0x. Take a look at their repository if you need more details
Lakitna
on 4 Sep 2020
It seems that surrial is taking a lot of time (i think around 14% if i count or correctly, if not 6-8%). Right now im testing on node v13 if there is a better / faster way to solve it (it doesnt work on node lower than 13 [i think late 12 should work but dunno])
I'll take a look into surrial for sure, coz we will support older versions of node for a long time for sure...
there must be a way to increase performance :)
kmdrGroch
on 5 Sep 2020
@Lakitna could you share how did you run this flamegraph?
concurrency: 1 and then 0x -- ts-node tasks/run-perf-tests.ts?
kmdrGroch
on 5 Sep 2020
@kmdrGroch You actually have to directly call the .js script as if you're running with the node command. For the run I used this:
0x C:\Data\stryker\perf\test\express\node_modules\@stryker-mutator\core\bin\stryker run
Notice how I had to tap straight into node_modules. The stryker repo root folder on my machine is at C:/Data/stryker.
I found it easier to run this one first to make sure it works:
node C:\Data\stryker\perf\test\express\node_modules\@stryker-mutator\core\bin\stryker run
I haven't looked into profiling a testrunner process yet. That would have to be handled in the process spawning code.
Lakitna
on 6 Sep 2020
Thank you! I'll take a look in free time. I have done some optimisations to surrial and i would like to try them by running this script :)
tho i think most of the problem will exist, since there are lots of regexps in that package, which i cant simply remove :/ and its the only package we have some influence (another one is typescript / babel) but welp, we cant do anything about thats performance
if possible i would like to remove serialization step, because it takes a lot of time and space :/,
maybe making a map or object and storing it there (since child_process doesnt support objects, especially exceeding JSON standards), and use stirngs as references to these objects - that would reduce memory usage (since we are just moving pointer), and would remove slow serialization :)
i think that would speed up stryker (at least core package), by 5-10%
kmdrGroch
on 6 Sep 2020
i think that would speed up stryker (at least core package), by 5-10%
That would be an awesome optimization. That would be in the instrumentation phase, right?
If profiling the core process helps with optimizing it 5-10%, I think it'll be worth spending the time to profile the test runner processes. The test runner processes are extra sensitive to performance changes because they run multiple times in parallel.
Is a profiling mode something we should want to build into the repo permanently? It would have to run every process with something like 0x.
Lakitna
on 6 Sep 2020
honestly i dunno... its just my train of thought..
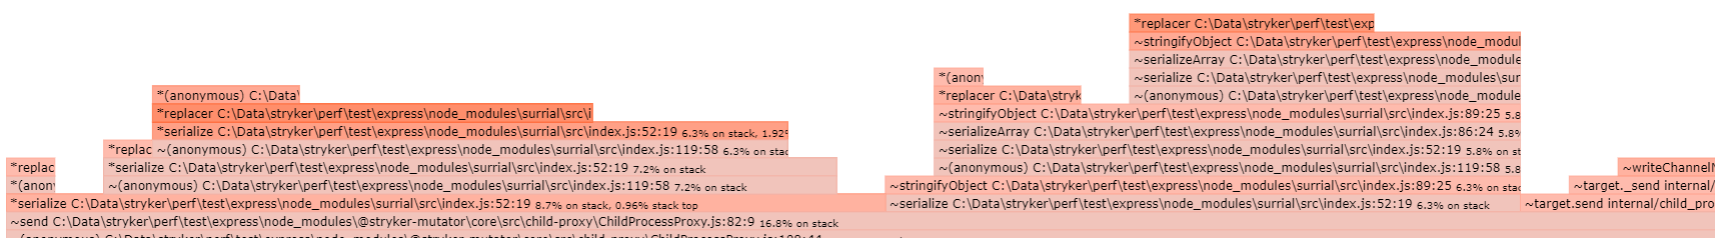
as you can see here, there is a lot of serialization here, it takes a lot of time...
about adding profiling mode... I dont think its necessary... just like we dont run mutation testing everywhere 🤔
tho it would be nice to maybe have some script for it, just like we do for mutation testing, linting etc. so sometimes we could run performance profiling. Or it could be added into PERF task
kmdrGroch
on 6 Sep 2020
I'll talk about serialization with Nico during next meeting I guess since I'll need some of his help with this :)
kmdrGroch
on 6 Sep 2020
about adding profiling mode... I dont think its necessary... just like we dont run mutation testing everywhere 🤔
tho it would be nice to maybe have some script for it, just like we do for mutation testing, linting etc. so sometimes we could run performance profiling. Or it could be added into PERF task
Yeah, I was thinking more in the line of npm run perf:profiled (profiled performance tests) or even go all out and add stryker profile/stryker run --profile (distribute profiling mode to everyone). The latter might also be interesting for debugging slow-running test suites.
Lakitna
on 6 Sep 2020
I find it very interesting, I would gladly fork your job if you want to make something like this. I do love optimisations and performance profiling :)
kmdrGroch
on 6 Sep 2020
I may have found a better solution for looking into the performance of processes. Sneak preview of core process:
How to see results above
- Open Chrome (or another Chromium browser)
- Go to
chrome://inspect - Click 'Open dedicated DevTools for Node'
- Click tab 'Profiler'
- Click the
Loadbutton - Load
.cpuprofilefile
How to record performance
There are more options, I'm looking into alternatives that suit Stryker better.
- Open Chrome (or another Chromium browser)
- Go to
chrome://inspect - Click 'Open dedicated DevTools for Node'
- Click tab 'Profiler'
- Run Stryker with the
--inspect-brkflag. This will start Stryker with the DevTools protocol active and it will break on the first statement. We use this break to make sure we record the CPU profile from the beginning. You can run with--inspectif you don't want to break. - Wait until the DevTools picks up the process.
- Click the record button (top left). Stryker will now start, and the CPU profile is recorded.
- Wait until Stryker is done.
- Stop the recording.
I'll dig a bit deeper into this Node feature. I hope we can do this with child processes as well.
Lakitna
on 7 Sep 2020
I've dug a bit deeper and found a few things:
Stryker does not close it's child processes when the main process is killed. This is a separate issue.
We can make all child processes show up in the Chrome Node DevTools by calling the child process spawning with --inspect. We can do this in ChildProcessProxy.
We can profile all child processes automatically with the help of chrome-remote-interface. This gives us access to the DevTools profiler. With a little bit of code, we can make all child processes produce a .cpuprofile file with no need for human action. This code would live in ChildProcessProxyWorker.
I've only managed to profile the child process setup so far. And that part is not very interesting. I start profiling when the child process starts. I want to stop the profiling with process.on('kill', ...) (or close, or anything that signals the end of the process really). However, these events are never emitted. In fact, I can't seem to get any life cycle events for the child processes or the main process.
We can also use this method to get access to the console and debugging of child processes. This can be very nice during development.
I'll open a PR so you can take a look with me. Though it's very very WIP 😄.
Lakitna
on 7 Sep 2020
@Lakitna about the first post. Both of techniques are good. I would really want to use both, not only chrome profiling :)
About the second. Its kinda strange that child processes are not killed... they should be 🤔 but we should take a look at the listeners coz it appears that sometimes garbage collector doesnt clear them. I mean like, if you have shared object which is used by listener, it is not cleared because of this listener (EVEN IF LISTENER IS NULL'ED!). We should check if we need weakrefs for that or not. But its a separate issue. Also if you want to look what i meant by removing serialization: https://github.com/kmdrGroch/stryker/tree/testSerialization. Its still not working coz of childProcessWorker, but thats the main idea about it
kmdrGroch
on 7 Sep 2020
@kmdrGroch Working on this gave me a better understanding of the serialization you're working on. That does seem like a good step. But I wonder if Node is serializing under the hood. If Node is, the performance gains might be too small for the effort involved. I'm really not sure how these inter-process protocols work though.
I would really want to use both, not only chrome profiling :)
Actually it looks like 0x is using the same type of profiler and such. It just represents the data differently. Maybe we can use the DevTools output as the input for 0x or something like that. But, that's all future stuff.
Lakitna
on 7 Sep 2020
node child_process does some serialization since v13 / 14 but its not switched on by default, and it doesnt work for Maps, classes etc. [Also, it only works in child_process. I think it does not in process]
so what basically is done in ChildProcess... (our classes) is changing all these objects to big strings (sth like JSON.stringify), and sending them. It is slow process (serialization is slow) and sending is impared by that too. If we were to make a map -> random ID string to a pointer to object. We could only send ID string so 1. its smaller. 2. we dont need serialization anymore :)
kmdrGroch
on 7 Sep 2020
Sorry, I'm a bit behind on this conversation
I have done some optimisations to surrial and I would like to try them by running this script :)
Please don't. I want to swap it out for serialize-javascript sometime soon. We had valid reasons for our very own surrial before, but they are no longer needed. We're no longer serializing class instances (i.e. File) across processes. Serialize-javascript has a lot of dependent packages, a lot of users who are also looking at performance.
We also trimmed down on the amount of data to serialize/deserialize in v4. Previously we serialized all tests that ran in a test run for example, nowe we only send the amount that ran and the ID of the test that killed the mutant (if it exists). Although ID's are full test names in jests or mocha's case. :/
In other news, I'm chasing memory leaks. I don't want to spoil the surprise (PR incoming), but we indeed got some :/
nicojs
on 7 Sep 2020
@nicojs we could remove serialization in 100% IMO. We should talk it through later (if you have some time during week, or during stryker meeting)
kmdrGroch
on 7 Sep 2020
we could remove serialization in 100% IMO. We should talk it through later (if you have some time during week, or during stryker meeting)
I don't see how, to be honest. I'm open to suggestions of course.
However, I do think there are better ways to improve performance. A couple that comes to mind:
- Implement coverage analysis in the Jest runner #2316
- Hot reload for all test runners (mocha will be the first one here: #2413 )
- Implementing a sort of
--diffmode or incremental analysis: #322
For anyone interested in the memory leak I found: #2461
nicojs
on 8 Sep 2020
"I don't see how, to be honest. I'm open to suggestions of course." we can talk it through later on. I have some idea :)
kmdrGroch
on 9 Sep 2020
@nicojs do you have tomorrow / this week? I could show you my idea, and listen to your suggestions etc. :)
kmdrGroch
on 9 Sep 2020
I didn't expect a lot of difference between beta.4 and beta.5. Just to be sure some runs:
In 4.0.0-beta.5:
Concurrency | % score | # killed | # timeout | # survived | # no cov | # error | Avg tests/mutants | Duration
-------------|---------|----------|-----------|------------|----------|---------|-------|----------|
15 (default) | 90.05 | 1090 | 213 | 136 | 8 | 578 | 16.63 | 00:04:02 |
15 (default) | 89.17 | 1451 | 294 | 204 | 8 | 68 | 23.63 | 00:05:22 |
15 (default) | 88.71 | 1432 | 304 | 213 | 8 | 68 | 19.86 | 00:05:27 |
1 | 85.79 | 1550 | 129 | 270 | 8 | 68 | 90.78 | 00:32:04 |
1 | 86.82 | 1572 | 127 | 250 | 8 | 68 | 81.77 | 00:30:33 |
1 | 84.72 | 1524 | 134 | 291 | 8 | 68 | 100.08 | 00:33:58 |
Not sure what happened in the first run... But overall it seems to be pretty much the same result.
Currently, I'm running 15 runs with increasing concurrency. Might help with the default concurrency setting.
Lakitna
on 10 Sep 2020
I've run the Express bench in 4.0.0-beta.5 for every concurrency from 1 to default for my machine.
Concurrency | % score | # killed | # timeout | # survived | # no cov | # error | Avg tests/mutants | Duration
-------------|---------|----------|-----------|------------|----------|---------|-------------------|---------
1 | 85.74 | 1549 | 129 | 271 | 8 | 68 | 90.27 | 00:32:18
2 | 86.25 | 1555 | 133 | 261 | 8 | 68 | 79.01 | 00:18:06
3 | 89.06 | 1617 | 126 | 206 | 8 | 68 | 55.68 | 00:11:43
4 | 87.28 | 1577 | 131 | 241 | 8 | 68 | 61.21 | 00:10:06
5 | 88.20 | 1590 | 136 | 223 | 8 | 68 | 48.00 | 00:08:13
6 | 87.99 | 1579 | 143 | 227 | 8 | 68 | 54.59 | 00:07:52
7 | 88.50 | 1552 | 180 | 217 | 8 | 68 | 50.92 | 00:07:46
8 | 89.93 | 1592 | 168 | 189 | 8 | 68 | 43.11 | 00:06:27
9 | 89.42 | 1541 | 209 | 199 | 8 | 68 | 34.37 | 00:06:22
10 | 89.95 | 1088 | 210 | 137 | 8 | 582 | 22.65 | 00:05:16
11 | 90.24 | 1530 | 236 | 183 | 8 | 68 | 24.35 | 00:05:29
12 | 89.17 | 1494 | 251 | 204 | 8 | 68 | 28.48 | 00:05:45
13 | 89.61 | 1079 | 223 | 143 | 8 | 572 | 16.44 | 00:04:18
14 | 89.63 | 1487 | 267 | 195 | 8 | 68 | 21.43 | 00:05:06
15 | 89.17 | 1433 | 312 | 204 | 8 | 68 | 18.84 | 00:05:15
I created a Google Sheet to be able to draw charts out of this.
https://docs.google.com/spreadsheets/d/11dqDoxqbXVCQiBVtMq_eZpgMljTMPL-voI1MQdA-gDA/edit?usp=sharing
There is some interesting stuff in there I think.
Lakitna
on 10 Sep 2020
Yeah, we should try to figure out why there are differences. I think the previous runs are influencing new runs in the same process. Mocha attaches global handlers to the process and reporting the current run as failed.
https://github.com/mochajs/mocha/blob/b3eb2a68d345aa9ce5791dddfea41a13be743b78/lib/runner.js#L1063-L1066
For example, the done of middleware might not be called because of a mutant, but the express timeout for it might occur in the next run (just guessing here).
@Lakitna I'm curious what happens if you use the command test runner. That one creates clean processes per mutant. Should be very consistent each run, right?
nicojs
on 10 Sep 2020
I'm curious what happens if you use the command test runner.
Let's find out 😄 I'll run a bunch of times with a few different concurrencies. I'll probably do that tonight after work.
The quest for stable runs continues!
Edit: I have a command lined up for 16 runs. 2 each for the following concurrencies: 1, 3, 5, 7, 9, 11, 13, 15.
Lakitna
on 10 Sep 2020
@Lakitna you have 8 cores right? Looking at it 8 is a threshold for "stable" tests. So i guess instead of logical cores - 1 we should use physical ones
kmdrGroch
on 10 Sep 2020
I think the previous runs are influencing new runs in the same process.
This triggered me. I wonder if Mochas --bail can be the cause of this. Express uses it.
Looking at it 8 is a threshold for "stable" tests.
I still wouldn't call it fully stable, but it is a lot better.
Lakitna
on 10 Sep 2020
"I still wouldn't call it fully stable, but it is a lot better."
yea.. But timeouts are not a big deal. The bigger problem is that sometimes mutants are marked as killed and sometimes as survived... that bothers me the most... :/
unless its that some timeouts are just these missing ones, and there are new timeouts 🤔
kmdrGroch
on 10 Sep 2020
Exactly, if the score is stable I can live with some instabilities at this point. We've been working on this for quite a while now. But there is a 4.5 percentpoint difference between the highest scoring run and the lowest scoring run. That's a significant difference.
As a user I would find it annoying that the same line of code can be timeout one run, but killed the next. It's not good for the faith in Stryker.
Lakitna
on 10 Sep 2020
Oh man, runs with the command runner take a very long time.
Here are the results:
{
  "$schema": "../../../packages/core/schema/stryker-schema.json",
  "testRunner": "command"
}
Concurrency | % score | # killed | # timeout | # survived | # no cov | # error | Avg tests/mutants | Duration
------------|---------|----------|-----------|------------|----------|---------|-------------------|---------
15 | 99.70 | 1338 | 681 | 6 | 0 | 0 | 0.66 | 00:15:11
15 | 100.00 | 1394 | 631 | 0 | 0 | 0 | 0.69 | 00:14:13
13 | 100.00 | 1384 | 641 | 0 | 0 | 0 | 0.68 | 00:16:04
13 | 100.00 | 1319 | 706 | 0 | 0 | 0 | 0.65 | 00:16:39
11 | 99.95 | 1367 | 657 | 1 | 0 | 0 | 0.68 | 00:18:40
11 | 100.00 | 1334 | 691 | 0 | 0 | 0 | 0.66 | 00:18:59
9 | 100.00 | 1470 | 555 | 0 | 0 | 0 | 0.73 | 00:20:15
9 | 99.90 | 1510 | 513 | 2 | 0 | 0 | 0.75 | 00:20:10
7 | 99.65 | 1778 | 240 | 7 | 0 | 0 | 0.88 | 00:20:28
7 | 99.56 | 1760 | 256 | 9 | 0 | 0 | 0.87 | 00:21:09
5 | 99.11 | 1907 | 100 | 18 | 0 | 0 | 0.95 | 00:22:14
5 | 99.01 | 1912 | 93 | 20 | 0 | 0 | 0.95 | 00:21:26
4 | 98.02 | 1890 | 95 | 40 | 0 | 0 | 0.95 | 00:26:56
4 | 97.68 | 1894 | 84 | 47 | 0 | 0 | 0.96 | 00:26:19
3 | 97.09 | 1867 | 99 | 59 | 0 | 0 | 0.95 | 00:32:29
3 | 97.23 | 1872 | 97 | 56 | 0 | 0 | 0.95 | 00:32:23
1 | 85.53 | 1587 | 145 | 293 | 0 | 0 | 0.93 | 01:54:31
1 | 85.98 | 1594 | 147 | 284 | 0 | 0 | 0.93 | 01:52:45
I've updated the Google sheet accordingly. See the second tab https://docs.google.com/spreadsheets/d/11dqDoxqbXVCQiBVtMq_eZpgMljTMPL-voI1MQdA-gDA/edit?usp=sharing
In this setup, the run becomes useless with >= 9 concurrency. After that, it becomes slightly more useful with every step down in concurrency. Timeouts stabilize with <= 5 concurrency but survived doesn't. At concurrency 1 things became less stable, but the system was used more during the 1 runs.
Execution times are also interesting here. There is a huge gap between concurrency 5 and anything below that. I'll queue up some concurrency 4 later to see how long those take. This one can have a major impact on CI. Update: Concurrency 4 actually clocks in smack in the middle of 3 and 5. The trendline seems to be pretty accurate.
I think it's weird we're not seeing the expected stability here. According to these numbers, the Mocha runner is actually more stable across concurrencies. It is notable that running multiple times with the same concurrency is very stable.
Finally a fun fact: These numbers correspond to a total runtime of 09:30:51. My poor CPU 😄
Lakitna
on 11 Sep 2020
I've removed the milestone. We still want to find the root cause of the discrepancies in timeouts. Pretty sure it's something specific in express tests, but we don't want to block the 4.0 milestone for this. Hope you agree @Lakitna
nicojs
on 25 Sep 2020
https://www.npmjs.com/package/mmap-object
https://www.npmjs.com/package/node-shared-cache-x
these two looks promising for now @nicojs
kmdrGroch
on 25 Sep 2020
Hmm I get where you're coming from. I don't like it though. The simple fact that this is possible feels iffy to me. I at least want to verify that we can make things work properly with another project.
How about https://github.com/tj/commander.js? It's CommonJS with Jest. 358 tests running in 7.369 seconds.
Lakitna
on 28 Sep 2020
@Lakitna I took a look at our serialization. Could you please run flamegraph again on branch https://github.com/kmdrGroch/stryker/tree/test? I would like to compare these 2.
(if interested in PR https://github.com/stryker-mutator/stryker/pull/2525)
kmdrGroch
on 3 Oct 2020
I had some busy times last week, so it's a bit later than usual. Here we go:
Branch | Concurrency | % score | # killed | # timeout | # survived | # no cov | # error | Avg tests/mutants | Duration | Flamegraph |
--------|------------|---------|----------|-----------|------------|----------|---------|-------------------|---------|---|
kmdrGroch/test | 15 | 88.71 | 1406 | 330 | 213 | 8 | 68 | 22.67 | 00:05:11 | flamegraph.zip
Tag: v4.0.0-beta.10 | 15 | 88.15 | 1401 | 324 | 224 | 8 | 68 | 24.24 | 00:04:59 | beta10.zip
Tag: v4.0.0-beta.9 | 15 | 88.50 | 1417 | 315 | 217 | 8 | 68 | 24.33 | 00:05:02 | beta9.zip
I'm not familiar enough with your changes to make any judgements here ;)
Lakitna
on 6 Oct 2020
Ok so it seems it reduces the time on childProcessProxies significantly (from 35% time to 19%):


But core package is not the one which is holding the performance back... So most likely optimisations are only to be done in instrumenter or runner packages
kmdrGroch
on 6 Oct 2020
and i see you ran code on beta 10, i think beta 9 is more relevant as a base test :)
kmdrGroch
on 6 Oct 2020
Yeah, I feel like it would be worth it to get profiling working on child processes. However, it would involve spawning the child processes in a different way. That stuff is finicky. I can get the child processes to show up in the Chrome inspector, but it won't actually create a profiling report due to the short life of the processes.
I've also added beta.9 to the results above ;)
Lakitna
on 6 Oct 2020
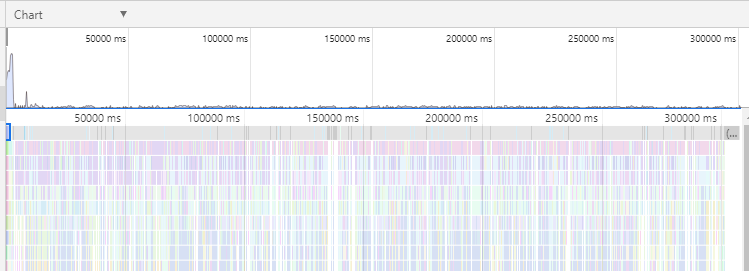
I've actually managed to get some CPU profiles from child processes! 😃
When running node with --cpu-prof we get a file that can be interpreted by the Chrome inspector. However, I don't seem to be able to find the actual tests in the profile. On top of that, I only seem to get 1 per full run. Edit: I just finished a run without any profiles. Could maybe have to do with some processes exiting differently in some edge cases.
Do the runner children exit with SIGKILL? A process ending in SIGKILL will not generate a CPU profile, there might be other signals that cause it to bail.
Download, extract, and open with Chrome inspector: child-process-289.zip
Preview:

Lakitna
on 6 Oct 2020
I think we had some issue that childprocesses don't exit in Linux (or at least in some runner cases). I'm not sure about exiting tho. From what I saw previously I noticed that unless there is "timeout" in process childprocess doesn't exit! It restarts when there is a timeout (the ones you can see after running mutation tests).
kmdrGroch
on 6 Oct 2020
And I'm not exactly sure how this inspector works. It's just messy for me :/ are you maybe free in several days and could give me an me tour in these reports?
kmdrGroch
on 6 Oct 2020
I think we had some issue that childprocesses don't exit in Linux (or at least in some runner cases).
Stryker itself will exit child processes when it runs to the end (either with error or not). However, I noticed hanging chrome browsers after running the karma integration tests on Linux, causing me to open #2519, but Gareth actually mentioned to me that he haven't noticed any dangling processes so that needs further investigation.
Do the runner children exit with
SIGKILL
Yes. Stryker uses tree-kill here: https://github.com/stryker-mutator/stryker/blob/d330af98141613cebd34a95b9fe85583e9af3b2b/packages/core/src/utils/objectUtils.ts#L51. However, the exit strategy hasn't been thought out carefully, if you know of a better way I'm totally open for suggestions.
nicojs
on 6 Oct 2020
I wonder if it's as simple as using SIGTERM instead of SIGKILL. If we keep treeKill in place, it should be fine in theory. I'll try some different signals.
I don't have access to a Linux machine at the moment though. Is this is a thing that can be tested in CI?
Lakitna
on 7 Oct 2020
if you have spare time you could always try WSL, its faster to setup than pure linux (unless you work on Mac)
kmdrGroch
on 7 Oct 2020
I've got it working! 🎉
It turns out SIGKILL wasn't the issue here. I had to call process.exit(0) when the child process gets its dispose message. This causes the child process to go through its exit procedures, which include generating the CPU profile. I'll make a PR in a bit ;)
These are all the CPU profiles I managed to generate with the Express bench. Notice how not every process generated a profile, probably due to crashing processes. Whoops, that's a big file! It's 38mb! Github doesn't like that, so here is a WeTransfer link: https://we.tl/t-V0M8XJ9WEF.
Since I didn't have to change SIGKILL it should all still work on Linux.
Lakitna
on 7 Oct 2020
It's just messy for me :/ are you maybe free in several days and could give me an me tour in these reports?
I'm also not an expert in any way. You might be better off looking for something on Youtube. However, the new profiles are a lot easier to read. There is actually stuff in there that I recognize ;)
Edit: It should be possible to make a 0x-style flame graph out of these cpu profiles. It'll require some D3 fiddling.
Lakitna
on 7 Oct 2020
Related issues
kmdrGroch
·
19Comments
 trollepierre
·
18Comments
trollepierre
·
18Comments
 simondel
·
17Comments
simondel
·
17Comments
 jtlimo
·
16Comments
jtlimo
·
16Comments
 Zorin95670
·
18Comments
Zorin95670
·
18Comments
Most helpful comment
Sorry, I'm a bit behind on this conversation
Please don't. I want to swap it out for
serialize-javascriptsometime soon. We had valid reasons for our very ownsurrialbefore, but they are no longer needed. We're no longer serializing class instances (i.e.File) across processes. Serialize-javascript has a lot of dependent packages, a lot of users who are also looking at performance.We also trimmed down on the amount of data to serialize/deserialize in v4. Previously we serialized all tests that ran in a test run for example, nowe we only send the amount that ran and the ID of the test that killed the mutant (if it exists). Although ID's are full test names in jests or mocha's case. :/
In other news, I'm chasing memory leaks. I don't want to spoil the surprise (PR incoming), but we indeed got some :/