Storybook: Inspector broken in React Developer Tools
Describe the bug
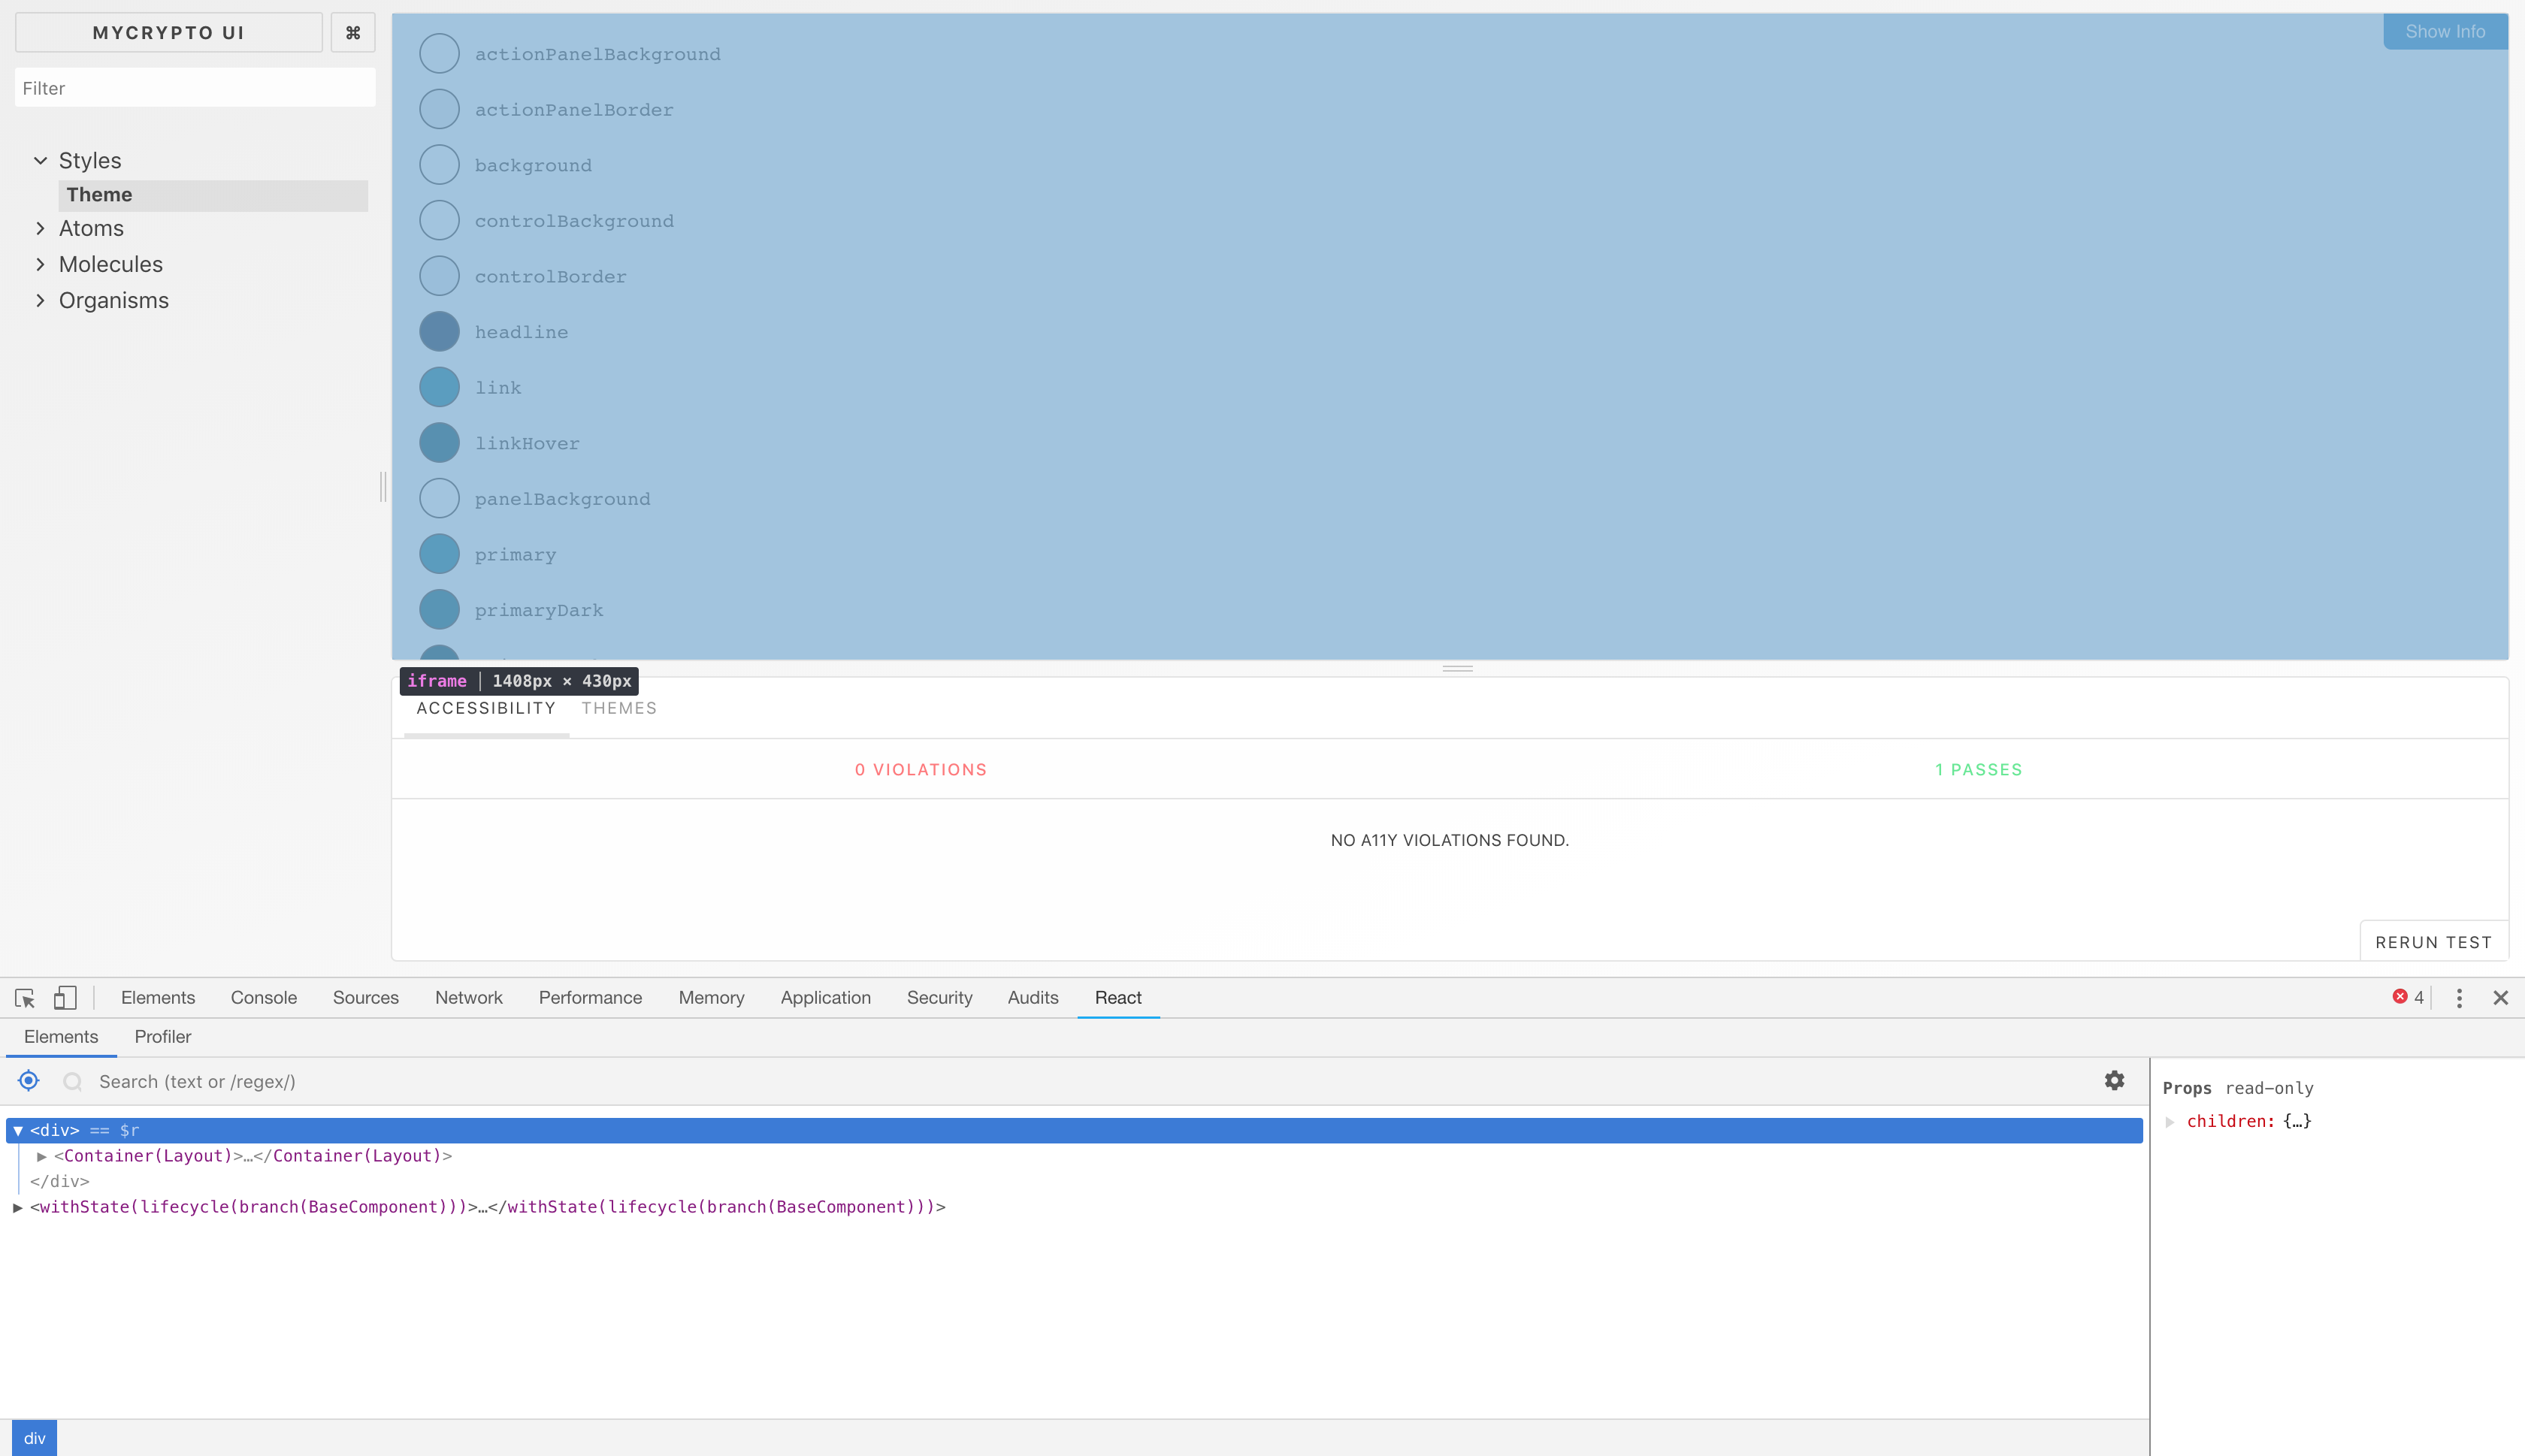
In Storybook 4, React devtools is now properly scoped to the story (rather than Storybook itself). However, the inspect button in devtools does not let you select anything within the story pane. Additionally, the scope is broken when doing a production build with storybook-build.
To Reproduce
Steps to reproduce the behavior:
- Open Storybook using Storybook React
- Install and open React devtools
- Note that story scope is properly displayed
- Click inspect button, then a component inside the story pane
- Note that nothing inside the pane can be selected
Expected behavior
Inspecting should work just like it does outside an iframe.
Screenshots
Code snippets
https://github.com/MyCryptoHQ/ui
System:
- OS: macOS
- Device: Macbook Pro 2015
- Browser: Chrome
- Framework: React
- Version: 4.0.0
 nickmccurdy
All 27 comments
I have this issue with 4.0.9 also but more, I have it with 3.4.11
 titimoby
on 29 Nov 2018
titimoby
on 29 Nov 2018
Hi everyone! Seems like there hasn't been much going on in this issue lately. If there are still questions, comments, or bugs, please feel free to continue the discussion. Unfortunately, we don't have time to get to every issue. We are always open to contributions so please send us a pull request if you would like to help. Inactive issues will be closed after 30 days. Thanks!
![stale[bot] picture](https://avatars3.githubusercontent.com/in/1724?v=4&s=40) stale[bot]
on 20 Dec 2018
stale[bot]
on 20 Dec 2018
I'm having the same issue - v4.1.4
 bkilrain
on 10 Jan 2019
bkilrain
on 10 Jan 2019
Hi everyone! Seems like there hasn't been much going on in this issue lately. If there are still questions, comments, or bugs, please feel free to continue the discussion. Unfortunately, we don't have time to get to every issue. We are always open to contributions so please send us a pull request if you would like to help. Inactive issues will be closed after 30 days. Thanks!
stale[bot]
on 7 Feb 2019
I'm still having this issue with Storybook 4.1.6
nickmccurdy
on 7 Feb 2019
A workaround is:
- Install react-devtools as standalone app globally:
npm i -g react-devtools - Inject in each iframe the tag
<script src ="http://localhost:8097"></script>through.storybook/preview-head.html.
Running up: react-devtools, it is possible to debug the components without problems.
Checked with [email protected]
 izamarro
on 11 Feb 2019
izamarro
on 11 Feb 2019
Hi everyone! Seems like there hasn't been much going on in this issue lately. If there are still questions, comments, or bugs, please feel free to continue the discussion. Unfortunately, we don't have time to get to every issue. We are always open to contributions so please send us a pull request if you would like to help. Inactive issues will be closed after 30 days. Thanks!
stale[bot]
on 5 Mar 2019
Is this still an issue in SB5?
 shilman
on 5 Mar 2019
shilman
on 5 Mar 2019
Is this still an issue in SB5?
Ya, looks like it. The inspector scopes to the iframe.
 jasonbarone
on 19 Mar 2019
jasonbarone
on 19 Mar 2019
Hi everyone! Seems like there hasn't been much going on in this issue lately. If there are still questions, comments, or bugs, please feel free to continue the discussion. Unfortunately, we don't have time to get to every issue. We are always open to contributions so please send us a pull request if you would like to help. Inactive issues will be closed after 30 days. Thanks!
stale[bot]
on 10 Apr 2019
It's still an issue, stalebot
 vdh
on 10 Apr 2019
vdh
on 10 Apr 2019
@wlkrdv 's solution (npm i -g react-devtools) is the official of react-devtools.
https://github.com/facebook/react-devtools/issues/76#issuecomment-280073254
Perhaps we can integrate react-devtools directly with @storybook/react package or something like @storybook/react-devtools.
(Note that I'm using storybook for implement component designs, so this is significant thing for me.)
 ypresto
on 15 Apr 2019
ypresto
on 15 Apr 2019
I suppose it's not a Storybook issue as it's more related to React Dev Tools but it really makes me wonder if people are actually using Storybook as a development sandbox. I don't really see how you can build React components without being able to use the dev tool.
The workaround doesn't actually work since you can't use the "target" (you have to open the tree manually one element after the other...).
 Grsmto
on 22 Apr 2019
Grsmto
on 22 Apr 2019
@Grsmto I use storybook all day and have never used react dev tools in my life 😉
What happens when you click the "eject" button in the upper-right hand corner of the SB5 UI to open the iframe in its own window? Does devtools work then?
shilman
on 22 Apr 2019
Yeah that's actually the right workaround here! Thanks! :)
Haha then you should try it, I can't do without it :p
Grsmto
on 22 Apr 2019
Hi everyone! Seems like there hasn't been much going on in this issue lately. If there are still questions, comments, or bugs, please feel free to continue the discussion. Unfortunately, we don't have time to get to every issue. We are always open to contributions so please send us a pull request if you would like to help. Inactive issues will be closed after 30 days. Thanks!
stale[bot]
on 13 May 2019
This issue has been a big headache for me when developing in Storybook, since the React Dev Tools' inspector is effectively broken.
There's a very roundabout workaround where I have to target the DOM element via Chrome's inspector, then make sure $0 targets a relevant element, and _then_ switch back to React Dev Tools, which hopefully jumps to the relevant React component due to the $0 integration. But it's quite a pain to do it that way.
vdh
on 15 May 2019
@vdh I was thinking the same as you but I changed my workflow and actually opening the playground in a separate window just works fine for me.
Especially since your DOM is not polluted with unrelated stuff from Storybook, you have really only your component, it's actually better.
Grsmto
on 15 May 2019
Hi everyone! Seems like there hasn't been much going on in this issue lately. If there are still questions, comments, or bugs, please feel free to continue the discussion. Unfortunately, we don't have time to get to every issue. We are always open to contributions so please send us a pull request if you would like to help. Inactive issues will be closed after 30 days. Thanks!
stale[bot]
on 5 Jun 2019
I feel like the only workarounds so far have been variations of "just don't do that", which isn't really a workaround at all.
vdh
on 5 Jun 2019
@vdh the definition of a workaround is that the user wants to do something, in this case select something in the story pane, and although there isn't a fix for it (the issue is still open) the user can hit the eject button, and achieve their goal. in addition it's actually a better DX. what am i missing here?
shilman
on 5 Jun 2019
As far as I'm aware Storybook is meant to be a development environment, and I expected it to support React devtools as a result. Is there a way this can be fixed? If not I like the idea of embedding React devtools directly, as it does have standalone components.
nickmccurdy
on 5 Jun 2019
@nickmccurdy i would gratefully accept a PR if you have a fix for this issue!
shilman
on 5 Jun 2019
@shilman The problem is that eject button is just a different page. So it doesn't solve the issue of the broken inspector so much as it just reroutes you away from the main Storybook UI completely so that you never use the inspector on it. Hence why it feels like a "just don't do that".
vdh
on 6 Jun 2019
I would like to add also that react dev tool has a great feature Highlight updates but it also does not work with storybooks in an iframe.
 darkowic
on 27 Jun 2019
darkowic
on 27 Jun 2019
Hi everyone! Seems like there hasn't been much going on in this issue lately. If there are still questions, comments, or bugs, please feel free to continue the discussion. Unfortunately, we don't have time to get to every issue. We are always open to contributions so please send us a pull request if you would like to help. Inactive issues will be closed after 30 days. Thanks!
stale[bot]
on 20 Jul 2019
Hey there, it's me again! I am going close this issue to help our maintainers focus on the current development roadmap instead. If the issue mentioned is still a concern, please open a new ticket and mention this old one. Cheers and thanks for using Storybook!
stale[bot]
on 19 Aug 2019
Related issues
 dmmarmol
·
57Comments
dmmarmol
·
57Comments
 ilias-t
·
73Comments
ilias-t
·
73Comments
 aericson
·
97Comments
aericson
·
97Comments
 p3k
·
61Comments
p3k
·
61Comments
 maraisr
·
119Comments
maraisr
·
119Comments
Most helpful comment
@Grsmto I use storybook all day and have never used react dev tools in my life 😉
What happens when you click the "eject" button in the upper-right hand corner of the SB5 UI to open the iframe in its own window? Does devtools work then?