Stdpopsim: spikes in the SFS when simulating with genetic map
Hey all--
@jradrion and I have been looking at the SFS produced by human models in an effort to debug stairwayplot a bit. We've noticed that simulating under a genetic map instead of a constant rates leads to strange spikes in the SFS.
Presumably these spikes are caused by low recombination regions of the simulated chromosome? As an empiricist, one would want to drop such regions from downstream analysis- should we consider doing the same here?
A minimum working example of this comparison can be found here. Run it a few times if you don't see a bigger spike in the genetic map case in the first run or two.
representative output looks like this
$ python testSFS.py
SFS with genetic map
[0.         0.41105418 0.15667424 0.10971423 0.10006515 0.03928301
 0.10844646 0.02769708 0.02285493 0.02421073]
SFS with constant rate
[0.         0.43990996 0.17313905 0.10304832 0.07146539 0.05412743
 0.04816482 0.03857653 0.0367551  0.03481339]
notice the freq=6 bin with the genetic map
thoughts?
 andrewkern
All 12 comments
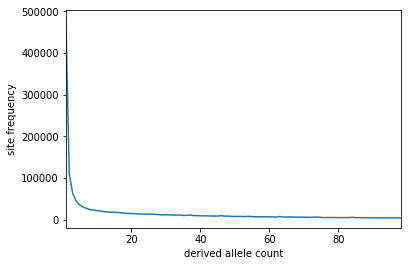
Just an update on this. I happened to have some forward simulations sitting around that used the Kong 2010 recombination map. Rather than from one entire chromosome/genome, these simulations are of random 1 Mb chunk (i.e. each replicate draws a random region from the Kong genetic map and uses that). Sample size is 100. I aggregated the SFS across these replicates and plot the result below (about 1.6 million SNPs in total). Not seeing any bumpiness here, so this might imply that the presence of low-recombining regions will not necessarily yield a spiky SFS. These are under the Tennessen Euro model (no admixture or migration), but results are similar under equilibrium--different looking SFS obviously but no bumps.
 dschride
on 20 Jun 2019
dschride
on 20 Jun 2019
just talked this over with @petrelharp for a bit. probably the best thing to do is to LD prune the set of SNPs generated for input to stairwayplot. We will implement this and report back.
andrewkern
on 20 Jun 2019
Well naive LD pruning didn't fix anything. Here is the updated MWE. I've used the locate_unlinked() function in scikit-allel for this simple pruning.
Here are results from a representative run:
SFS with genetic map
[0.         0.4647955  0.14670169 0.07419137 0.09670544 0.06728705
 0.02824765 0.02372983 0.02155347 0.07678799]
----------------------

SFS with genetic map, LD pruned
[0.         0.75392341 0.03672316 0.00627746 0.02605148 0.12680477
 0.01632141 0.00156937 0.00156937 0.03075957]
----------------------

SFS with constant rate
[0.         0.43086413 0.17660704 0.10381978 0.07665344 0.05579325
 0.0494699  0.03960685 0.03546575 0.03171985]
----------------------

SFS with constant rate, LD pruned
[0.         0.82556778 0.11191758 0.02154062 0.0063217  0.
 0.00140482 0.00398033 0.00608757 0.02317958]
I'm not confident that scikit-allel is doing what we want but haven't yet gone down that rabbit hole...
andrewkern
on 20 Jun 2019
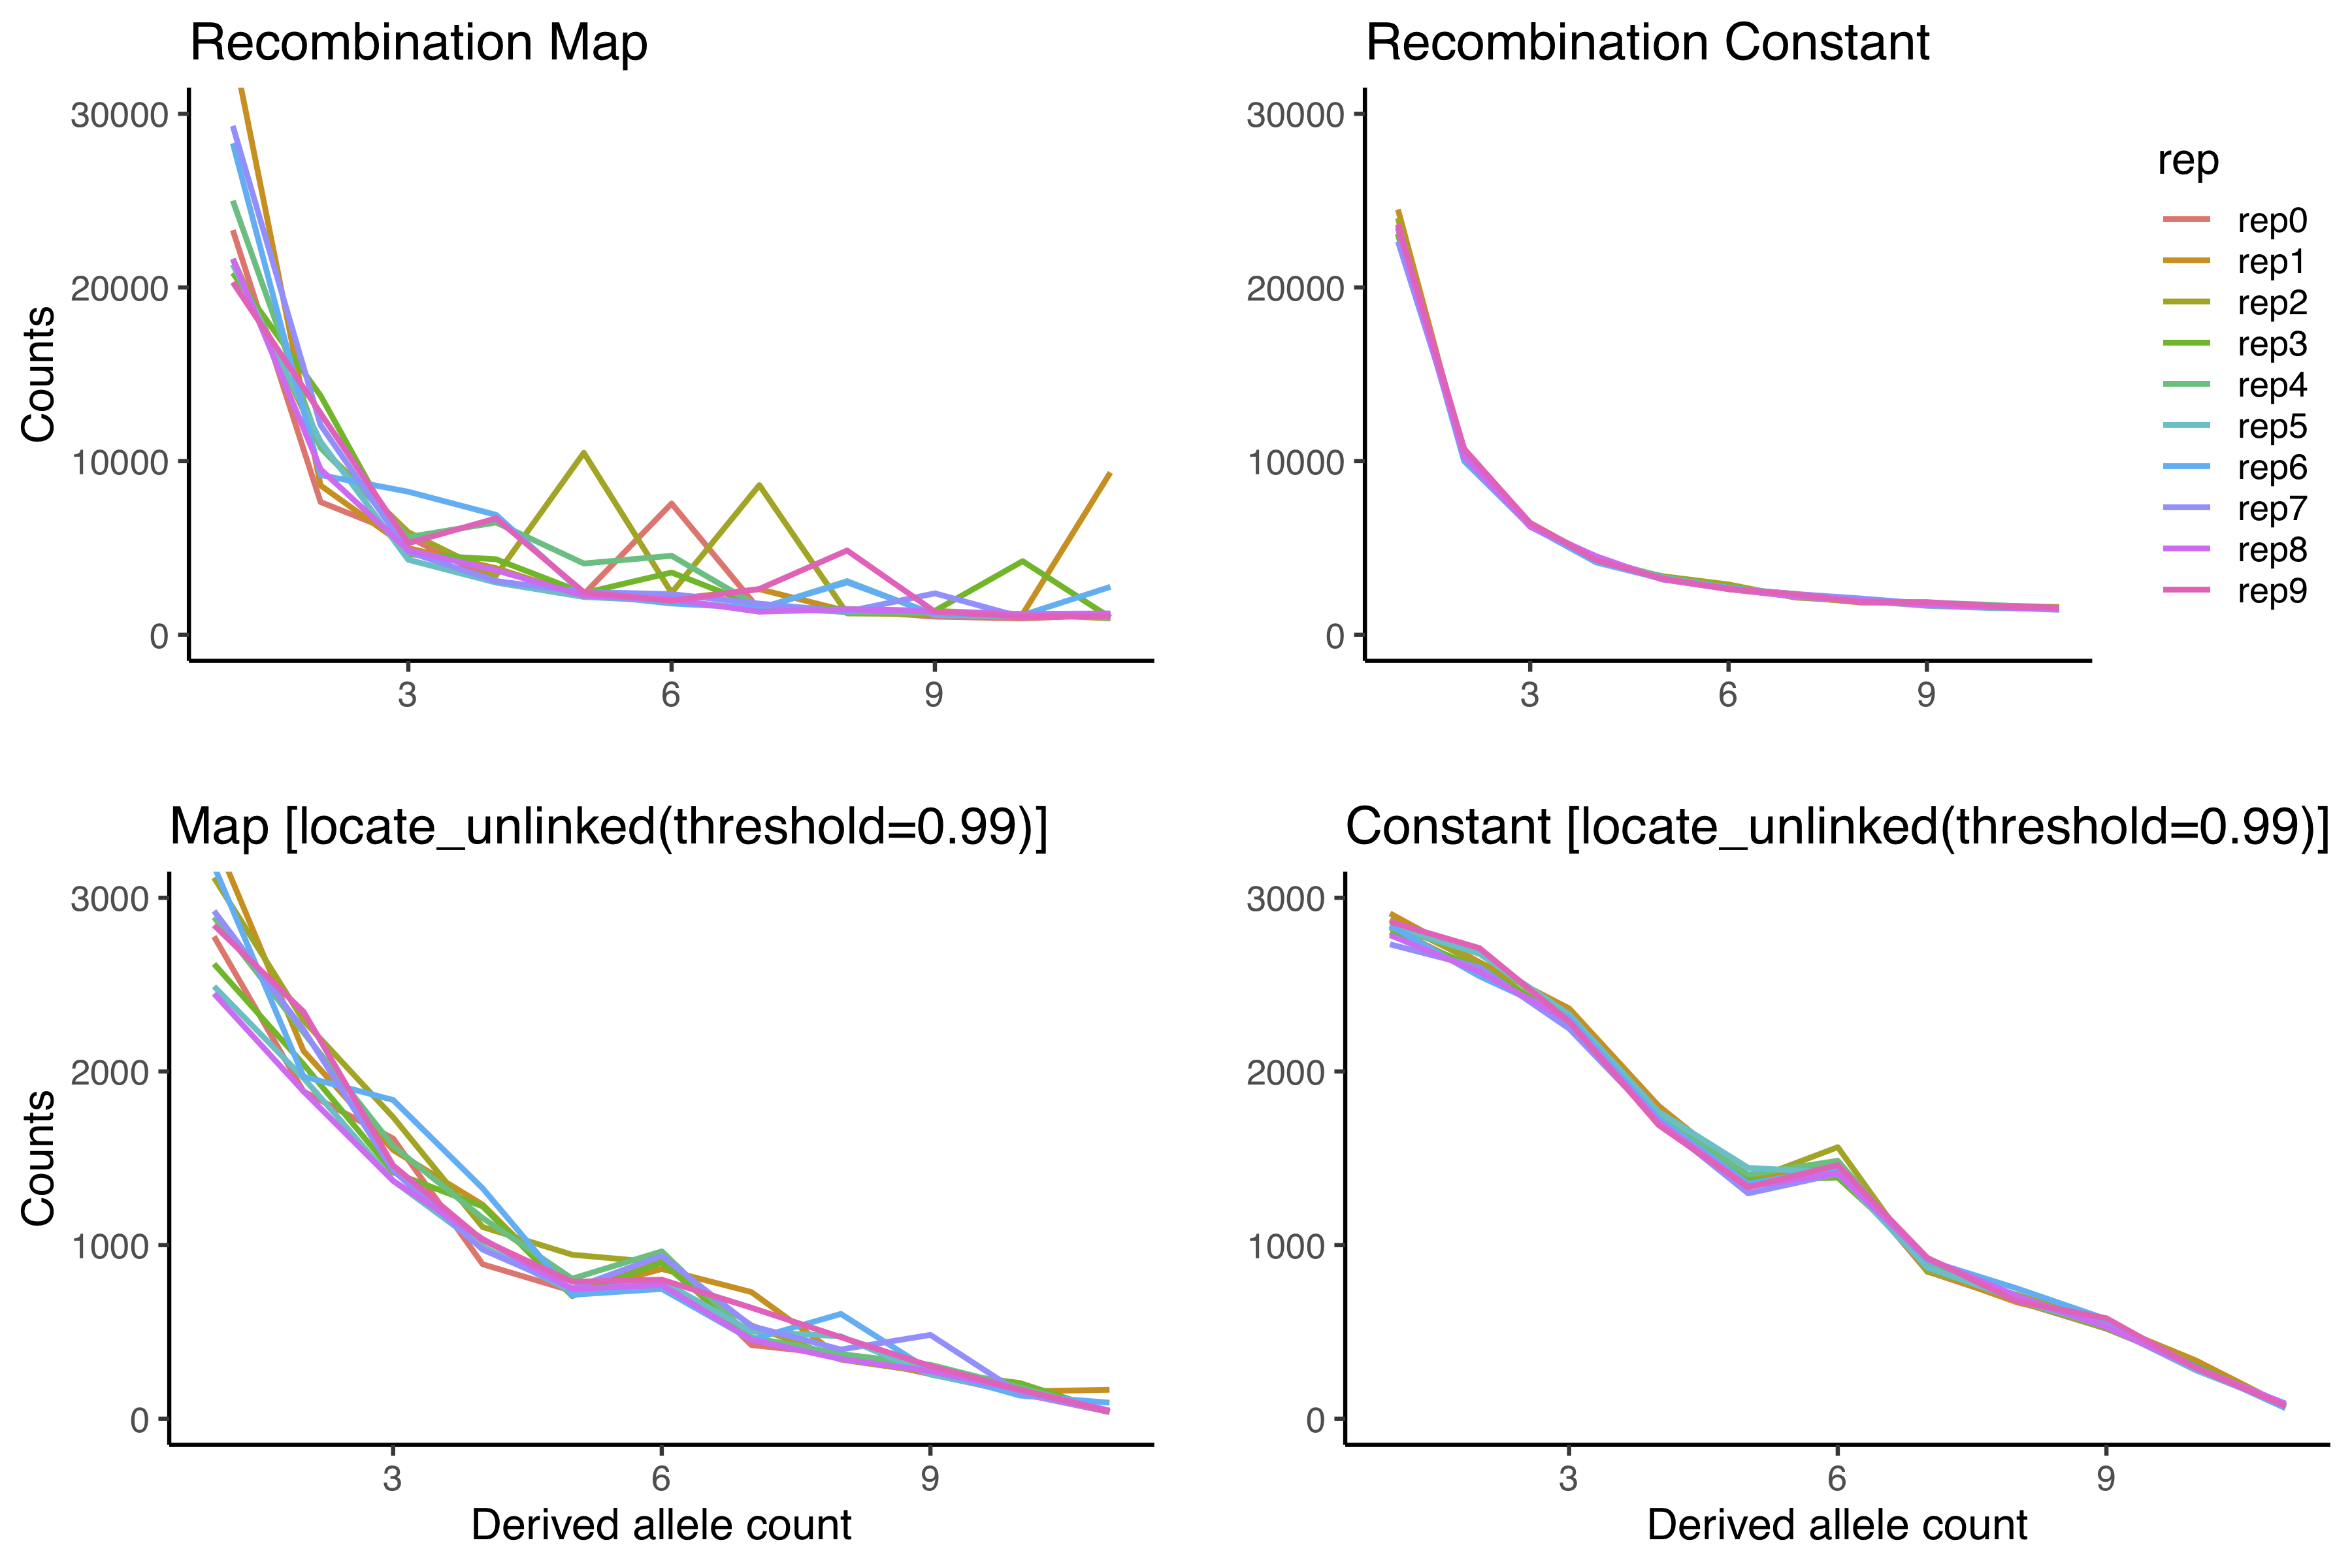
It certainly looks like locate_unlinked is not doing what we want here. I changed the rsq threshold to 0.99, and as you can see nearly 90% of sites are still filtered out and the SFS is very strange.
 jradrion
on 20 Jun 2019
jradrion
on 20 Jun 2019
Wierd.
I changed the rsq threshold to 0.99
Do you meanthreshold = 0.01? That would be more stringent.
 petrelharp
on 21 Jun 2019
petrelharp
on 21 Jun 2019
i think we are going to have to write our own function here
andrewkern
on 21 Jun 2019
Will the LDCalculator in tskit be of any use here?
 jeromekelleher
on 21 Jun 2019
jeromekelleher
on 21 Jun 2019
@petrelharp
No, i used threshold = 0.99. My understanding of locate_unlinked is that this should retain all sites with rsq < 0.99, so less stringent. So apparently ~90% of sites have rsq >= 0.99?
@jeromekelleher
I will look into the LDCalculator, thanks!
jradrion
on 21 Jun 2019
So apparently ~90% of sites have rsq >= 0.99?
That is worrisome, if true.
LDCalculator
There's some info on this very question in this thread.
petrelharp
on 21 Jun 2019
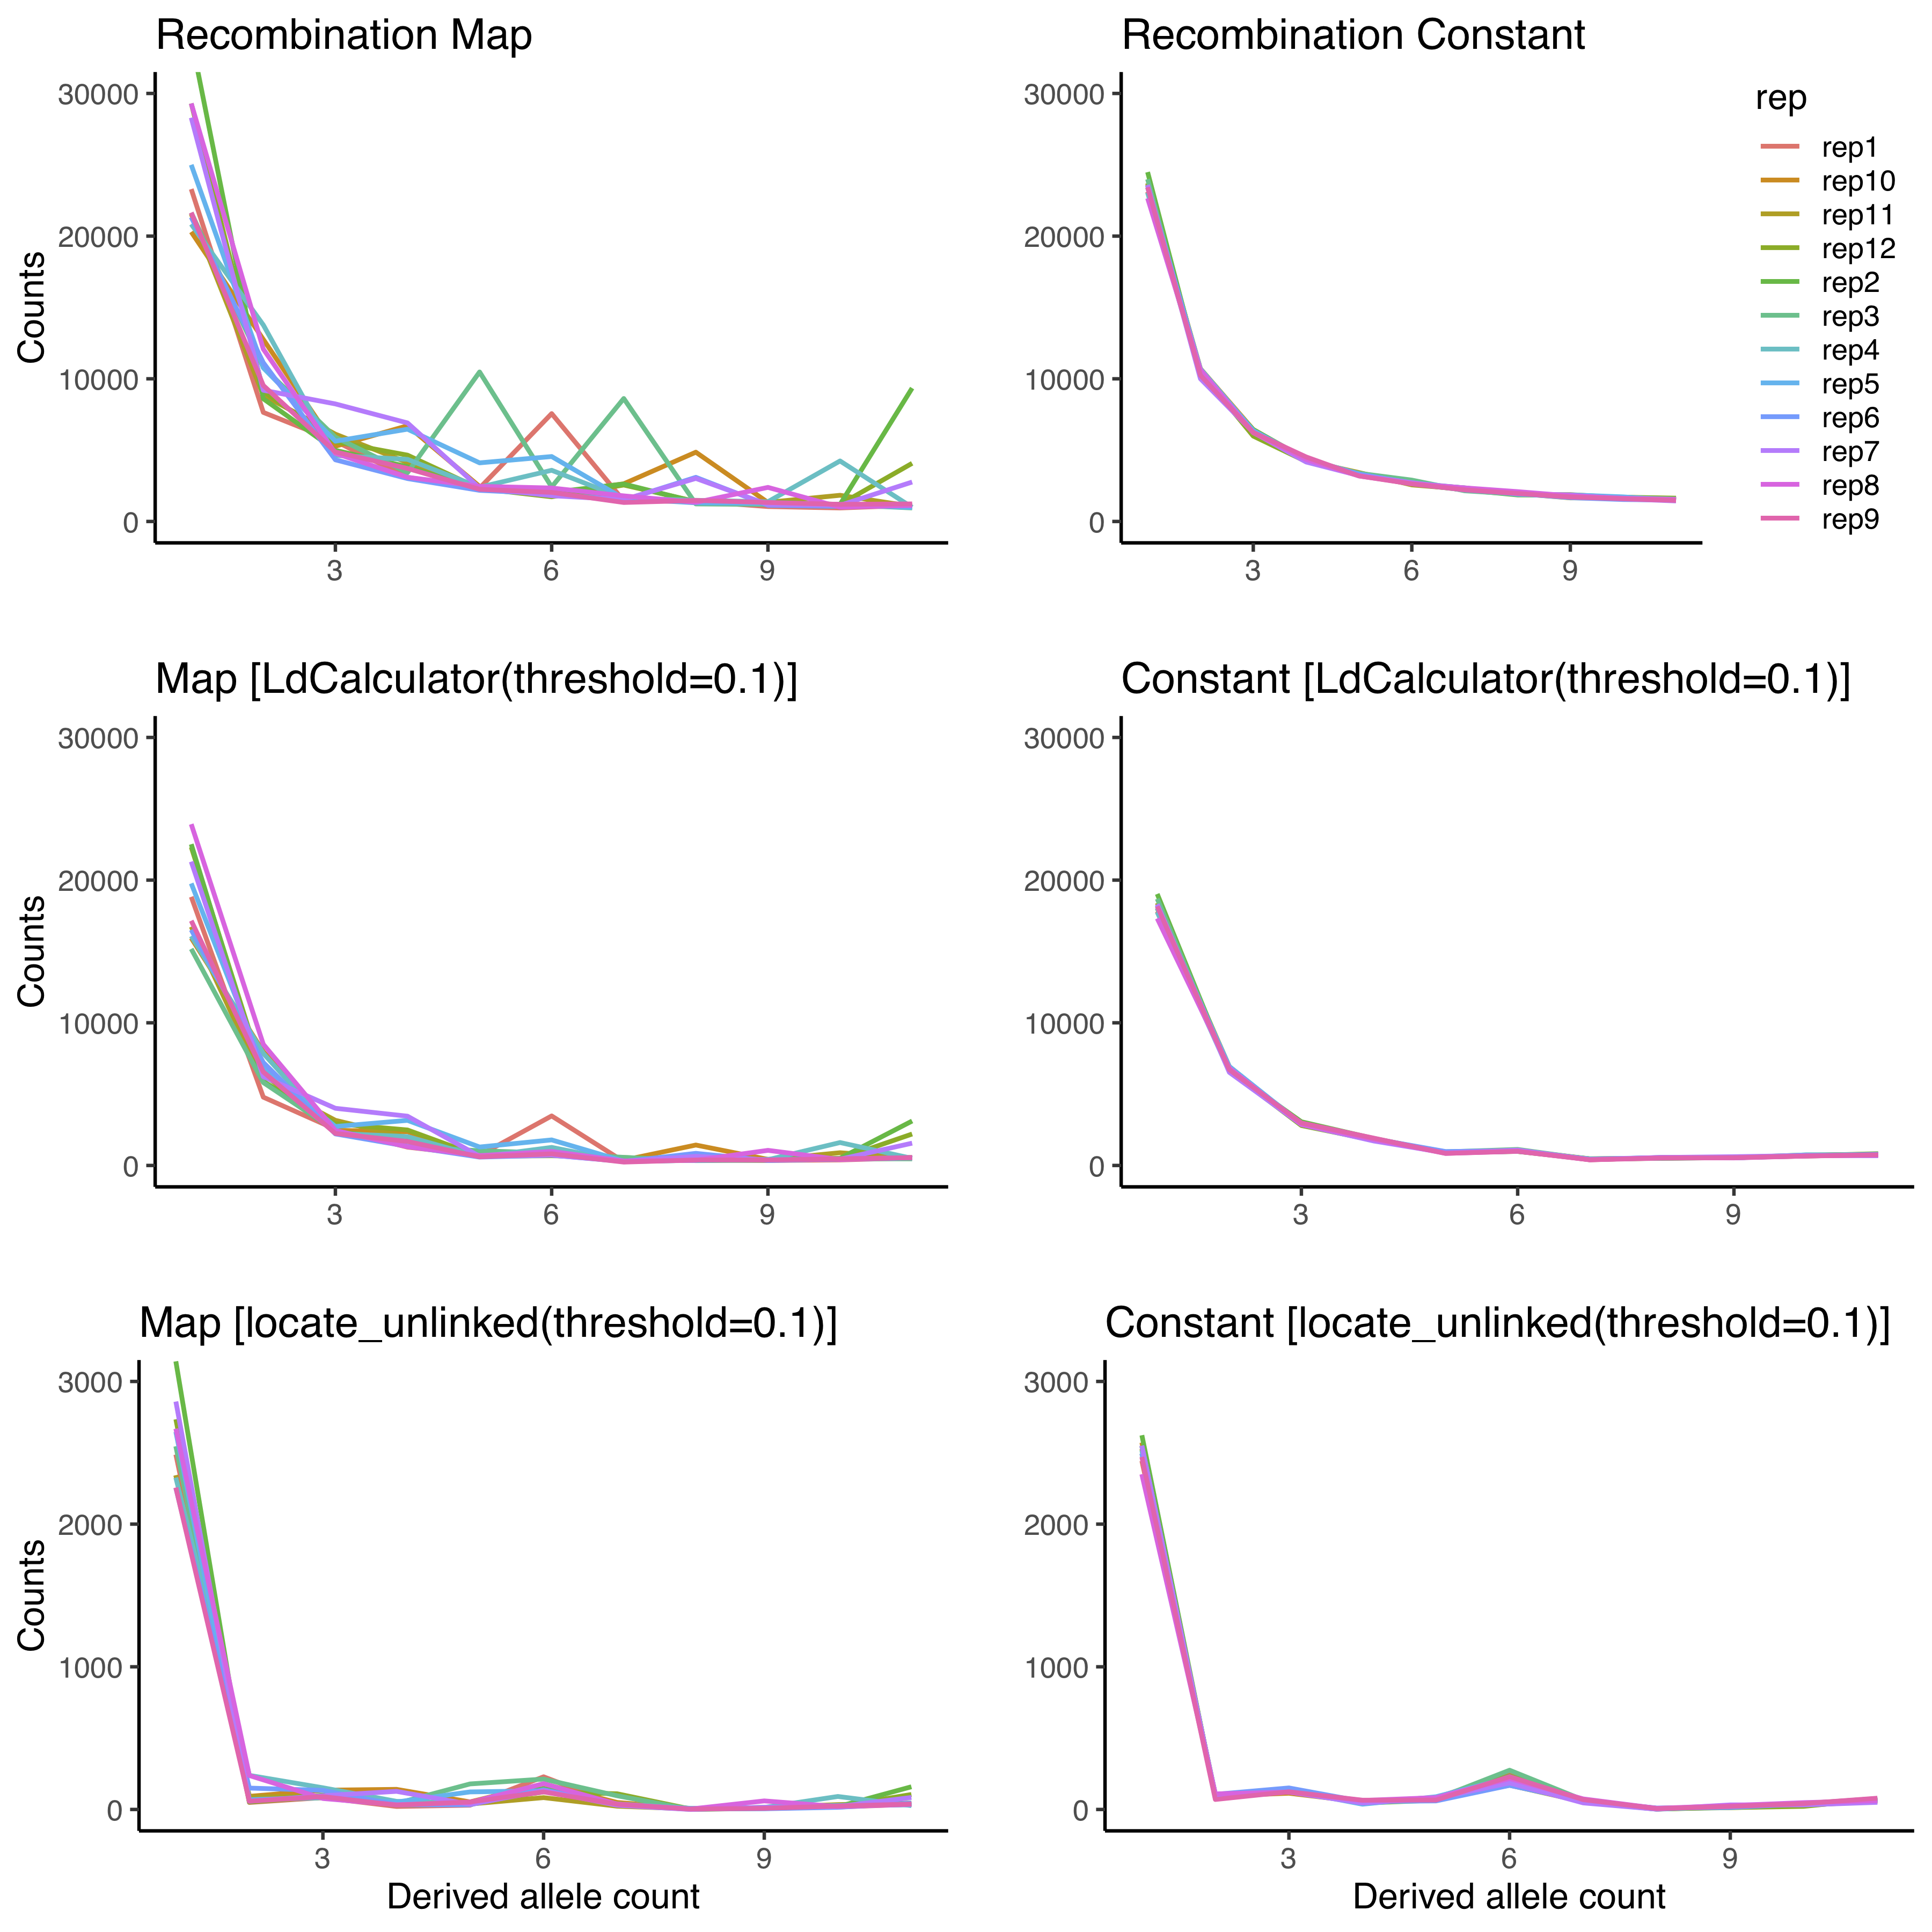
Here are the differences in LD pruning using the locate_unlinked function implemented in scikit-allel and the LdCalculator function in msprime
jradrion
on 9 Jul 2019
Following up on this from the call, I think it would be good to try:
- Run a simulation with a single population & no structure with a genetic map; do we get spikiness?
- If we do, run the same model/recombination map in SLiM. Do we get spikiness? If yes, it's likely a real effect; if no, looks like a bug in msprime.
- If not, try to track down the minimum structure that we'd need to reproduce it (do we need two populations?). If it's simple enough to implement in SLiM, try the same logic as 2.
jeromekelleher
on 9 Jul 2019
I think this issue was resolved, right? IIRC, it came down to large sections of the genome with no recombination was the problem, which we resolve by masking these out of analyses.
jeromekelleher
on 28 Sep 2019
Related issues
jeromekelleher
·
5Comments
jeromekelleher
·
5Comments
jeromekelleher
·
4Comments
 gtsambos
·
4Comments
jeromekelleher
·
5Comments
gtsambos
·
4Comments
jeromekelleher
·
5Comments