Stars: Weird behaviour running the first vignette
Dear all, this is the first time that I use the package stars and I think I found a weird error running the code in the first vignette. The following example should exhibit the problem:
# packages
library(stars)
#> Loading required package: abind
#> Loading required package: sf
#> Linking to GEOS 3.8.0, GDAL 3.0.4, PROJ 6.3.1
library(tidyverse)

x = c(
  "avhrr-only-v2.19810901.nc",
  "avhrr-only-v2.19810902.nc"
)

file_list = system.file(paste0("netcdf/", x), package = "starsdata")
y = read_stars(file_list, quiet = TRUE)
#> Warning in CPL_read_gdal(as.character(x), as.character(options),
#> as.character(driver), : GDAL Message 1: Recode from UTF-8 to CP_ACP failed with
#> the error: "Invalid argument".

#> several other warnings with the same message

z = y %>% dplyr::select(sst) %>% adrop()

ggplot() +
  geom_stars(data = z[1], alpha = 0.8, downsample = c(10, 10, 1)) +
  facet_wrap("time")
#> Error: `scale_id` must not be `NA`
Created on 2020-07-25 by the reprex package (v0.3.0)
The weird part is that if I load only ggplot2 then it works (as in the vignette):
# packages
library(stars)
#> Loading required package: abind
#> Loading required package: sf
#> Linking to GEOS 3.8.0, GDAL 3.0.4, PROJ 6.3.1
library(ggplot2)

x = c(
  "avhrr-only-v2.19810901.nc",
  "avhrr-only-v2.19810902.nc"
)

file_list = system.file(paste0("netcdf/", x), package = "starsdata")
y = read_stars(file_list, quiet = TRUE)
#> Warning in CPL_read_gdal(as.character(x), as.character(options),
#> as.character(driver), : GDAL Message 1: Recode from UTF-8 to CP_ACP failed with
#> the error: "Invalid argument".

#> several other warnings with the same message

z = y %>% dplyr::select(sst) %>% adrop()

ggplot() +
  geom_stars(data = z[1], alpha = 0.8, downsample = c(10, 10, 1)) +
  facet_wrap("time")

Created on 2020-07-25 by the reprex package (v0.3.0)
 agila5
All 8 comments
I'm running into this as well, but in a fairly different context. I'm still working on confirming, but I think it might have something to do with the date format, though I don't see why loading all of tidyverse vs just ggplot would change the behavior. I have a stars raster cube that I've aggregated with polygons, and then st_to_sf, and then made long for plotting with geom_sf. If the dates are in character format (as they tend to be after that set of operations), I can facet_wrap(~Date). But if I change the dates to posixct, I get Error: `scale_id` must not be `NA. I'll try to recreate the issue with datasets in starsdata so it's reproducible and update.
 galenholt
on 30 Jul 2020
galenholt
on 30 Jul 2020
Yep, confirming the "'scale_id' must not be 'NA'" error for both the vignette data and my own.
this happens regardless of if I only load ggplot2 + stars or with other packages.
The issue appears to be when the ggplot2:::scale_apply function is called, I see that ggplot2 made a change to this in January, but perhaps that has broken something.
I'll test with an older version of ggplot2
R version 3.6.1 (2019-07-05)
Platform: x86_64-w64-mingw32/x64 (64-bit)
Running under: Windows 10 x64 (build 18362)

Matrix products: default

locale:
[1] LC_COLLATE=English_United Kingdom.1252  LC_CTYPE=English_United Kingdom.1252    LC_MONETARY=English_United Kingdom.1252 LC_NUMERIC=C
[5] LC_TIME=English_United Kingdom.1252

attached base packages:
[1] stats     graphics  grDevices utils     datasets  methods   base

other attached packages:
[1] ggplot2_3.3.2 stars_0.4-3   sf_0.9-5      abind_1.4-5

loaded via a namespace (and not attached):
 [1] Rcpp_1.0.5         rstudioapi_0.11    magrittr_1.5       units_0.6-7        munsell_0.5.0      tidyselect_1.1.0   colorspace_1.4-1   R6_2.4.1
 [9] rlang_0.4.7        dplyr_1.0.0        tools_3.6.1        parallel_3.6.1     grid_3.6.1         packrat_0.5.0      gtable_0.3.0       KernSmooth_2.23-15
[17] e1071_1.7-3        DBI_1.1.0          withr_2.2.0        ellipsis_0.3.1     class_7.3-15       lwgeom_0.2-5       tibble_3.0.3       lifecycle_0.2.0
[25] crayon_1.3.4       purrr_0.3.4        vctrs_0.3.2        glue_1.4.1         compiler_3.6.1     pillar_1.4.6       scales_1.1.1       generics_0.0.2
[33] classInt_0.4-3     pkgconfig_2.0.3
 tomhull
on 30 Jul 2020
tomhull
on 30 Jul 2020
Yep, I've confirmed the vignette works fine with ggplot2 v 3.1.1.
tomhull
on 30 Jul 2020
I've managed to recreate the issues that gave me the same ggplot facetting errors with vector stars objects, using the example at [https://r-spatial.github.io/stars/]. In this case, ggplot seems to be able to facet if the dates are characters, but not posixct. Hope this provides some more helpful information to chase it down. Though @tomhull 's finding might mean it will require either downgrading ggplot or waiting for an update.
# a few modifications to the data raster and vector time series example at
# https://r-spatial.github.io/stars/ to illustrate some ggplot errors

library(stars)
#> Warning: package 'stars' was built under R version 3.6.3
#> Loading required package: abind
#> Loading required package: sf
#> Warning: package 'sf' was built under R version 3.6.3
#> Linking to GEOS 3.8.0, GDAL 3.0.4, PROJ 6.3.1
library(tidyverse)
#> Warning: package 'tidyverse' was built under R version 3.6.3
#> Warning: package 'ggplot2' was built under R version 3.6.3
#> Warning: package 'tibble' was built under R version 3.6.3
#> Warning: package 'tidyr' was built under R version 3.6.3
#> Warning: package 'purrr' was built under R version 3.6.3
#> Warning: package 'dplyr' was built under R version 3.6.3
#> Warning: package 'forcats' was built under R version 3.6.3


# Get the rasters: these look similar to what my data has
prec_file = system.file("nc/test_stageiv_xyt.nc", package = "stars")
(prec = read_ncdf(prec_file, curvilinear = c("lon", "lat"), ignore_bounds = TRUE))
#> no 'var' specified, using Total_precipitation_surface_1_Hour_Accumulation
#> other available variables:
#>  time_bounds, lon, lat, time
#> No projection information found in nc file.
#>  Coordinate variable units found to be degrees,
#>  assuming WGS84 Lat/Lon.
#> stars object with 3 dimensions and 1 attribute
#> attribute(s):
#>  Total_precipitation_surface_1_Hour_Accumulation [kg/m^2]
#>  Min.   :  0.000
#>  1st Qu.:  0.000
#>  Median :  0.750
#>  Mean   :  4.143
#>  3rd Qu.:  4.630
#>  Max.   :163.750
#> dimension(s):
#>      from  to                  offset   delta  refsys point
#> x       1  87                      NA      NA  WGS 84    NA
#> y       1 118                      NA      NA  WGS 84    NA
#> time    1  23 2018-09-13 18:30:00 UTC 1 hours POSIXct    NA
#>                              values
#> x    [87x118] -80.6113,...,-74.8822 [x]
#> y      [87x118] 32.4413,...,37.6193 [y]
#> time                           NULL
#> curvilinear grid

# Get north carolina
sf::read_sf(system.file("gpkg/nc.gpkg", package = "sf"), "nc.gpkg") %>%
  st_transform(st_crs(prec)) -> nc # transform from NAD27 to WGS84
nc_outline = st_union(st_geometry(nc))
plot_hook = function() plot(nc_outline, border = 'red', add = TRUE)
prec %>%
  slice(index = 1:12, along = "time") %>%
  plot(downsample = c(5, 5, 1), hook = plot_hook)

# Do the aggregate
a = aggregate(prec, by = nc, FUN = max)
#> although coordinates are longitude/latitude, st_intersects assumes that they are planar
#> although coordinates are longitude/latitude, st_intersects assumes that they are planar
# although coordinates are longitude/latitude, st_intersects assumes that they are planar
# although coordinates are longitude/latitude, st_intersects assumes that they are planar
plot(a, max.plot = 23, border = 'grey', lwd = .5)

# # so far so good (and have changed nothing)


# Now, some ggplot facetting errors -------------------------------------------------

# Plot the above with geom_stars in ggplot
# Gives Error: `scale_id` must not be `NA`
ggplot() +
  geom_stars(data = a,
             aes(fill = Total_precipitation_surface_1_Hour_Accumulation)) +
  facet_wrap(~time)
#> Error: `scale_id` must not be `NA`

# But making time a character works
ggplot() +
  geom_stars(data = a,
             aes(fill = Total_precipitation_surface_1_Hour_Accumulation)) +
  facet_wrap(~as.character(time))

# Make an sf, and plot that in ggplot
asf <- st_as_sf(a)

# Works with base plot()
plot(asf)
#> Warning: plotting the first 10 out of 23 attributes; use max.plot = 23 to plot
#> all

# To facet with ggplot, need to stack all those columns
stackA <- tidyr::pivot_longer(asf,
                              cols = -geom, names_to = 'Time', values_to = 'precip') %>%
  dplyr::mutate(Time2 = lubridate::ymd_hms(Time))
#> Warning in val_cols[col_id] <- unname(as.list(data[cols])): number of items to
#> replace is not a multiple of replacement length
# Gives a warning about number of items not multiple of replacement, which seems odd.

# This works: Time is a character
ggplot() +
  geom_sf(data = stackA,
             aes(fill = precip, geometry = geom)) +
  facet_wrap(~Time)

# This fails, Time2 is POSIXct
ggplot() +
  geom_sf(data = stackA,
          aes(fill = precip, geometry = geom)) +
  facet_wrap(~Time2)
#> Error: `scale_id` must not be `NA`

Created on 2020-07-31 by the reprex package (v0.3.0)
galenholt
on 31 Jul 2020
Has one of you succeeded in getting facet_wrap to break on POSIXct columns without geom_sf? (I haven't)
 edzer
on 31 Jul 2020
edzer
on 31 Jul 2020
Hmm. good question. I can't with with objects that have once been stars, even when using none of the geographic information. But it doesn't seem to be an inherent issue with POSIXct either, because I can get it to work if I just tack a posix column onto iris.
To continue my example above, using geom_histogram also fails to facet,
# This fails
ggplot(stackA) +
  geom_histogram(aes(x = precip)) + facet_wrap(~Time2)
But in a super simple example with no geographic information in the dataframe, I can facet on a POSIXct column
iris %>% mutate(date = rep_along(Petal.Length, c('2020-09-08', '2020-08-09')),
                date2 = as.POSIXct(date, origin = '1970-01-01')) %>%
  ggplot(aes(x = Petal.Length, y = Sepal.Length)) + geom_point() + facet_wrap(~date2)
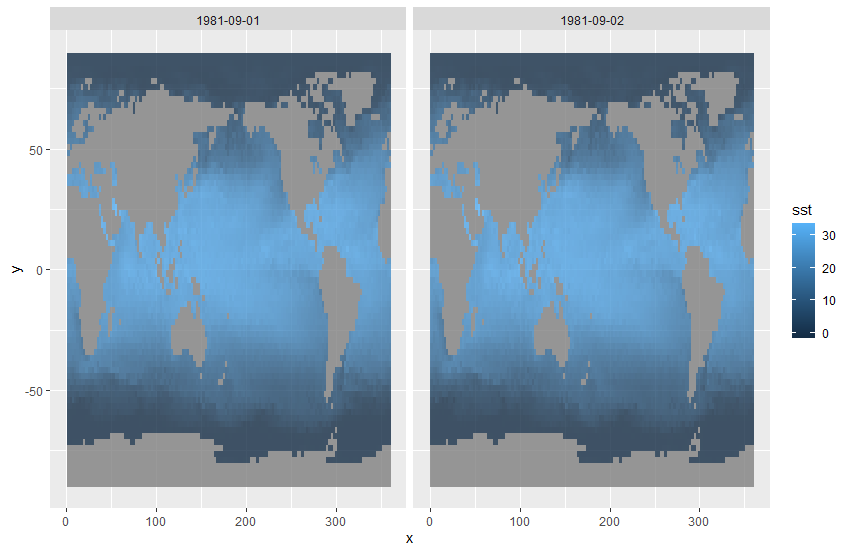
This issue still seems to persist as of ggplot2 version 3.3.3.9000. I get "Error: scale_id must not be NA" if I load tidyverse ahead of ggplot2 for the vignette code. As @galenholt showed, coercing time as a character in the call to facet_wrap appears to work as a temporary and relatively easy workaround for now. Fixing this seems to be on the to do list for ggplot2 version 3.4.0 though.
# packages
library(stars)
library(tidyverse)

x = c(
  "avhrr-only-v2.19810901.nc",
  "avhrr-only-v2.19810902.nc"
)

file_list = system.file(paste0("netcdf/", x), package = "starsdata")
y = read_stars(file_list, quiet = TRUE)

z = y %>% dplyr::select(sst) %>% adrop()

ggplot() +
  geom_stars(data = z[1], alpha = 0.8, downsample = c(10, 10, 1)) +
  facet_wrap(~as.character(time))
 ailich
on 27 Mar 2021
ailich
on 27 Mar 2021
Thanks for letting us know - that gives hope!
edzer
on 27 Mar 2021
Related issues
 michaeldorman
·
4Comments
edzer
·
12Comments
michaeldorman
·
4Comments
edzer
·
12Comments
 kendonB
·
6Comments
michaeldorman
·
7Comments
kendonB
·
6Comments
michaeldorman
·
7Comments
 adrfantini
·
10Comments
adrfantini
·
10Comments