Stars: Add contours with labels on 'stars' plot without using 'raster'?
I'm trying to draw contour lines with labels, using the base function contour, on top of a stars plot.
The following reproducible example works fine:
# Create 'stars' object
library(stars)
library(raster)
d = st_dimensions(x = 1:ncol(volcano), y = 1:nrow(volcano))
r = st_as_stars(t(volcano))
r = st_set_dimensions(r, 1, offset = 0, delta = 1)
r = st_set_dimensions(r, 2, offset = 0, delta = -1)

# Plot 'stars' with contour?
plot(r, reset = FALSE)
contour(as(r, "Raster"), add = TRUE)
and gives the expected output:
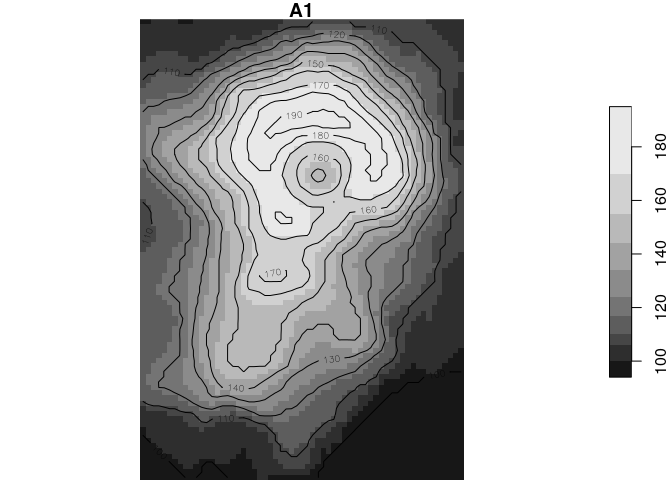
However, for the contour function to work the stars object needs to be converted to a Raster* object, and the raster package needs to be loaded.
I couldn't find a way to use contour directly on stars objects, and therefore was wondering - is there is a "native" way of applying contour on stars object, without requiring the raster package?
Thanks!
 michaeldorman
All 5 comments
Have you tried using st_contour? Requires GDAL >= 2.4.0 and a recent stars version.
 adrfantini
on 28 Jul 2019
adrfantini
on 28 Jul 2019
Thanks!
Sure, st_contour works in case I need just the contour lines:
# Plot 'stars' with st_contour
plot(r, reset = FALSE)
v = st_contour(r)
v = st_geometry(v)
plot(v, add = TRUE)
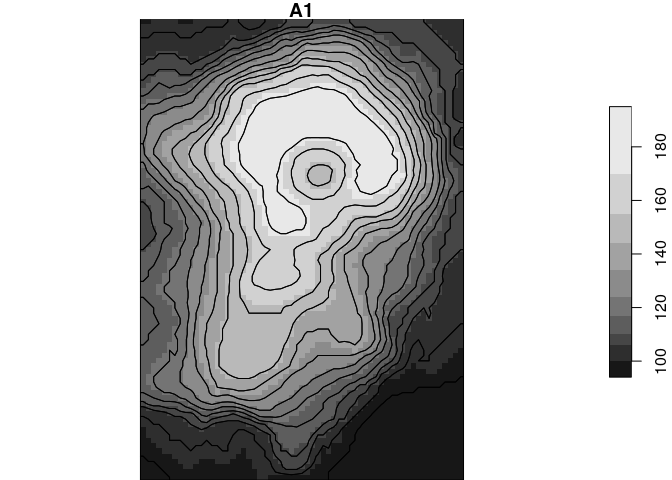
but I also wanted to have labels, and have them rotated and placed on top of the contour lines, with line gaps so that the labels are visible. As far as I know, contour is the only function which can do all of that automatically...
michaeldorman
on 28 Jul 2019
Ah, indeed, you are correct.
adrfantini
on 28 Jul 2019
Thanks; contour(r, add = TRUE) should now work.
 edzer
on 10 Aug 2019
edzer
on 10 Aug 2019
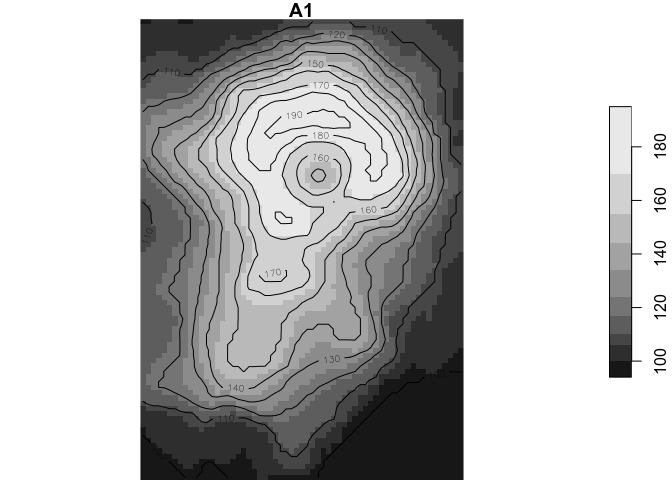
Great, it works now! Thank you very much.
# Create 'stars' object
library(stars)
d = st_dimensions(x = 1:ncol(volcano), y = 1:nrow(volcano))
r = st_as_stars(t(volcano))
r = st_set_dimensions(r, 1, offset = 0, delta = 1)
r = st_set_dimensions(r, 2, offset = 0, delta = -1)

# Plot 'stars' with contour!
plot(r, reset = FALSE)
contour(r, add = TRUE)
michaeldorman
on 10 Aug 2019
Related issues
adrfantini
·
10Comments
edzer
·
12Comments
 dblodgett-usgs
·
13Comments
dblodgett-usgs
·
13Comments
 noamross
·
10Comments
adrfantini
·
10Comments
noamross
·
10Comments
adrfantini
·
10Comments
Most helpful comment
Ah, indeed, you are correct.