OS Host: Windows 10 64 bits
SRT version: latest git (f5f52c02c27d7a8d7050a746eebee6e3d1b33aaa)
Program: srt-live-transmit.exe (32 bits compile)
Commandline used:
srt-live-transmit "srt://wowza_server....." udp://127.0.0.1:1234 -s:10
It starts using about 0.2% of CPU load. After some hours (8 or even more), it jumps to about 70% of CPU load. However memory usage keeps stable at 2 MB.
How can I capture the moment when this issue happens ?
I have my toolchain ready for anything you want me to compile.
Regards
 vidanio
All 48 comments
Same here
OS Host: Windows 10 64 bits
SRT version: 1.3.2 (commit c05ca7d7)
Program: srt-live-transmit.exe (appveyor compile)
 manueldev
on 30 Apr 2019
manueldev
on 30 Apr 2019
Could you please check with the 1.3.2 release version (tag v1.3.2)?
 maxsharabayko
on 30 Apr 2019
maxsharabayko
on 30 Apr 2019
I just started the test with version 1.3.2 that you indicate.
manueldev
on 1 May 2019
Also running here since 2 hours ago.
vidanio
on 1 May 2019
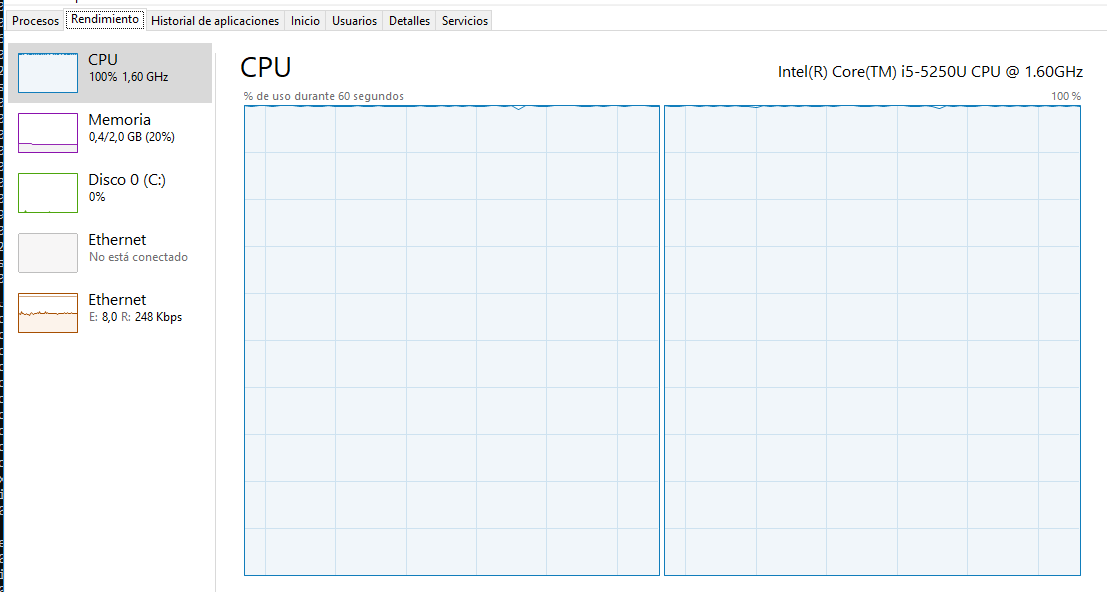
Again

manueldev
on 1 May 2019
Also the same here after 18 hours: 71% CPU usage.
vidanio
on 2 May 2019
For me only on receiver side.
manueldev
on 2 May 2019
Yes me too. As I reported on the commandline used to receive SRT.
vidanio
on 2 May 2019
@manueldev @vidanio What are the features of the source signal? Is it going continuously or are there reconnections happening? Is it only one connection working for several hours, or are there maybe hanging sockets that got disconnected?
If it is always one connection working for 8 hours, and given you both see this issue on Windows, not on Linux, I may assume that can be related to timers, but so far not clear where.
I am thinking of running a profiler over night to collect CPU usage statistics. Given you guys have a setup, can you also run your test under a profiler (Visual Studio Profiler or VTune Amplifier) and check which part of code becomes hot after 8 hours? Meanwhile I will try to reproduce this issue on my side as well.
maxsharabayko
on 2 May 2019
@maxlovic
My source is also UDP to SRT upload using srt-live-transmit.exe. There are no reconnections in the meantime, always running continuously.
Time when happens is not always the same. I experienced it after 8 hours, 18 hours and even 30 hours later.
I will also test it on Linux and get back to you.
vidanio
on 2 May 2019
The connection goes without problems (even when the use of CPU increases). The source is mpegts / opus generated by ffmpeg vía udp at 128kbps (audio only) from Windows 10 64bit (udp to srt using srt-live-transmit.exe).
manueldev
on 2 May 2019
It would be nice if you can collect debug logs for the whole session, although a large disk space may be required. Also grabbing the pcap could be helpful, too.
Due to that, "heisenberg problems" may appear, but it's still worth a try.
We had some struggle last time with high CPU time waste on Windows, but it turned out to be not that big, and decreasing with increased bitrate, so we finally abandoned it. At least we didn't catch a case so far to make it THAT big problem.
 ethouris
on 2 May 2019
ethouris
on 2 May 2019
@ethouris
I agree with you, that this seems not to be very big problem, and very hard to hunt (heisenberg problem). It would take very long debugs logs and also pcap, because it takes even 30 hours to happen (a random time), at least on my side.
What I found is that doesnt blocks the CPU, and if you even run another process, the CPU usage of SRT goes down (about 40%), and everything keeps flowing. So it seems to be more a profiler issue rather than a big issue.
vidanio
on 2 May 2019
Ran a test over night streaming 6 Mbps on a localhost to
srt-live-transmit srt://:4200 udp://127.0.0.1:4900.
The CPU usage has not increased.
Next week will try to stream from another machine and read UDP streaming with another app.
maxsharabayko
on 3 May 2019
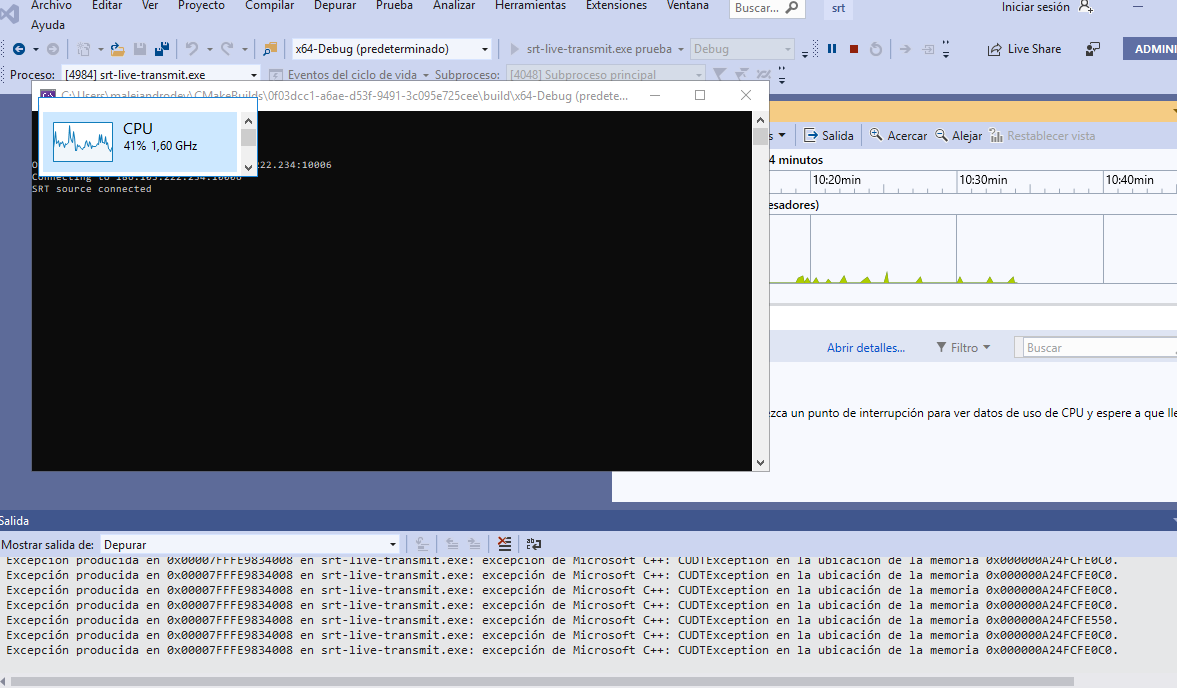
I'm running a test a few minutes ago..
manueldev
on 4 May 2019
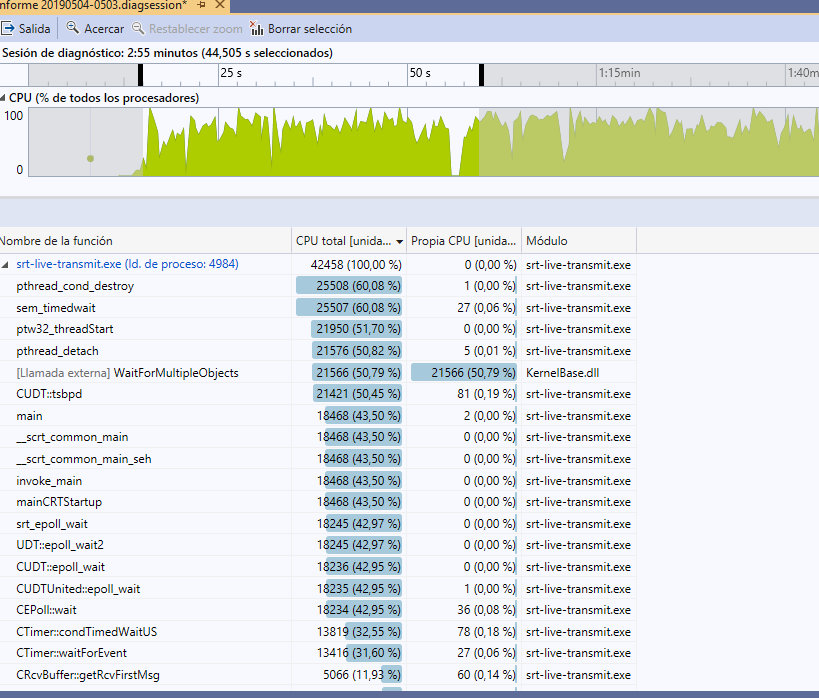
After 3 hours the increase in CPU usage began. I do not have much knowledge to use the diagnostic tool. If you want to see something in special please tell me.
manueldev
on 4 May 2019
@maxlovic
I guess time to wait is higher on quicker CPUs as mine(more than 18 hours). Manueldev faces the issue in just 3 hours because his CPU is 1.6 GHz.
vidanio
on 8 May 2019
@manueldev Sorry, missed your results. Do you still have that profiler report? It seems to be like WaitForMultipleObjects is the the one that start to impact CPU time.
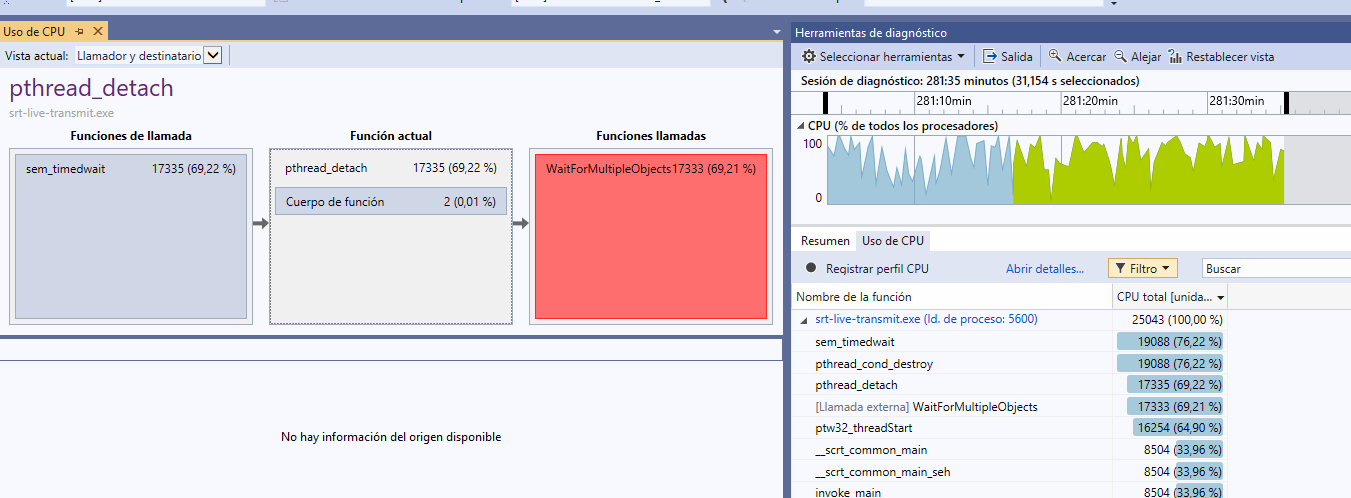
Can you please check who calls it from SRT code? In your screenshot I see up to sem_timedwait. If you click on it, you will see where it was called from.
Which version of pthreads library are you using?
maxsharabayko
on 8 May 2019
@maxlovic this?
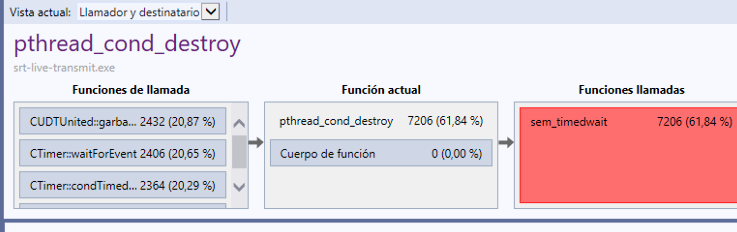
manueldev
on 8 May 2019
@manueldev Yes, that was it. And that is interesting.
Could you please share you performance report together with the whole project and build artifacts? I will try to see the behavior in dynamics. Is it interesting to select a time interval in the beginning and compare it to the state in the end.
maxsharabayko
on 9 May 2019
Hi there,
I came across SRT about a month ago and have been extremely excited about the possibilities it offers... So thanks for this project! First off, I apologize my C++ skill is extremely beginner, and this is a very complex program, but I wanted to try to help find the cause of the high CPU I am seeing.
As mentioned, I am seeing a high CPU issue with srt-live-transmit.exe on Windows 10 x64 that I compiled earlier this month using the 1.3.2 library. It is not consistently happening, but occurs somewhat semi-frequently for me.
For my usage needs & wishing to keep things simple I setup my environment to run the srt-live-transmit.exe 3 times, one process for each stream I am sending, each process inputting from a distinct UDP port and relaying out to a another distinct port on the receiving end...
On the sending side (which is the side where I see high CPU issues), I am pulling in a unicast MPEG-TS stream from ffmpeg, and sending to an SRT receiver over a WAN (although I found out this CPU issue occurs without a connection to a receiver). Sometimes it will run fine for a few hours/days, sometimes I suddenly start to see all 3 processes begin to creep up in CPU usage gradually in unison until they are all hitting their max. I can kill the process and relaunch it, and it begins to do the same thing again after about 30-45 seconds. I've noticed rebooting Windows tends to make the problem go away for a long time, then I'll see it again after a day or two.
Despite my C++ still being very limited, I decided I would try to maybe find out when this high CPU happens and when it doesn't. I started commenting out portions of the srt-live-transmit.cpp code and eventually reaching what I think is a likely contributor - the srt_epoll_wait() function inside the main while loop for srt-live-transmit.cpp. I commented out this block and replaced with a 100ms sleep, and I never saw the high CPU again. Obviously my changes break the functionality of the program, I am just doing this with hopes to point the finger at this srt_epoll_wait() which seems to be contributing to high CPU usage sometimes. I feel like there is something system-wide dealing with timers that makes this happen for all the instances of srt-live-transmit.exe at the same time.
Any thoughts are appreciated, thank you.
 lbgaus
on 30 Jun 2019
lbgaus
on 30 Jun 2019
Not interesting ...
vidanio
on 30 Jun 2019
@vidanio Why did you close the issue? Still looks like something to investigate.
maxsharabayko
on 1 Jul 2019
Please reopen... I'm not sure what "not interesting" refers to but this was closed rather inexplicably. I'm going to keep investigating the issue on my own but surely someone here knows the programming better than I do. Let me know if I can answer any questions or troubleshoot anything else. Thanks.
lbgaus
on 1 Jul 2019
done
vidanio
on 1 Jul 2019
@lbgaus
Thanks for doing the research. Might be also worth checking built with pthreads4w library.
Another clue is that this seems to start happening when the system is up fo some time. Might be related to timers in that case.
I've noticed rebooting Windows tends to make the problem go away for a long time, then I'll see it again after a day or two.
Another idea might be that the epoll_wait loop is working too fast, without doing any useful work inside. This might be happening in case tar->Write fails. Adding a log message there might be a good thing to do.
maxsharabayko
on 1 Jul 2019
Thank you all for the excellent descriptions. I believe I have isolated this defect and can explain why it is happening. I will share a workaround that may resolve the issue until an official fix is made.
System: Windows 10 Enterprise version 1703 64-bit running on Intel Core I7-6820HQ CPU @ 2.70 GHz
SRT version 2e6037e
pthread-win32 version 19fd505
Built with Visual Studio 15.9.7 (vc++14.14)
Steps to reproduce the problem:
- Start srt-live-transmit.exe as listener
srt-live-transmit.exe srt://:4000 file://con > null - Observe virtually zero cpu usage
- Wait 20-60 minutes (system dependent)
- Observe cpu utilization jump to 20%, consistent with maximum cycles on 1-2 threads on my 4 core (8 thread) system
Isolation and explanation:
- srt-live-transmit.cpp calls srt_epoll_wait() with 100 ms timeout. There is no activity on listening port 4000, so this call is expected to return in 100 ms with error status SRT_ETIMEOUT
- the function call reaches CEPoll::wait() in epoll.cpp in the SRT protocol stack. This function includes a while(true) loop that polls SRTSOCKETs and SYSSOCKETs every 10 ms, so should do 10 iterations before throwing CUDTException(MJ_AGAIN, MN_XMTIMEOUT, 0) which is the same as SRT_ETIMEOUT.
- the 10 ms delay per iteration is accomplished with a call to CTimer::waitForEvent(). This function uses pthread_cond_timedwait() which unfortunately takes absolute time as its timeout argument. CTimer::waitForEvent() calls SRTCompat_gettimeofday() in win_time.cpp to obtain the current time and adds 10 ms to result in the target time for the call to pthread_cond_timedwait().
- the problem is in SRTCompat_gettimeofday(). On first call, it gets the time from windows CRT function ftime() in timeb.h which has millisecond accuracy. This first call to SRTCompat_gettimeofday() is used to establish a baseline "epoch". Then subsequent calls to SRTCompat_gettimeofday() use QueryPerformanceCounter() and QueryPerformanceFrequency() to compute a higher precision absolute time by adding the counter increment to the baseline "epoch" time.
- see Acquiring high-resolution time stamps second paragraph: "QPC is independent of and isn't synchronized to any external time reference." What happens over time is that the target time computed in SRTCompat_gettimeofday(), supposed to be 10 ms in the future, falls behind. Eventually, the call to pthread_cond_timedwait() is made with a target absolute timeout time that is in the past compared to whatever time is used in pthread-win32, probably ftime(). The number of iterations in each call to CEPoll::wait() to get to the 100 ms delay gradually increases from about 10 to 20,000 on my system, because CTimer::waitForEvent() has delay that decreases from 10 ms to eventually 0. The spin loop in CEPoll::wait() accounts for the high cpu utilization.
Possible Workaround:
In SRTCompat_gettimeofday() in win_time.cpp change if (isFirstCall) to if (true). This causes ftime() to be used every time to get the current time from the system. This workaround may not work well on older systems if the resolution of ftime() is coarser than 10 ms.
Fix:
Need to change SRTCompat_gettimeofday() so that it doesn't try to compute absolute time using QueryFrequencyCounter().
 ormike
on 3 Jul 2019
ormike
on 3 Jul 2019
@ormike That totally explains the observed behavior. My "thank you" to all for putting effort on this.
maxsharabayko
on 3 Jul 2019
I had already started the Visual Studio performance profiler on the program waiting for the CPU to hit the ceiling when @ormike chimed in with his findings... I was very intrigued and felt very confident in this explanation given that I had already convinced myself it was some kind of timing issue...
@ormike That is some top-notch investigating and writing up the description of why this is happening. I have applied the workaround and recompiled - going to give it a few days just to make sure the high CPU does not return but your findings look very probable as the root cause. Thank you... a ton.
@maxlovic Thanks as well, I appreciate the guidance you gave. This program is rather complex in its implementation and I'm used to dealing with C# mostly so I appreciate the help in getting my feet a little wetter in this world.
lbgaus
on 4 Jul 2019
The workaround suggested in my previous comment is too blunt. It affects the CTimer::getTime() function which really does need the high resolution provided by QueryPerformanceCounter(). For example, it is used by the statistics functions to compute the instantaneous socket bandwidth.
I think the real fix for this issue may have two methods to get the current time. One method based on QueryPerformanceCounter() for making time difference measurements with high resolution, and another method to return the current time with high accuracy but lower resolution. The second method would be used any time the current time is needed as an argument to a delay-type function for pthread-win32.
ormike
on 10 Jul 2019
I can reproduce this on a relatively low spec machine. Basically just opening a socket to listen is enough to trigger it a few minutes later.
Building on the workaround mentioned above, and having looked at the code, it seems that it is only CTimer::getTime() that uses gettimeofday and needs the accuracy, so why not simplify Windows gettimeday as follows:
int SRTCompat_gettimeofday(struct timeval* tp, struct timezone* tz)
{
    struct timeb tb;
    ftime(&tb);
    tp->tv_sec  = (long)tb.time;
    tp->tv_usec = 1000*tb.millitm;
    return 0;
}
and then move the high res code into CTimer::getTime() directly:
uint64_t CTimer::getTime()
{
    // XXX Do further study on that. Currently Cygwin is also using gettimeofday,
    // however Cygwin platform is supported only for testing purposes.

    //For other systems without microsecond level resolution, add to this conditional compile
#if defined(OSX) || (TARGET_OS_IOS == 1) || (TARGET_OS_TV == 1)
    // Otherwise we will have an infinite recursive functions calls
    if (m_bUseMicroSecond == false)
    {
        uint64_t x;
        rdtsc(x);
        return x / s_ullCPUFrequency;
    }
    // Specific fix may be necessary if rdtsc is not available either.
    // Going further on Apple platforms might cause issue, fixed with PR #301.
    // But it is very unlikely for the latest platforms.
#endif
#ifdef _WIN32
    timeval t;

    static LARGE_INTEGER tickFrequency, epochOffset;

    // For our first call, use "gettimeofday()", so that we get a time with a proper epoch.
    // For subsequent calls, use "QueryPerformanceCount()", because it's more fine-grain.
    static int isFirstCall = 1;

    LARGE_INTEGER tickNow;
    QueryPerformanceCounter(&tickNow);

    if (isFirstCall)
    {
        // Get time of day
        gettimeofday(&t, 0);

        // Also get our counter frequency:
        QueryPerformanceFrequency(&tickFrequency);

        // And compute an offset to add to subsequent counter times, so we get a proper epoch:
        epochOffset.QuadPart = t.tv_sec*tickFrequency.QuadPart + ((t.tv_usec/1000)*tickFrequency.QuadPart)/1000 - tickNow.QuadPart;

        isFirstCall = 0; // for next time
    }
    else
    {
        // Adjust our counter time so that we get a proper epoch:
        tickNow.QuadPart += epochOffset.QuadPart;

        t.tv_sec = (long) (tickNow.QuadPart / tickFrequency.QuadPart);
        t.tv_usec = (long) (((tickNow.QuadPart % tickFrequency.QuadPart) * 1000000L) / tickFrequency.QuadPart);
    }
#else
    timeval t;
    gettimeofday(&t, 0);
#endif
    return t.tv_sec * uint64_t(1000000) + t.tv_usec;
}
 oviano
on 17 Jul 2019
oviano
on 17 Jul 2019
In fact, does CTimer::getTime even need to be based to the epoch? Maybe we can leave out all the offset stuff from the above and just use the performance counter/frequency?
So usage rules become:
gettimeofday - use this when you want an epoch-based time, but no guarantee of resolution. Used as the base time for calls to pthread_cond_timedwait etc.
CTimer::getTime - use this when you want a time stamp that is going to be used to calculate/check intervals etc. Uses the highest resolution possible, but isn't guaranteed to be based on the epoch (though on platforms that just chain onto gettimeofday it obviously will be, the point is not to rely on it though)
oviano
on 17 Jul 2019
So just refining my suggested fix further, my local tests suggest that CTimer::getTime() doesn't need to be epoch-based (this is obviously permissible as can be seen from the Apple code path to the rdtsc call at the top of the function), so I think CTimer::getTime() could just be like this:
uint64_t CTimer::getTime()
{
    // XXX Do further study on that. Currently Cygwin is also using gettimeofday,
    // however Cygwin platform is supported only for testing purposes.

    //For other systems without microsecond level resolution, add to this conditional compile
#if defined(OSX) || (TARGET_OS_IOS == 1) || (TARGET_OS_TV == 1)
    // Otherwise we will have an infinite recursive functions calls
    if (m_bUseMicroSecond == false)
    {
        uint64_t x;
        rdtsc(x);
        return x / s_ullCPUFrequency;
    }
    // Specific fix may be necessary if rdtsc is not available either.
    // Going further on Apple platforms might cause issue, fixed with PR #301.
    // But it is very unlikely for the latest platforms.
#endif
#ifdef _WIN32
    static LARGE_INTEGER tickFrequency;
    static int isFirstCall = 1;
    if (isFirstCall)
    {
        QueryPerformanceFrequency(&tickFrequency);
        isFirstCall = 0;
    }
    LARGE_INTEGER tickNow;
    QueryPerformanceCounter(&tickNow);
    return tickNow.QuadPart * 1000000 / tickFrequency.QuadPart;
#else
    timeval t;
    gettimeofday(&t, 0);
    return t.tv_sec * uint64_t(1000000) + t.tv_usec;
#endif
}
This plus the simplification of gettimeofday as per two posts up resolves the high CPU issue caused by the pthread_cond_timedwait issue while preserving the high resolution timer code needed elsewhere in SRT for Windows.
oviano
on 18 Jul 2019
Hi maxlovic,
I also encountered a similar issue, my OS platform is WIN7.  I  just receive and dump data after connecting peer's machine,  the CPU load sometimes will be high after some minutes,  I tried the above workaround from oviano , it can not work in my environment.

The customers have already used SRT, we can not wait v1.4.1.  do you have another workaround for this issue?
 mark-tvu
on 2 Sep 2019
mark-tvu
on 2 Sep 2019
Can you profile it? e.g. run it inside Visual Studio and when it starts happening start a profile session and see what is going on?
Also, just wanted to check that you had applied both the workarounds:
- the simplified int SRTCompat_gettimeofday(struct timeval* tp, struct timezone* tz) (17th July post)
- modified uint64_t CTimer::getTime() (18th July post)
Both these removed the issue for me, so maybe there is another variation on this issue or you have another issue. But a profile may help track it down.
oviano
on 2 Sep 2019
Hi oviano,
Thanks your response.
I built SRT library in Visual Studio 2015, selecting Win32. I used below test code to test the CPU Load. at the beginning, the test process costs CPU around %0.3, sometimes, after 10 minutes, it will increase to over 20%. my CPU type is i7-3770.
I just tried the second workarounds(modified uint64_t CTimer::getTime() (18th July post), later, I will try the first workaround.
the test code is from maxlovic in another link for handle leak , i just modify recv_iterations to 2000000000
`using namespace std;
int run_srt(const char*ip, const char * port, int connect_tries, int recv_iterations)
{
int fd = 0, ret = 0;
struct addrinfo hints = { 0 }, *ai = NULL, *cur_ai = NULL;
//struct addrinfo hints = { 0 }, *ai, *cur_ai;
hints.ai_flags = AI_PASSIVE;
hints.ai_family = AF_INET;
hints.ai_socktype = SOCK_DGRAM;

//hints.ai_family = AF_UNSPEC;
//hints.ai_socktype = SOCK_DGRAM;
ret = getaddrinfo(ip, port, &hints, &ai);
if (ret) {
    printf("error: getaddrinfo returned %d\n", ret);
    return -1;
}

cur_ai = ai;

fd = srt_create_socket();
if (fd < 0) {
    printf("error: srt_socket %s\n", srt_getlasterror_str());
    return -1;
}

ret = -1;
for (int k = 0; k < connect_tries; k++) {
    // connect to the server, implict bind
    if (SRT_ERROR != srt_connect(fd, cur_ai->ai_addr, cur_ai->ai_addrlen))
    {
        ret = 1;
        break;
    }

    printf("error: srt_connect %s, ip %s, port %s\n",
        srt_getlasterror_str(), ip, port);
    Sleep(1);
}
freeaddrinfo(ai);

if (ret == -1)
{
    printf("Filed to connect\n");
    srt_close(fd);
    return -1;
}

for (int k = 0; k < recv_iterations; k++) {

    char buff[4096];
    ret = srt_recvmsg(fd, buff, sizeof(buff));
    if (SRT_ERROR == ret)
    {
        printf("error: srt_recvmsg %s\n", srt_getlasterror_str());
        ret = -1;
        break;
    }
    printf("succeed to recv msg %d\n", ret);
};

srt_close(fd);
return 0;
}
int main(int argc, char* argv[])
{
int ret = 0;
if ((argc != 3) || (0 == atoi(argv[2])))
{
    printf("usage: test_srt server_ip server_port");
    return -1;
}

if (srt_startup() < 0) {
     printf("error: srt_startup %s\n", srt_getlasterror_str());
     return -1;
}

run_srt(argv[1], argv[2], 1000, 2000000000);

srt_cleanup();
}`
mark-tvu
on 2 Sep 2019
Ok you definitely need this part of the 17th July post AND the 18th July post.
int SRTCompat_gettimeofday(struct timeval* tp, struct timezone* tz)
{
    struct timeb tb;
    ftime(&tb);
    tp->tv_sec  = (long)tb.time;
    tp->tv_usec = 1000*tb.millitm;
    return 0;
}
Hi @mark-tvu
Thanks for reporting. The fix for this issue is in PR #800, scheduled for v1.4.1.
I would highly apreciate if you could check if the current implementation fixes the observed high CPU load. Please check this branch.
It is still work in progress, anyway would be good to know how it behaves on your Win 7 system.
maxsharabayko
on 2 Sep 2019
Thanks for your response.
I will check it.
mark-tvu
on 3 Sep 2019
Hi
@maxlovic
I checked the branch , it can not work, srt_recvmsg hangs and don't return anything, using the same test code.
@oviano ,
Add both workarounds , the issue is disappeared, thanks your help.
mark-tvu
on 3 Sep 2019
@mark-tvu Sorry, I forgot I left an unsolved TODO with a mutex. Reproduced the hang up and fixed in the branch. Would you be so kind to check it again? Whether the high CPU usage is solved there.
maxsharabayko
on 3 Sep 2019
I think you resolve this issue, great!
When do we use an official release version? or can we directly use this branch?
mark-tvu
on 3 Sep 2019
@mark-tvu Great! Thanks for checking!
Those changes are planned for v1.4.1, after v1.4.0 is out around September, 13.
PR #800 will be merged to master not earlier than in November. There is still some work to do, so I can't recommend to use it directly. Prefer the solution proposed here by @oviano.
maxsharabayko
on 3 Sep 2019
Thank you very much.
mark-tvu
on 4 Sep 2019
thanks.
On Thu, Dec 19, 2019 at 2:15 AM Roman notifications@github.com wrote:
Closed #669 https://github.com/Haivision/srt/issues/669 via #929
https://github.com/Haivision/srt/pull/929.—
You are receiving this because you were mentioned.
Reply to this email directly, view it on GitHub
https://github.com/Haivision/srt/issues/669?email_source=notifications&email_token=AH2VS2NHW7KLRIJQYWZSL2LQZJSEPA5CNFSM4HJASDUKYY3PNVWWK3TUL52HS4DFWZEXG43VMVCXMZLOORHG65DJMZUWGYLUNFXW5KTDN5WW2ZLOORPWSZGOVSDRFEA#event-2894533264,
or unsubscribe
https://github.com/notifications/unsubscribe-auth/AH2VS2K7HDXUIYP5JKVZ5ZTQZJSEPANCNFSM4HJASDUA
.
--
BR,
Mark
Software Engineer
TVU networks
1279,Zhong Shan Road West Building 6, 10F, Shanghai, P.R. China
Making every transmission a successwww.tvunetworks.com
http://www.tvunetworks.com/ Facebook
https://www.facebook.com/TVUNetworks/ | Twitter
https://twitter.com/TVUNetworks | Instagram
https://www.instagram.com/tvu_networks/ | LinkedIn
https://www.linkedin.com/in/carolinemccarty/
mark-tvu
on 7 Jan 2020
@oviano's workaround for v1.4.1 seems to fail after about 32 days from OS beginning because "tickNow.QuadPart * 1000000" overflows int64_t max (3.4GHz CPU)
    LARGE_INTEGER tickNow;
    QueryPerformanceCounter(&tickNow);
    return tickNow.QuadPart * 1000000 / tickFrequency.QuadPart;
    // "32 * 24 * 60 * 60 * 3400000 * 1000000" exceeds std::numeric_limits<int64_t>::max()
so i made a little modification like this;
    LARGE_INTEGER tickNow;
    QueryPerformanceCounter(&tickNow);
    uint64_t s = tickNow.QuadPart / tickFrequency.QuadPart;
    return s * 1000000 + (tickNow.QuadPart - s * tickFrequency.QuadPart) * 1000000 / tickFrequency.QuadPart;
is my interpretation correct?
 wakabayashik
on 24 Feb 2021
wakabayashik
on 24 Feb 2021
@wakabayashik Thanks for noting!
The maximum int64_t value is INT64_MAX = 9223372036854775807.
With a nanosecond accuracy of timer (e.g. std steady clock), int64_t overflows in 106751 days (INT64_MAX / 10^9 / 3600 / 24).
With a 3.4GHz clock accuracy, int64_t overflows in 33359 days (INT64_MAX / (3.2 * 10^9) / 3600 / 24).
Therefore, tickNow.QuadPart * 1000000 can overflow in 0.8 hours. Assuming that 3.4 GHz clock provides 3.4 × 10^9 ticks per second.
However, as I can see, this potential overflow is not present in the current version.
Also, SRT v1.4.2 provides support for C++11 steady cock (cmake build option -DENABLE_STDCXX_SYNC=ON), which resolves the issue with high CPU load on Windows.
maxsharabayko
on 25 Feb 2021
@maxsharabayko Thank you for your reply
The actual measurement of QueryPerformanceFrequency seems to be 3328121 on the our server. (Intel (R) Xeon (R) E-2224 CPU @ 3.40GHz 3.41GHz)
- (INT64_MAX / 3328121 / 3600 / 24 / 1000000) = 32.075754 = 32days 1hour 49 min 5sec
It fits well with the actual behavior of our srt (v1.4.1) binary.
we tried v1.4.2 (-DENABLE_STDCXX_SYNC=ON), but it seems to consume more CPU time (not 100%) than v1.4.1, so we are deciding when to migrate. (receiving 100 or more srt streams on one server)
wakabayashik
on 26 Feb 2021
Related issues
oviano
·
6Comments
 DigitalTVDev
·
4Comments
DigitalTVDev
·
4Comments
 moonbc
·
4Comments
moonbc
·
4Comments
 alexpokotilo
·
3Comments
alexpokotilo
·
3Comments
 Svyatk0
·
6Comments
Svyatk0
·
6Comments