Srt: Unable to recover from errors inserted by tc qdisc
Hi,
I am using this command to insert errors between srt transmitter and receiver:
sudo tc qdisc add dev eth2 root netem corrupt 15%
Transmitter command:
./stransmit "udp://239.153.13.16:1234" "srt://172.16.153.13:1234/?mode=server"
Receiver command:
./stransmit "srt://172.16.153.13:1234/?mode=client&latency=250" "udp://239.235.13.2:1234"
(using @ before multicast address doesn't make any difference in my case in connecting to socket)
I am using different latency values from 150 to 600. Also tried setting oheadbw to 30/35/40(didn't see any change).
With latency, it improves the error as compared to without latency but after 20-30 mins., it starts showing up errors and eventually loses the stream by showing sync loss on my application.
So, how can we recover from these errors i.e how can set the optimal value of latency depending in our loss or is there any other way to do that like bw?
What's the acceptable error %(loss/corrupt) in real time internet that SRT can handle?
Also, it doesn't show any error log if we see cc errors or sync loss.
Thank you very much.
 prabh13singh
All 27 comments
I tested this netem corrupt settings with a pair of Makito X Encoder/Decoder running SRT 1.3.1 and saw 15% lost packets in receiver stats (most likely dropped by UDP rx socket before SRT). Both devices are on a local switch (RTT< 1ms), Video bitrate is 5 Mbps, SRT Latency 250 msec /w 25% overhead. The receiver recovers almost 100% of the lost and retransmitted packets. Note that SRT does not log errors for lost packets, it just increase the proper stats counter.
 jeandube
on 27 Aug 2018
jeandube
on 27 Aug 2018
So, where can we add logs if we want to see lost packets?
prabh13singh
on 29 Aug 2018
In your SRT application, query the stats of your running SRT session (CUDT::bstats) and check pktRcvLossTotal on receiver or pktRetransTotal on sender and log it if not 0.
jeandube
on 29 Aug 2018
But, it is not same as my cc errors on application(stream expert)
prabh13singh
on 29 Aug 2018
To trace the losses exactly when they happen, you can also turn on debug logging on receiver (-loglevel:debug in srt-live-transmit, in API: srt_setloglevel(LOG_DEBUG)). Logging messages go to stderr by default. Recommended to redirect them to a file, and to see them when they appear, read them back by tail -f.
In the log message containing: sending LOSSREPORT you will find the sequence numbers and amount of lost packets. Note that this event happens at the moment when a next-to-loss packet is received.
You may also be interested in packets that have been intentionally lost and not recovered (dropped).
- On sender:
SND-DROPPED - On receiver:
tsbpd: DROPSEQ
 ethouris
on 30 Aug 2018
ethouris
on 30 Aug 2018
Unfortunately, it did not show me any error related to packet loss by loglevel - debug or error. I only see increase in pktRcvLossTotal after I stop the application.
Like if I forward the udp stream on transmitter of srt stream, it shows me CC errors on receiver end of srt application but no log or stat from application. I just to see any message corrsponding to Continuity counter Errors but I can't.
prabh13singh
on 30 Aug 2018
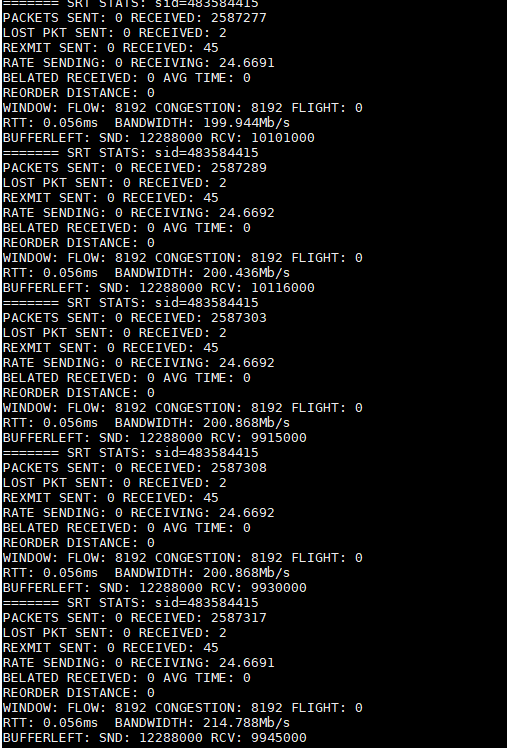
Can you please have a look at the Bandwidth.Why is it so high?
prabh13singh
on 30 Aug 2018
Hard to say whether it's very high, I'd need to know the video bitrate to have something to compare to.
In order to see debug logs, you need to enable heavy logging at compile time, as it puts a great burden on performance (--enable-heavy-logging).
It's hard to say what happened to make the bandwidth increase in this example, especially that although you had a packet loss, but in the past (the value of loss and rexmit is the same in all cases). Note that bandwidth is calculated from the times of incoming packets on the receiver side, so it is at least theoretically possible that packets have been stowed on the way and then released with very short delivery time between one another.
You also have a very weird situation that the number of lost packets found out by the receiver is 2, but the number of retransmitted packets is 45 - it looks like there was also a high rate of dropping retransmitted packets. I would keenly see the packet loss reports from the debug logs; without it it's hard to say what really happened.
ethouris
on 31 Aug 2018
Hi,
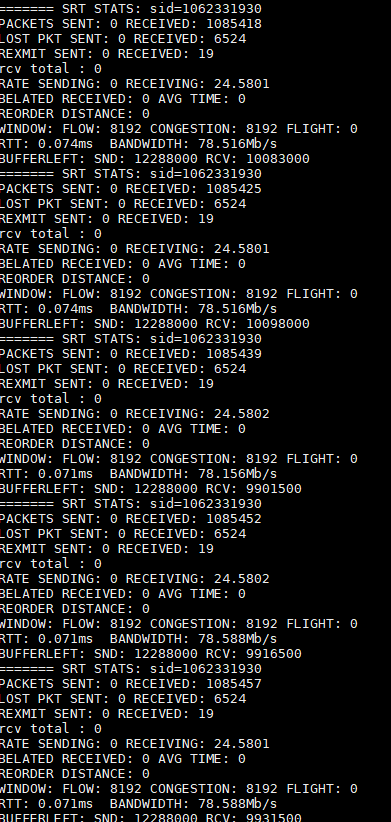
I am using 20 Mbps bit rate for streaming video. It's showing me same on the receiver but it is different on the the srt application.
I intentionally drop the packets by forwarding the video on transmitter multicast.
These are the stats now:
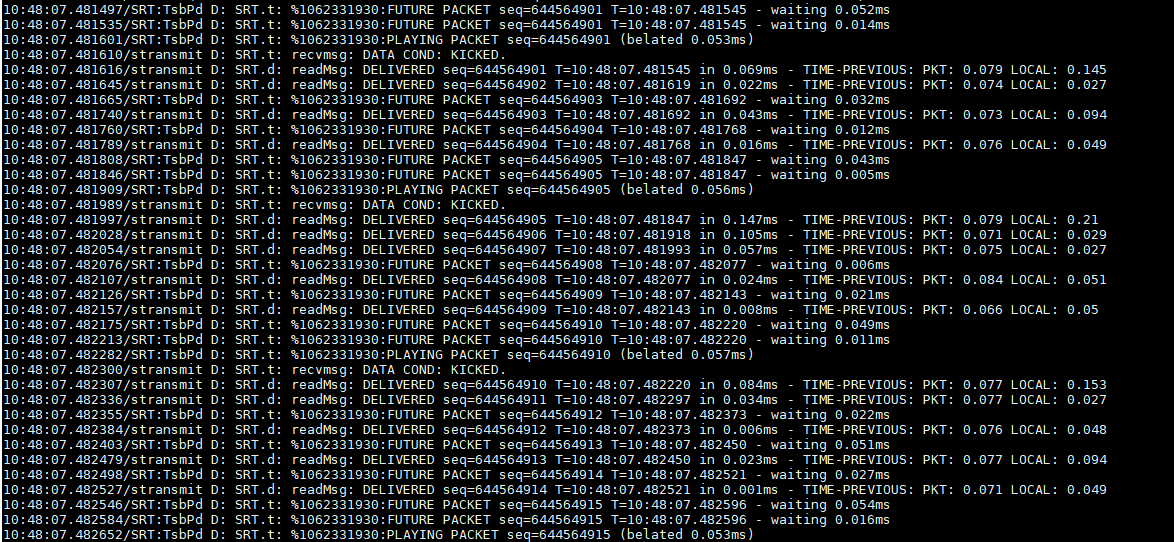
Random logs:
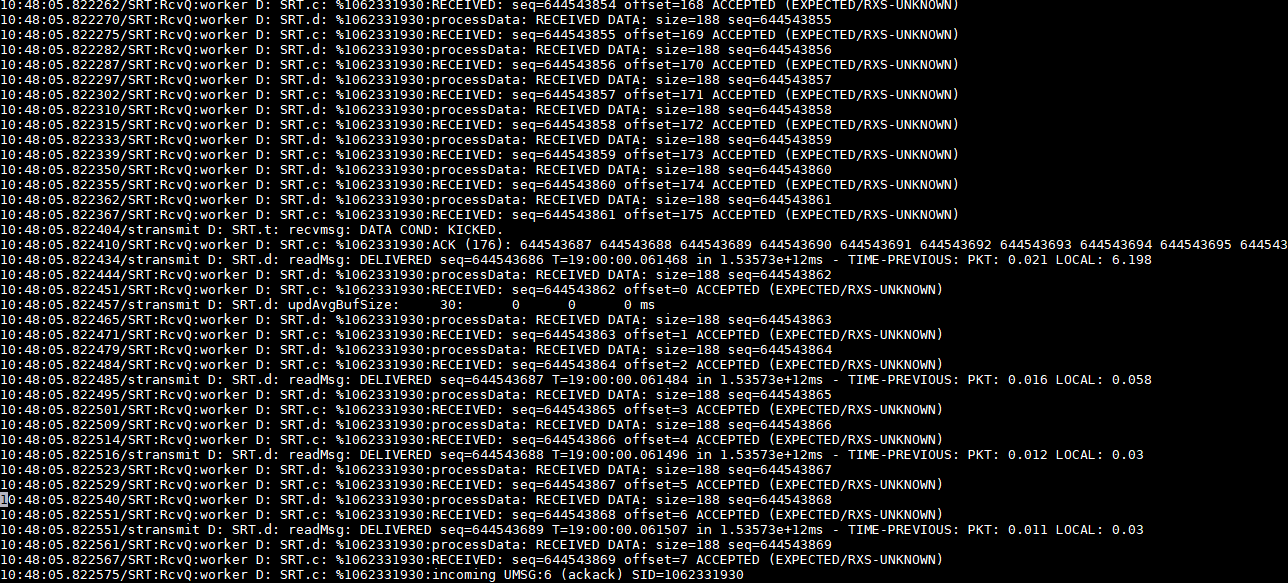
These are the last logs:

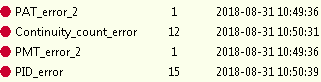
Errors on my monitoring application(stream-expert):
Thank you very much.
prabh13singh
on 31 Aug 2018
Debug logs produce lots of noise. To see anything useful you need to search for expressions. Try to look for sending LOSSREPORT and DROPSEQ in the logs from receiver to see packets that didn't reach the target and that have given up recovery.
Also packets that have been retransmitted will be notified in the logs with [REXMIT] mark.
ethouris
on 31 Aug 2018
Debug logs showing LOSSREPORT doesn't seem to be good as compared to stream expert.

DROPSEQ didn't show anything.
Also, I can't see stats on transmitter/server side.
prabh13singh
on 31 Aug 2018
6320 Packets lost? No, such network conditions definitely aren't within the ranges where SRT is predicted to work. To recover them your bandwidth will skyrocket and it's doubtful that you'll recover them all. Even 70 packets lost in a row is kinda excessive, but as a spike should be tolerated. For comparison, the receiver buffer has the size for 8192 packets by default.
Not sure what will appear in your configuration, so you can search for DROP in the logs on the receiver - some expression with this should appear, as long as you have debug logs on (even without heavy logging). It's rather not possible that with such a large loss the TLPKTDROP didn't trigger, especially that you do experience errors in the stream.
Would you be able to attach the original text files with logs? I'll try to extract more information from it.
ethouris
on 3 Sep 2018
I think I was doing it wrong because errors are in the udp stream not between the srt transmitter and receiver. I'll do that and attach the log file.
prabh13singh
on 4 Sep 2018
These are the logs only after few seconds:
srt_rx.txt
srt_tx.txt
after 2-3 minutes logs showing LOSSREPORT:
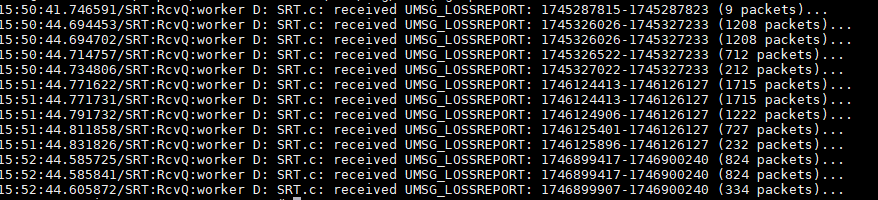

& if enable debug logs on transmitter side, it shows me some cc errors ?
Also, DROP shows packets when there is CC error but usually it is more than CC ERRORS.
prabh13singh
on 4 Sep 2018
It's hard to say for me how big losses on the network are tolerated, or how bad the network may be so that you can still send a live transmission over SRT. The least you need is that available bandwidth must withstand the video bitrate with overhead proportional to the loss rate. Mind also that lost packets stretch the actual RTT, so with higher loss rate you need higher latency.
The packet loss on UDP happening "naturally" is when there's too little bandwidth left on the link (momentarily) or there has happened some routing reconfiguration. Loss on such a grade as shown above normally would mean that too many data are being sent, and with that loss the retransmission would cause even more data to be sent - so this would be cumulative, unless it's a short living problem. So this is about getting the available bandwidth temporarily down, but then it goes back up again so that it can withstand the increased bandwidth usage due to retransmission. If the available bandwidth stayed the same as at the moment when the packet loss was experienced, the retransmission overhead will only make more losses to happen, potentially leading to overstretching the receiver buffer and broken link in result.
ethouris
on 5 Sep 2018
Another thing I wanted to ask is that:
1.We observed that debug logs(DROPSEQ) takes into account the dropping of null packets as well.
So, do the logs also report the dropping of null packets and if yes, then, is there a way to find that the packet dropped is null or actual data packet.
2.Can find the cause of dropped packet in logs?
prabh13singh
on 5 Sep 2018
What are "null packets"?
There's only one reason why packets can be dropped on the receiver side: the packet that follows the lost one is ready to play (the latency time has passed and the time calculated basing on sending time and latency is now), so any lost packets preceding it are dropped.
This can be also done on the sender side, when the predicted time to play a packet on the receiver side is in the past already, plus some tolerance time.
ethouris
on 6 Sep 2018
@prabh13singh If you want TS Null Packets to be dropped (VBR) you have to do that on the TS Mux level before passing it to SRT. SRT does not care about the carried TS content.
 premultiply
on 6 Sep 2018
premultiply
on 6 Sep 2018
Oh, thanks. I wasn't even thinking in the terms of what's inside the stream, sorry.
ethouris
on 6 Sep 2018
Thank you very much
prabh13singh
on 6 Sep 2018
I have another problem. If I transmit a TS stream with bit-rate more than 30 Mbps, it stops sending the stream. I can increase it in the code and there is a function to auto-detect the input video bit-rate, but it didn't work. It's showing me bit-rate of 1.25 Mbps but my stream bit-rate is 55 Mbps and then it stops after few seconds.
prabh13singh
on 11 Sep 2018
To know what's happening, you can trace the sender buffer in the stats. In a structure of SRT_TRACEBSTATS type filled by srt_bstats call, you have fields like pktSndBuf, byteSndBuf and msSndBuf that can show you the level of the sender buffer. If these stats increase over time it means that your sender buffer is choking and it's impossible to send with that speed.
AFAIR I saw somewhere a declaration that 30Mbps is treated as "infinite", probably SRT wasn't tested with bigger speed so far (at least for live mode). @jeandube should probably know more details.
ethouris
on 12 Sep 2018
@prabh13singh, If you don't set any of SRTO_MAXBW and SRTO_INPUTBW, the default output ceiling is 30mbps. If you set SRTO_MAXBW=0 and SRTO_INPUTBW=0 then the input bitrate will be measured internally and used to adjust the output bitrate to measured-input*(100+overhead)/100, overhead being configured with SRTO_OHEABW (in %). Note that the units of SRTO_MAXBW and SRTO_INPUTBW are in bytes/sec.
jeandube
on 12 Sep 2018
@jeandube I think inputbw is set to 0 by default but still if I set both of them to zero, but it didn't work. The function "CSndBuffer::getInputRate" is getting called, but not getting proper input rate. If I pass 1000 in function "m_pSndBuffer->setInputRateSmpPeriod(5000000)",
it works for few seconds and then it stops showing me the error of " Floating point exception".
prabh13singh
on 12 Sep 2018
@prabh13singh If you can run your pplication in gdb, maybe you can find exaclty where you get the FPE.
jeandube
on 13 Sep 2018
But why is it not working using default parameters?
prabh13singh
on 13 Sep 2018
What does "not working" mean? If you wrote your own application it could be all sort of things. In the description you made earlier, you describe internal functions, not something applications normally access. For example if I interpret that you modified the code to set the input rate sampling period to 1 msec instead of 5 secs, there may be very few packets to do the calculation. Even if you stream 40Mbps (you may have easy to encode input (ex: black screen) dropping the input rate to less than 1 pkt/msec. I would suggest you to set your input rate using the API (option SRTO_INPUTBW) to 40Mbps in bytes/sec (40000000bps/8 bits/bytes=5000000bytes/sec).
jeandube
on 13 Sep 2018
Related issues
 DigitalTVDev
·
4Comments
DigitalTVDev
·
4Comments
 oviano
·
6Comments
oviano
·
6Comments
 amukhsimov
·
3Comments
amukhsimov
·
3Comments
 alexpokotilo
·
9Comments
alexpokotilo
·
3Comments
alexpokotilo
·
9Comments
alexpokotilo
·
3Comments
Most helpful comment
@prabh13singh If you want TS Null Packets to be dropped (VBR) you have to do that on the TS Mux level before passing it to SRT. SRT does not care about the carried TS content.