Sqldelight: Performance bottlneck interacting with statement cache in native
Hi! I'm using SQLDelight on iOS. SQLDelight generates queries that properly setup a unique int identifiers for use with statement caching. I'm doing some performance testing of a date serialization function that we're using for getting dates in and out of a sql column, and I noticed that SQLDelight interacting with the statement cache was the main bottleneck on inserts. Here's a snippet of the query being used:
fun insert(Comment: Comment) {
        driver.execute(4,
                """INSERT OR REPLACE INTO Comment VALUES (?, ?, ?, ?, ?, ?, ?, ?, ?, ?)""", 10) {
            bindString(1, Comment.field)
/* more bind code followed by notifyQueries*/
    }
We're doing the following to bulk insert these objects:
queries.transaction {
    for (object in objects) {
        queries.insert(object)
    }
}
Heaviest trace:

To insert 100k objects, it takes 17s on my machine. 9s of that is the above trace. Is there a more efficient way in SQLDelight to do this kind of bulk insert? Thanks!
Update: that trace is a bit misleading. That heavy stack is shared by inserts and fetches: 6s for inserts, 3s for fetches.
 benasher44
All 34 comments
@kpgalligan is gonna take a look. Thanks for the report!
 AlecStrong
on 21 Feb 2019
AlecStrong
on 21 Feb 2019
@benasher44 Have any more info on the table and it's column definitions? I'm going to run some local tests
 kpgalligan
on 21 Feb 2019
kpgalligan
on 21 Feb 2019
Thanks! I'll put together a sample project and upload it here, but I'm unfortunately out of time today. I'll get one up tomorrow afternoon.
FWIW, the bottleneck here appears to be in ~accessConnection and how it interacts with that map~, which is before (i think) any of the binders are called for the insert. I will get you a sample project though as soon as I can!
benasher44
on 21 Feb 2019
This has a task called runIosSimTests that runs a test and prints out the time it took to finish insert 100k objects and then fetch them back out. I had to dig into that trace again because I was having trouble reproducing it, but I figured it out. That trace shows the heaviest trace, from the bottom up. If you go up the tree, it splits: 6s in this heavy trace created from inserts and 3s (ish) from fetching the same objects back out. I've recreated this scenario in a test (run runIosSimTest, which assumes you have Xcode installed and a simulator available, which can be renamed to match one you have installed).
benasher44
on 22 Feb 2019
Taking a look today. If you've got some time I'd like to try a hangout/screen share and see how to best measure time in each part of the code. I haven't done a ton with Instruments to measure method performance, so would like to see what you're doing. I ran a similar 100k insert in my code and tried it on actual devices to see what "real world" looks like. An iphone xs and pixel 2 do the same ops about 1 second apart (7s vs 6s). Android won, which I was a little surprised by, as there isn't the same jni layer happening, but I'm going to replace with your code sample and poke around.
The "cache" itself is a hashmap implemented with atomic primitives. It is not designed for best performance for sure, but the assumption was because we're talking to the db, and ultimately i/o, a concurrent map isn't going to be the bottleneck. The statement cache is indexed by sequential int, so it could be implemented with an array rather than a map, which would perform "better", but I would like to really nail down how we're measuring method time.
kpgalligan
on 22 Feb 2019
Wrote a simpler cache and the number diffs are significant, to put it mildly. Statement indexes are incremental integers starting at 0, so I have a simple array and cache index is just the number. Running for 250k on device came back with ~9500ms. The current map version is ~18800, so twice-ish.
That's on a single thread, with a single statement, but still.
There's a lot of time used because each time we pull from the cache we remove the entry, then re-add it, which creates a Node record in the map which needs to be frozen. That was the confusing part in the time trace. What was it freezing? Well, internal map records.
This version will be fine for 10's or 100's of statements, but I don't know what it'll look like with really large numbers of entries, and it seems short sighted to have an unbounded cache. Somebody will eventually blow that up.
Going to put this on the shelf and come back to it sometime between later today and early in the week. Thinking of alternate ideas. Stately has been getting a slow burn review. Maybe think about map performance a bit more. The original write was explicitly not worried about performance, and I figured that would get some focus later. It's later.
https://github.com/kpgalligan/sqldelight/tree/kpgalligan/2019-02-22/native-linear-cache
There's a "no lock" version of the linear cache in the history. It resulted in no performance help, but added a lot of complexity. Granted, all tests have been run in a single thread, but so would all db inserts. Aggressive selects from multiple threads might be a different story, but still unlikely to be worth it.
kpgalligan
on 23 Feb 2019
Running for 250k on device came back with ~9500ms. The current map version is ~18800, so twice-ish.
Woah! Nice work! 👏👏👏
That was the confusing part in the time trace. What was it freezing? Well, internal map records.
I thought about this some more and got a tip from the #kotlin-native channel in slack. I went and marked the queries object using ensureNeverFrozen(), which confirmed that the queries object itself its getting frozen (likely because it is the transaction object, which eventually ties back to the statement), when freezing the statement in the cache. The whole object graph being frozen might be even larger than that (this queries connects to the db object, which connects to every other queries object), which I think explains why freeze() isn't super cheap here.
benasher44
on 23 Feb 2019
I think the freeze part could be fixed/improved by making SQLiter.NativeStatement only hold its connections's nativePointer instead of the connection itself. I think that would break the object graph and make freeze very cheap for statements, but maybe there's a design consideration there I'm missing that would make that change not ideal.
benasher44
on 23 Feb 2019
"which confirmed that the queries object itself its getting frozen" They are getting frozen? That would be super weird. Looking at that now.
In sqliter, NativeDatabaseConnection is basically a thin wrapper around the C++ pointer. The "connection" is just a long, as far as Kotlin is concerned, which points down to the C++ here
kpgalligan
on 23 Feb 2019
My guess is that it's through the NativeDatabaseConnection's reference to its transaction, which in this case is the queries object:
NativeStatement -> internal val connection -> NativeDatabaseConnection -> internal val transaction (which is the queries object in SQLDelight)
benasher44
on 23 Feb 2019
You can replicate this by calling queries.ensureNeverFrozen() just before the queries.transaction call that starts the bulk insert, in the sample project.
benasher44
on 23 Feb 2019
SQLiter and SQLDelight both have a class called "Transaction", but they're different. SQLiter's is just this...
data class Transaction(val successful: Boolean)
It really could be an enum (None, Success, Fail)
Trying to get ensureNeverFrozen to fail now, but it's not in my code. Debugger is also not stopping, so I need to do clean build, which of course takes roughly forever.
kpgalligan
on 23 Feb 2019
Ah okay, noted! I had a suspicion I might be jumping the gun there. Welp that was my best guess. Happy to help more with repro steps at least!
benasher44
on 23 Feb 2019
You're calling ensureNeverFrozen on the sqldelight object. Ah. All of that needs to be frozen, or you'd need a thread local. However, the db connection shouldn't be causing what's in the transaction block to freeze (and isn't in my tests).
The basic issue is stately's map is super slow. There are some solutions to that. The original Kotlin Native sqlite driver (KNarch.db) was written before stately, and mostly before AtomicReference in Native. I was detaching pointers and stuffing them into a C++ map. That performance is probably amazing. Need to think about that kind of cache for stately. Completely steps around "Saner Concurrency", but hmm.
kpgalligan
on 23 Feb 2019
Oh! I see I conflated this freeze with some other freeze. That makes sense. Thanks! Glad it wasn't from the statement 😅
benasher44
on 23 Feb 2019
BTW, it you want to play with new version, get my branch and run
./gradlew :drivers:ios-driver:publishToMavenLocal
Then add mavenLocal() to your project's repos
kpgalligan
on 23 Feb 2019
as an aside it would be cool to use ensureNeverFrozen in some tests on things we think shouldnt be frozen
AlecStrong
on 23 Feb 2019
I think the freeze part could be fixed/improved by making SQLiter.NativeStatement only hold its connections's nativePointer instead of the connection itself.
It might be worth testing the performance difference with this change ^. That would still shrink the object graph from NativeStatement -> NativeDatabaseConnection -> NativeDatabaseManager to just NativeStatement. Not huge, but still a reduction in objects that need to be frozen for each call.
benasher44
on 23 Feb 2019
It shouldn't be re-frozen on each call. When you call 'freeze' on an object, if it's already frozen, it just returns immediately without running through the graph. The contract with frozen is anything reachable from the object is also frozen, so it only checks the graph once. Summary, it shouldn't do anything after the first freeze, but maybe I'm not understanding exactly what you're talking about.
kpgalligan
on 23 Feb 2019
In theory, 95%+ of the freeze time in the trace was internal to stately's map, hence the new cache doubling performance. I haven't run a time trace, but I'd expect freeze to be virtually zero.
kpgalligan
on 23 Feb 2019
Oh I see. Maybe this goes back to it being the Entry that's being frozen? Since you had to create a new Entry each time, that has to be re-frozen? I think I follow
benasher44
on 23 Feb 2019
I haven't run a time trace, but I'd expect freeze to be virtually zero.
I might be able to do this later today
benasher44
on 23 Feb 2019
I'm running it now. I clearly have a full social calendar.
Stately's map has a "Node" record. When you remove an entry, that's GC'd. When you add, that gets created and frozen. I think that was most of the freeze time. The db statement itself didn't change and was already frozen. I hate to say this out loud, but stately might get an object pool for Nodes.
kpgalligan
on 23 Feb 2019
When you add, that gets created and frozen. I think that was most of the freeze time.
Got it. This has sunk in for me now.
benasher44
on 23 Feb 2019
Well, that's interesting. Might roughly double performance again. Similar issue ("slow" collection).
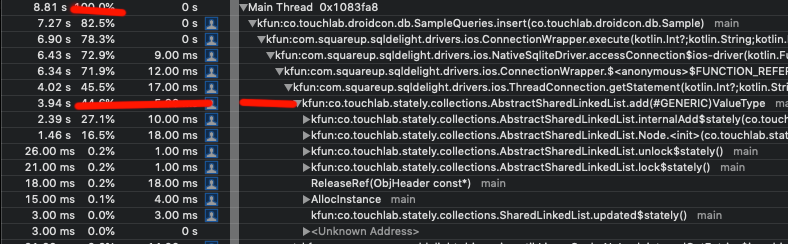
It's a stately linked list with a Node internal entry. Assuming there's a way to do that which would be much closer to < 1 second vs 4, we'd have gone from 18 seconds to ~5 in one otherwise uneventful Saturday.
kpgalligan
on 23 Feb 2019
Oh yeah, our old friend is in there.
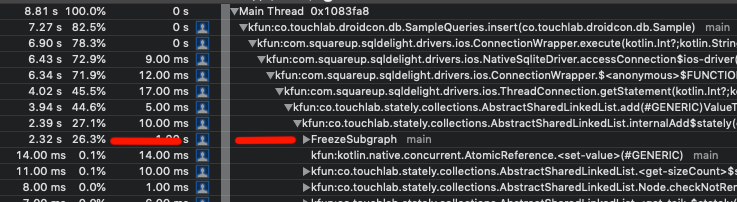
kpgalligan
on 23 Feb 2019
OK. I have to verify numbers more, but using an object pool internally cut the 250k insert almost in half. Average of 3 runs is 5112ms. As mentioned, current release version is 18800ms and the last speed up was about 9500ms. Simulator is slower, about 6300ms.
Needs more review and tests in Stately, but unless there's something really strange I'm not seeing, it works.
Pixel 2 reports 15331 average. 3x. I assume that's basically jni.
kpgalligan
on 23 Feb 2019
Learned a lot about performance over the weekend. Here's where we're at.
A lot of the time is involved with the internal map and list accounting in stately. As each entry is added/removed, there's an internal object "Node" that gets created. That's for the linked list. Each one of those needs to be frozen, which was adding a lot of time, but also, for add/remove, you're doing a lot of atomic reference assignment. It's expensive.
Adding an object pool for Node sped that up dramatically. Object pool is kind of ugly, but Kotlin Native is not exactly optimized, so it is what it is.
After that, I was poking through the code some more. We remove the statement from the cache for both selects and mutations, but it only makes sense for selects. Keeping them in the cache for mutation statements means more significant performance increase. It also makes the object pool kind of pointless, at least in our case.
I'm taking one quick look now at another option. Keeping a weak ref to statements in a thread local. That's about as fast as you'd be able to push it before sqlite itself becomes a significant portion of the proc time.
The speed diff depends largely on number of fields in table, as the slow down was a per-insert call. I ran a test with a 2-field table inserting 500k rows. Current lib is just under 40s, no thread local was about 10s, and with thread local the first shot was about 7s. 5x-ish. For tables with more cols, it's kind of ~3x.
I just ran the original sample for 250k and the current sqldelight driver is about 17.5s and with all the tweaks it's about 5.2s.
Making these changes does not change the sqldelight driver a whole lot, but it's also not a huge priority to get into a release, but I'll do a bit more poking then wrap a PR together to take a look at.
kpgalligan
on 25 Feb 2019
To be clear, this will also make the Kotlin native sqlite/sqldelight performance way better than Android (presumably lack of jni). When multithreaded coroutines happens, I have some ideas about a super optimized mutation architecture, where all updates are sent to a single thread queue, and we take some of the sqlite thread sanity checks off, but that's definitely not something we need to chat about soon.
kpgalligan
on 25 Feb 2019
Any time frame on when these improvements might make it into a PR? 😁
 itstheceo
on 27 Jan 2020
itstheceo
on 27 Jan 2020
I'd have to re-look at it. My thinking on concurrent collections has changed a lot recently. https://dev.to/touchlab/kotlin-native-isolated-state-50l1
kpgalligan
on 27 Jan 2020
I spent a day looking into the native insert performance issues, then found this issue. Exactly the same cause as I discovered. Each time modifying the Sharedxxx data structure, freeze the subGraph took long time. Assume caching the prepared statement is for performance reasons. But in my test if i always create a new prepared statement is faster than caching them now.
My benchmark test: insert 1000 rows into a table has two columns
CREATE TABLE bus (
                 id INTEGER PRIMARY KEY AUTOINCREMENT,
                 longName TEXT NOT NULL,
                 shortName TEXT);
Insert code:
database.transaction {
            for (i in 1..count){
                driver.execute(i, "INSERT INTO bus (longName, shortName) VALUES (\"first\",\"last\");", 0,null)
            }
        }
I have tried the following experiment, see very different performance for inserting 1000 rows inside a transaction:
With both
inUseStatementsandstatementCachecache(master code), the insertion took 22msReturn
connection.createStatement(sql)directly without caching, took 13ms.Since we only need to remove the PreparedStatement for query cursor, we can have a separate cache for write statement. Store the write statement in
AtomicReference<Map<Int, Statement>>. If the prepared statement is already in the map, return it. Otherwise copy the map, add the preparedStatement, freeze it and set it back to AtomicReference. For this approach, If I run the same test, of course the first pass is really slow. But after all the PreparedStatements are cached, it is REALLY fast.
First round inserting 1000 rows took: 220ms.
After that each time inserting 1000 rows only took 4.1ms.
The getExecutionStatement code:
    private val mapRef: AtomicReference<Map<Int, Statement>> = AtomicReference(mapOf())
       fun getExecuteStatement(identifier: Int?, sql: String): Statement {
        if (identifier == null) {
            return connection.createStatement(sql)
        }
        if (mapRef.value.containsKey(identifier)) {
            return mapRef.value.getValue(identifier)
        } else {
            val newMap = mapRef.value.toMutableMap()
            val statement = connection.createStatement(sql)
            newMap[identifier!!] = statement
            mapRef.value = newMap.freeze()
            return statement
        }
    }
Although the perf of first pass inserting 1000 rows was horrible, there is great chance the write is super fast if the statement was cached. This could be very helpful if there were few queries that executed very frequently by the application. Or, even provide an interface for the application to pre init the cache for the queries they know will be used often.
- I was going to try
IsolateStatebut the gradle dep was weird. I couldn't get it to work :(
@AlecStrong @kpgalligan thoughts?
 ivyspirit
on 4 May 2020
ivyspirit
on 4 May 2020
I'll get this back on the radar and look at it.
kpgalligan
on 4 May 2020
@kpgalligan IsolateState might be especially efficient now that all writes go to the same thread on native
benasher44
on 5 Jul 2020
Related issues
 mkruczkowski
·
4Comments
mkruczkowski
·
4Comments
 treelzebub
·
3Comments
treelzebub
·
3Comments
 KChernenko
·
4Comments
KChernenko
·
4Comments
 Nishant-Pathak
·
3Comments
Nishant-Pathak
·
3Comments
 davidbilik
·
3Comments
davidbilik
·
3Comments
Most helpful comment
To be clear, this will also make the Kotlin native sqlite/sqldelight performance way better than Android (presumably lack of jni). When multithreaded coroutines happens, I have some ideas about a super optimized mutation architecture, where all updates are sent to a single thread queue, and we take some of the sqlite thread sanity checks off, but that's definitely not something we need to chat about soon.