Spyder: Autoscale plots pane for optimal quality
Plots pane notably degrades quality unless image dimensions match _exactly_ with that plotted in interactive console:
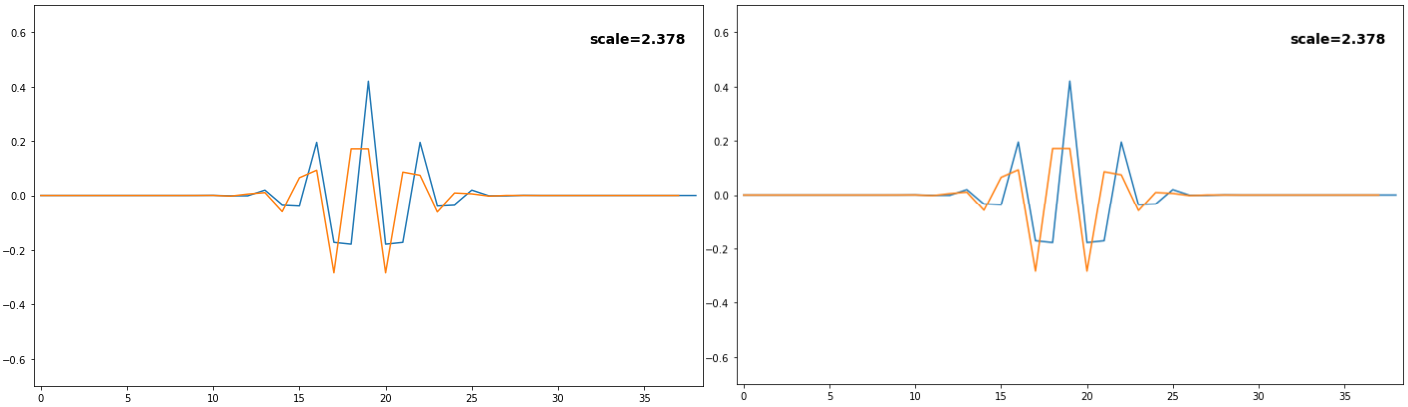
Both are from plots pane, with right only two minimal possible plot pane width increments smaller than left. Would be nice, then, to instead have a button which automatically sizes the plots pane optimally for the selected plot.
 OverLordGoldDragon
All 15 comments
Hi @OverLordGoldDragon, thanks for this suggestion, @ccordoba12, maybe we should store plots in a vectorized format such as SVG? Or is this going to be improved on the upcoming web plot explorer for Spyder 5?
 andfoy
on 2 Oct 2020
andfoy
on 2 Oct 2020
@ccordoba12, maybe we should store plots in a vectorized format such as SVG?
It's already possible to display plots as SVGs in the Plots pane. The problem is we're using QtSvg for that, which has serious limitations because that module can't render all the SVG spec, just a subset.
My proposed solution on issue #9987 was to use a QWebWidget instead. It shouldn't be that hard to implement that, so if you have some free time in the next couple of weeks, it'd be a really nice addition for 4.2.
I'd also close this issue in favor of #9987 because I prefer to switch to SVGs by default rather than trying to autoscale plots so that they display well as PNGs.
 ccordoba12
on 2 Oct 2020
ccordoba12
on 2 Oct 2020
@ccordoba12 Sure @ SVG, though mind this'll greatly increase RAM use, where I already found plots pane using some %'s, so the PNG option should be preserved.
OverLordGoldDragon
on 2 Oct 2020
I also think that it is very important to preserve the png option.
@ccordoba12 The QWebWidget you are speaking of, is this https://doc.qt.io/archives/qt-5.5/qwebview.html?
 jnsebgosselin
on 10 Oct 2020
jnsebgosselin
on 10 Oct 2020
Both are from plots pane, with right only two minimal possible plot pane width increments smaller than left. Would be nice, then, to instead have a button which automatically sizes the plots pane optimally for the selected plot.
@OverLordGoldDragon Isn't it what you get if you keep the zoom to 100%?
jnsebgosselin
on 10 Oct 2020
@jnsebgosselin Huh, I totally missed this - indeed. Though there are still unshown fractional %, and hand maneuvering is still needed to adjust it for each individual plot, so it's far off from a "rescale for each plot automatically" or at least "press here to rescale" - but since we already track the "optimal" number, we don't need to calculate anything, so I'd think this feature should be pretty simple to implement.
OverLordGoldDragon
on 10 Oct 2020
Both are from plots pane, with right only two minimal possible plot pane width increments smaller than left. Would be nice, then, to instead have a button which automatically sizes the plots pane optimally for the selected plot.
@OverLordGoldDragon Isn't it what you get if you keep the zoom to 100%?
Ok I've tested this and the answer is no. For some reason, when using 100% the plot pane is still resampling the figure with Qt.SmoothTransformation.
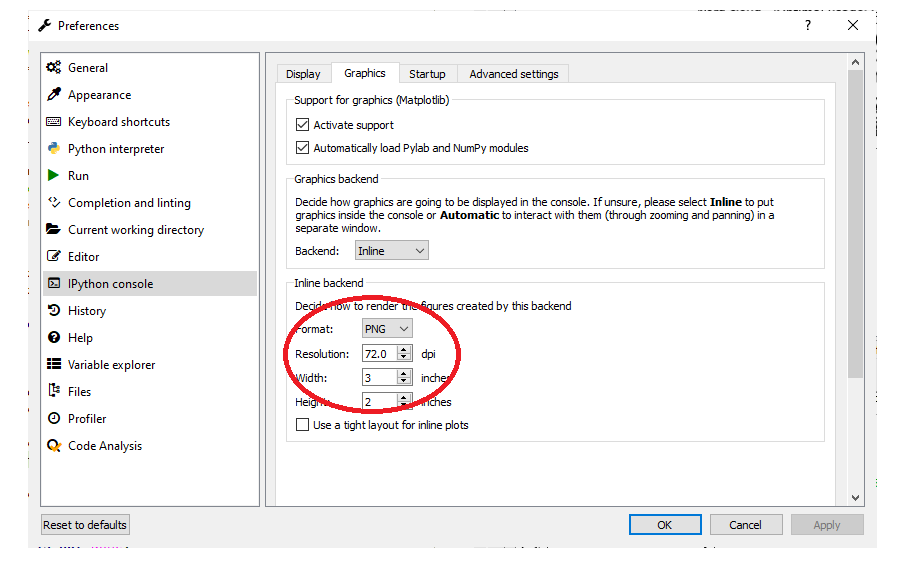
I never really noticed it since I was using a dpi of 300 in the preferences. But when using a lower resolution, let's say 72 dpi, it is clearly visible.
jnsebgosselin
on 10 Oct 2020
@jnsebgosselin That's not what I'm seeing; simply 100% isn't enough, as it's actually something between 99 and 101% - slightly sliding the plots pane yields optimal quality for me. And, "resampling" != "imperfect"; one can resample perfectly, but stuff needs to line up, which is I guess what happens at 100.00%.
OverLordGoldDragon
on 10 Oct 2020
@jnsebgosselin That's not what I'm seeing; simply 100% isn't enough, as it's actually something between 99 and 101% - slightly sliding the plots pane yields optimal quality for me. And, "resampling" != "imperfect"; one can resample perfectly, but stuff needs to line up, which is I guess what happens at 100.00%.
Ok I understand what you mean. Yes you are right. However, what you want should be achievable by simply deactivating the plots pane option Fit plot to window and keeping the zoom to 100%.
However, the figure is still being resampled even when the zoom is perfectly at 100.0%. It is probably because the condition I have set to determine if the image needs resampling or not doesn't take into account some margin or border of the widget on which it is painted. I can take a look at it.
Basically, this condition should be False when the zoom is at 100%:
jnsebgosselin
on 10 Oct 2020
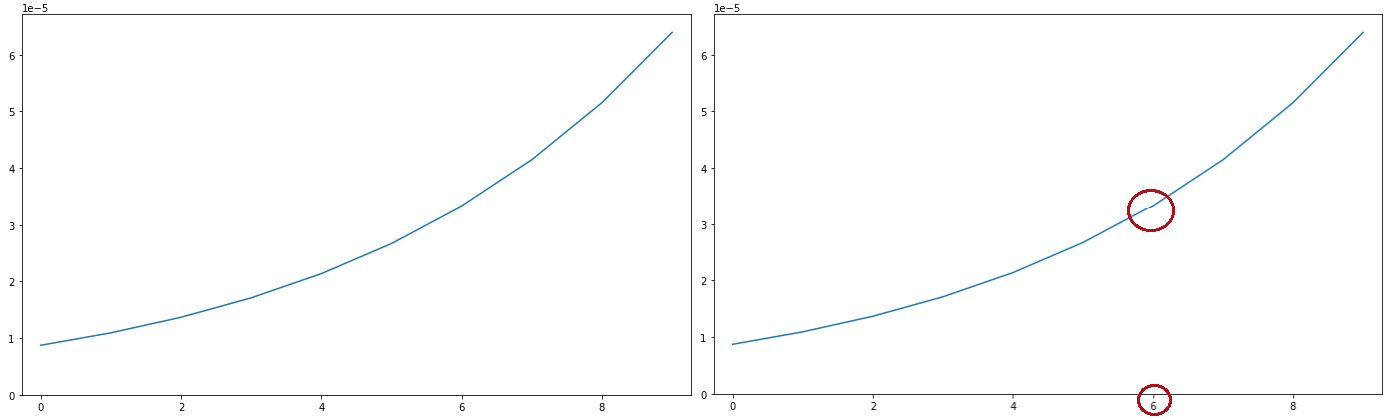
@jnsebgosselin Alright, there are slight artifacts depending on plot, so I misunderstood the resampler - but blur is minimal and rare, good enough for me:
OverLordGoldDragon
on 10 Oct 2020
Ok, I decided to reopen this one so @jnsebgosselin can take a look at it.
ccordoba12
on 10 Oct 2020
Ok excellent, I'll take a look at this this weekend. It's probably not too complicated to fix.
jnsebgosselin
on 10 Oct 2020
what you want should be achievable by simply deactivating the plots pane option Fit plot to window
@jnsebgosselin Yes, this is exactly it! Well that's much time lost rescaling the pane - the solution was a click away. And in my previous comment's plot, the discontinuity artifact, and all blur were fully eliminated. Don't know if I missed a doc mention somewhere, but this may be worth mentioning at least in a tooltip (e.g. "will degrade plots" when checking Fit plot to window).
OverLordGoldDragon
on 10 Oct 2020
what you want should be achievable by simply deactivating the plots pane option Fit plot to window
@jnsebgosselin Yes, this is exactly it! Well that's much time lost rescaling the pane - the solution was a click away. And in my previous comment's plot, the discontinuity artifact, and all blur were fully eliminated. Don't know if I missed a doc mention somewhere, but this may be worth mentioning at least in a tooltip (e.g. "will degrade plots" when checking
Fit plot to window).
This is excellent then. After looking into this a little bit more, you are right that "resampling" != "imperfect". At 100%, the resampling should be perfect though, and it seems to be if the option Show plot outline is unchecked.
If the option Show plot outline is checked however, the figure then is resampled "imperfectly" to take into account the 1px frame that is added around the figure. I think that the frame width should be taken into so that the figure is resampled perfectly at 100% even when the option Show plot outline is checked.
jnsebgosselin
on 10 Oct 2020
@jnsebgosselin I don't know its internals of resampling so can't predict caveats, but yeah, it seems lossless at 100.0%. And frankly, even a tooltip wouldn't help me there, as I checkmarked long ago and never questioned it; maybe a marker next to the % that, when hovered over, says something like "plots degraded due to checkmarking X".
OverLordGoldDragon
on 10 Oct 2020
Related issues
 goanpeca
·
3Comments
goanpeca
·
3Comments
 Khalilsqu
·
3Comments
Khalilsqu
·
3Comments
 neilsf1975
·
3Comments
neilsf1975
·
3Comments
 gabrielclow
·
3Comments
gabrielclow
·
3Comments
 cchu08
·
3Comments
cchu08
·
3Comments