Possible? I currently have to re-plot stuff to order them a certain way for viewing, which can be quite expensive. The Plots pane is nice for directly comparing images, but this feature seems absent.
 OverLordGoldDragon
All 10 comments
@jnsebgosselin what do you think?
 goanpeca
on 6 Apr 2020
goanpeca
on 6 Apr 2020
Nice suggestion @OverLordGoldDragon! It shouldn't be that hard to implement (I think).
 ccordoba12
on 6 Apr 2020
ccordoba12
on 6 Apr 2020
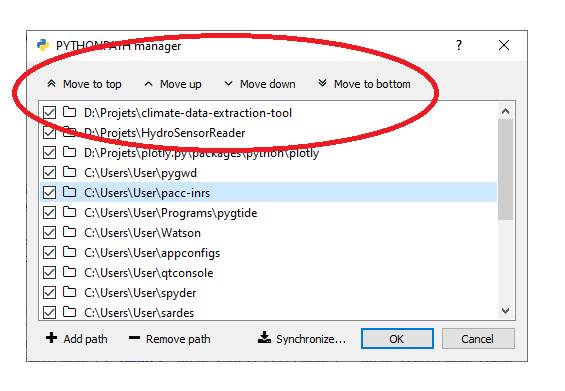
Do you mean moving up and down the plots in the thumbnail scrollbar?
If it is implemented with toolbuttons like for the Python path manger, this will be easy. If it needs to be done with some kind of drag and drop feature, this will be harder.
 jnsebgosselin
on 6 Apr 2020
jnsebgosselin
on 6 Apr 2020
Would be great to combine this with a full size view of the thumb upon double click? Ideally you could scroll through your thumbs with "image up", "image down" keys in full size view. Maybe the magnifying glass icons already serve this purpos, but in my case they are disabled, at least for mathplotlib pictures.
 tstreibl
on 6 Apr 2020
tstreibl
on 6 Apr 2020
@jnsebgosselin Yeah, in the thumbnail scrollbar. Drag & drop doesn't really matter - though it'd be even better if it had shortcuts.
@tstreibl Do you mean like below? You can undock the Plots pane and drag away the thumbnail bar to maximize view size.
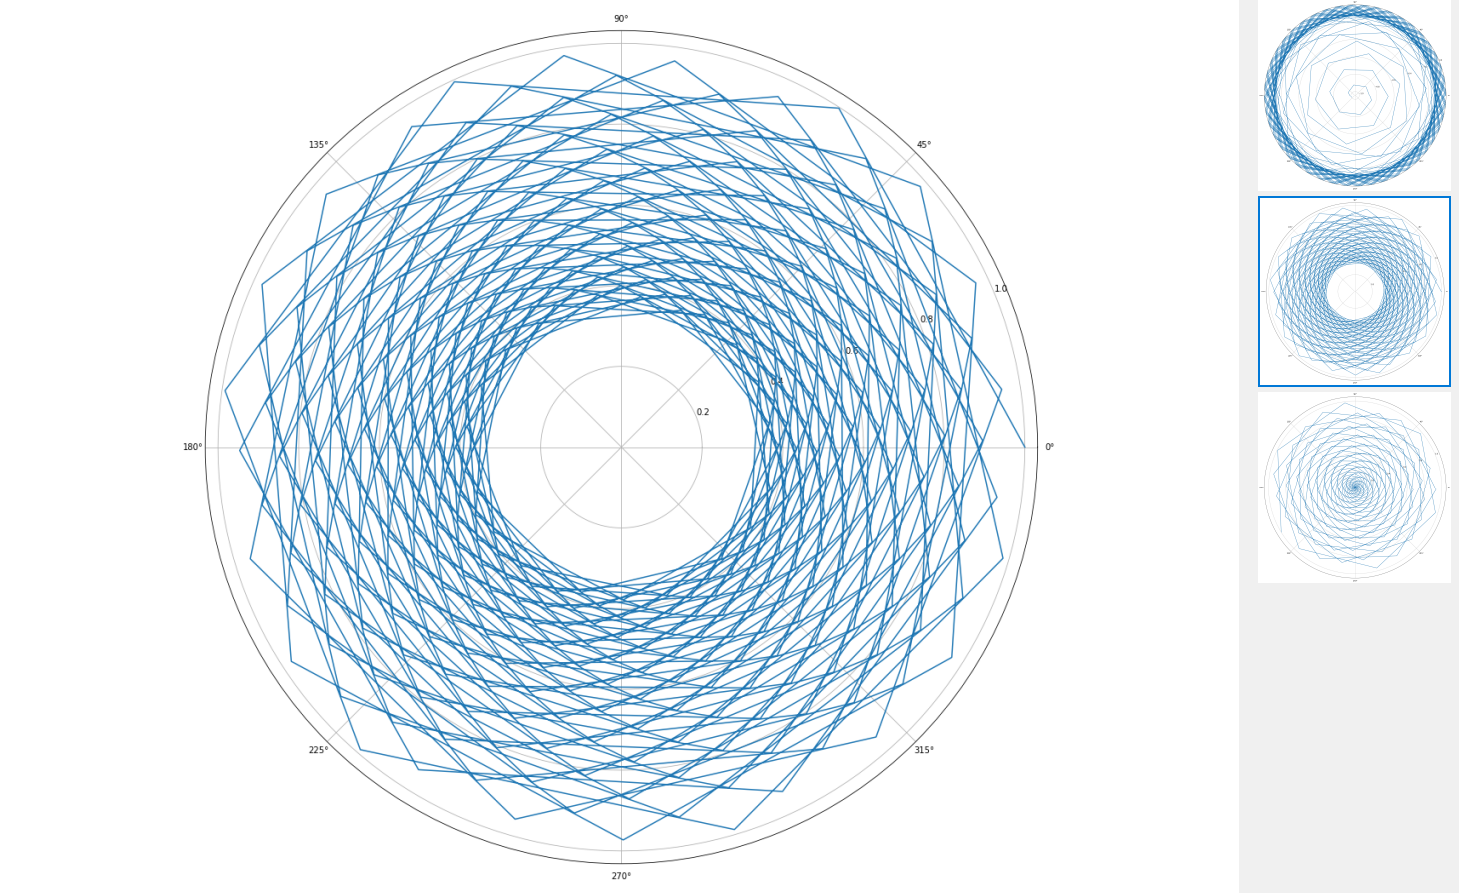
Plot code
import numpy as np
import matplotlib.pyplot as plt

def pplot(r, w=1, h=1):
    plt.polar(r)
    plt.gcf().set_size_inches(18 * w, 18 * h)

pplot(- np.linspace(0, 1, 300)**12)
pplot(np.exp(- np.linspace(0, 1, 400)))
pplot(np.linspace(0, 1, 300) ** 2)
Wow - did't realize that it's so easy. Sorry that I did't get it. Problem solved. Thanks.
tstreibl
on 6 Apr 2020
Maybe the magnifying glass icons already serve this purpos, but in my case they are disabled, at least for mathplotlib pictures.
They are disabled when Fits plot to window is checked.

jnsebgosselin
on 6 Apr 2020
komplete shame on me. Thanks.
tstreibl
on 6 Apr 2020
No worries, it's not like it was well documented and you are not the first confused by this. Maybe we need to change that to make it less confusing...
jnsebgosselin
on 6 Apr 2020
It's intuitive and fit's together once you decide to play around with the docking capabilities. I like that it's also easy to redock, so it's in deed a full featured image viewer. Great.
tstreibl
on 6 Apr 2020
Related issues
goanpeca
·
3Comments
 gabrielclow
·
3Comments
gabrielclow
·
3Comments
 SapnaSM
·
3Comments
SapnaSM
·
3Comments
 LDONT
·
3Comments
LDONT
·
3Comments
 spyder-bot
·
3Comments
spyder-bot
·
3Comments
Most helpful comment
@jnsebgosselin Yeah, in the thumbnail scrollbar. Drag & drop doesn't really matter - though it'd be even better if it had shortcuts.
@tstreibl Do you mean like below? You can undock the Plots pane and drag away the thumbnail bar to maximize view size.
Plot code