Spyder: Spyder 4.0 does not render plots on the console
Problem Description
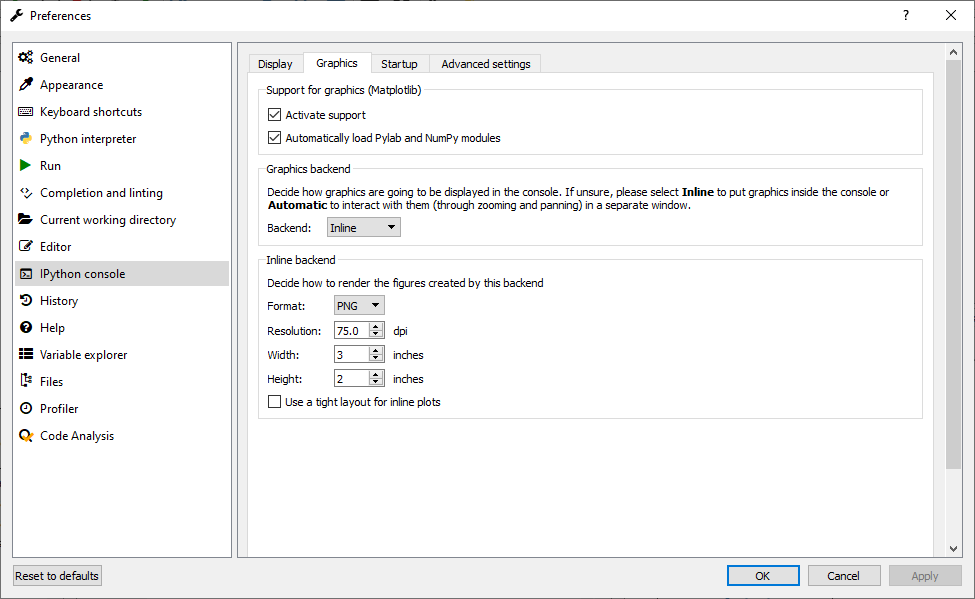
Plots are not rendering in the Spyder console. Instead, they appear in a plot pane. Despite having tried what Spyder suggest (see Traceback), the error remains.
What steps reproduce the problem?
- When try to plot any figure.
3.
What is the expected output? What do you see instead?
The expected output is a plot in the Spyder console. Instead, the plot is rendered in the plot pane.
Paste Traceback/Error Below (if applicable)
Figures now render in the Plots pane by default. To make them also appear inline in the Console, uncheck "Mute Inline Plotting" under the Plots pane options menu.
Versions
- Spyder version: 4.0.0
- Python version: 3.7.4
- Qt version: 5.9.6
- PyQt version: 5.9.2
- Operating System name/version: Windows 10 Home
Dependencies
cloudpickle >=0.5.0          :  1.2.2 (OK)
pygments >=2.0               :  2.5.2 (OK)
qtconsole >=4.6.0            :  4.6.0 (OK)
nbconvert >=4.0              :  5.6.1 (OK)
sphinx >=0.6.6               :  2.2.2 (OK)
pylint >=0.25                :  2.4.4 (OK)
psutil >=0.3                 :  5.6.7 (OK)
qtawesome >=0.5.7            :  0.6.0 (OK)
qtpy >=1.5.0                 :  1.9.0 (OK)
pickleshare >=0.4            :  0.7.5 (OK)
zmq >=17                     :  18.1.0 (OK)
chardet >=2.0.0              :  3.0.4 (OK)
numpydoc >=0.6.0             :  0.9.1 (OK)
spyder_kernels >=1.8.1;<2.0.0:  1.8.1 (OK)
qdarkstyle >=2.7             :  2.7 (OK)
atomicwrites >=1.2.0         :  1.3.0 (OK)
diff_match_patch >=20181111  :  20181111 (OK)
intervaltree                 :  None (OK)
watchdog                     :  None (OK)
keyring                      :  None (OK)
pexpect >=4.4.0              :  4.7.0 (OK)
pympler                      :  None (OK)
sympy >=0.7.3                :  1.4 (OK)
cython >=0.21                :  0.29.14 (OK)
IPython >=4.0                :  7.10.1 (OK)
matplotlib >=2.0.0           :  3.1.1 (OK)
pandas >=0.13.1              :  0.25.3 (OK)
numpy >=1.7                  :  1.17.4 (OK)
scipy >=0.17.0               :  1.3.1 (OK)
pyls >=0.31.2;<0.32.0        :  0.31.2 (OK)
rtree >=0.8.3                :  0.8.3 (OK)
Awaiting Followup
 mfavereau
All 4 comments
Could you check @jnsebgosselin ?
 goanpeca
on 8 Dec 2019
goanpeca
on 8 Dec 2019
Could you check @jnsebgosselin ?
It is working as expected for me.
Spyder 4.0.0.dev0 (Commit: 78376fa59)
Python 3.7.3 64-bit | Qt 5.9.6 | PyQt5 5.9.2 | Windows 10

 jnsebgosselin
on 8 Dec 2019
jnsebgosselin
on 8 Dec 2019
👍3
Sorry but we cannot reproduce this behavior. Closing.
goanpeca
on 8 Dec 2019
Thanks! Now it works.
mfavereau
on 8 Dec 2019
👍2
Was this page helpful?
0 / 5 - 0 ratings
Related issues
 LDONT
·
3Comments
LDONT
·
3Comments
 cchu08
·
3Comments
cchu08
·
3Comments
 gabrielclow
·
3Comments
gabrielclow
·
3Comments
 danieltomasz
·
3Comments
goanpeca
·
3Comments
danieltomasz
·
3Comments
goanpeca
·
3Comments
Most helpful comment
It is working as expected for me.
Spyder 4.0.0.dev0 (Commit: 78376fa59)
Python 3.7.3 64-bit | Qt 5.9.6 | PyQt5 5.9.2 | Windows 10