Spring-framework: StringHttpMessageConverter may trigger humongous allocations (G1GC)
Affects: 5.2.7.RELEASE
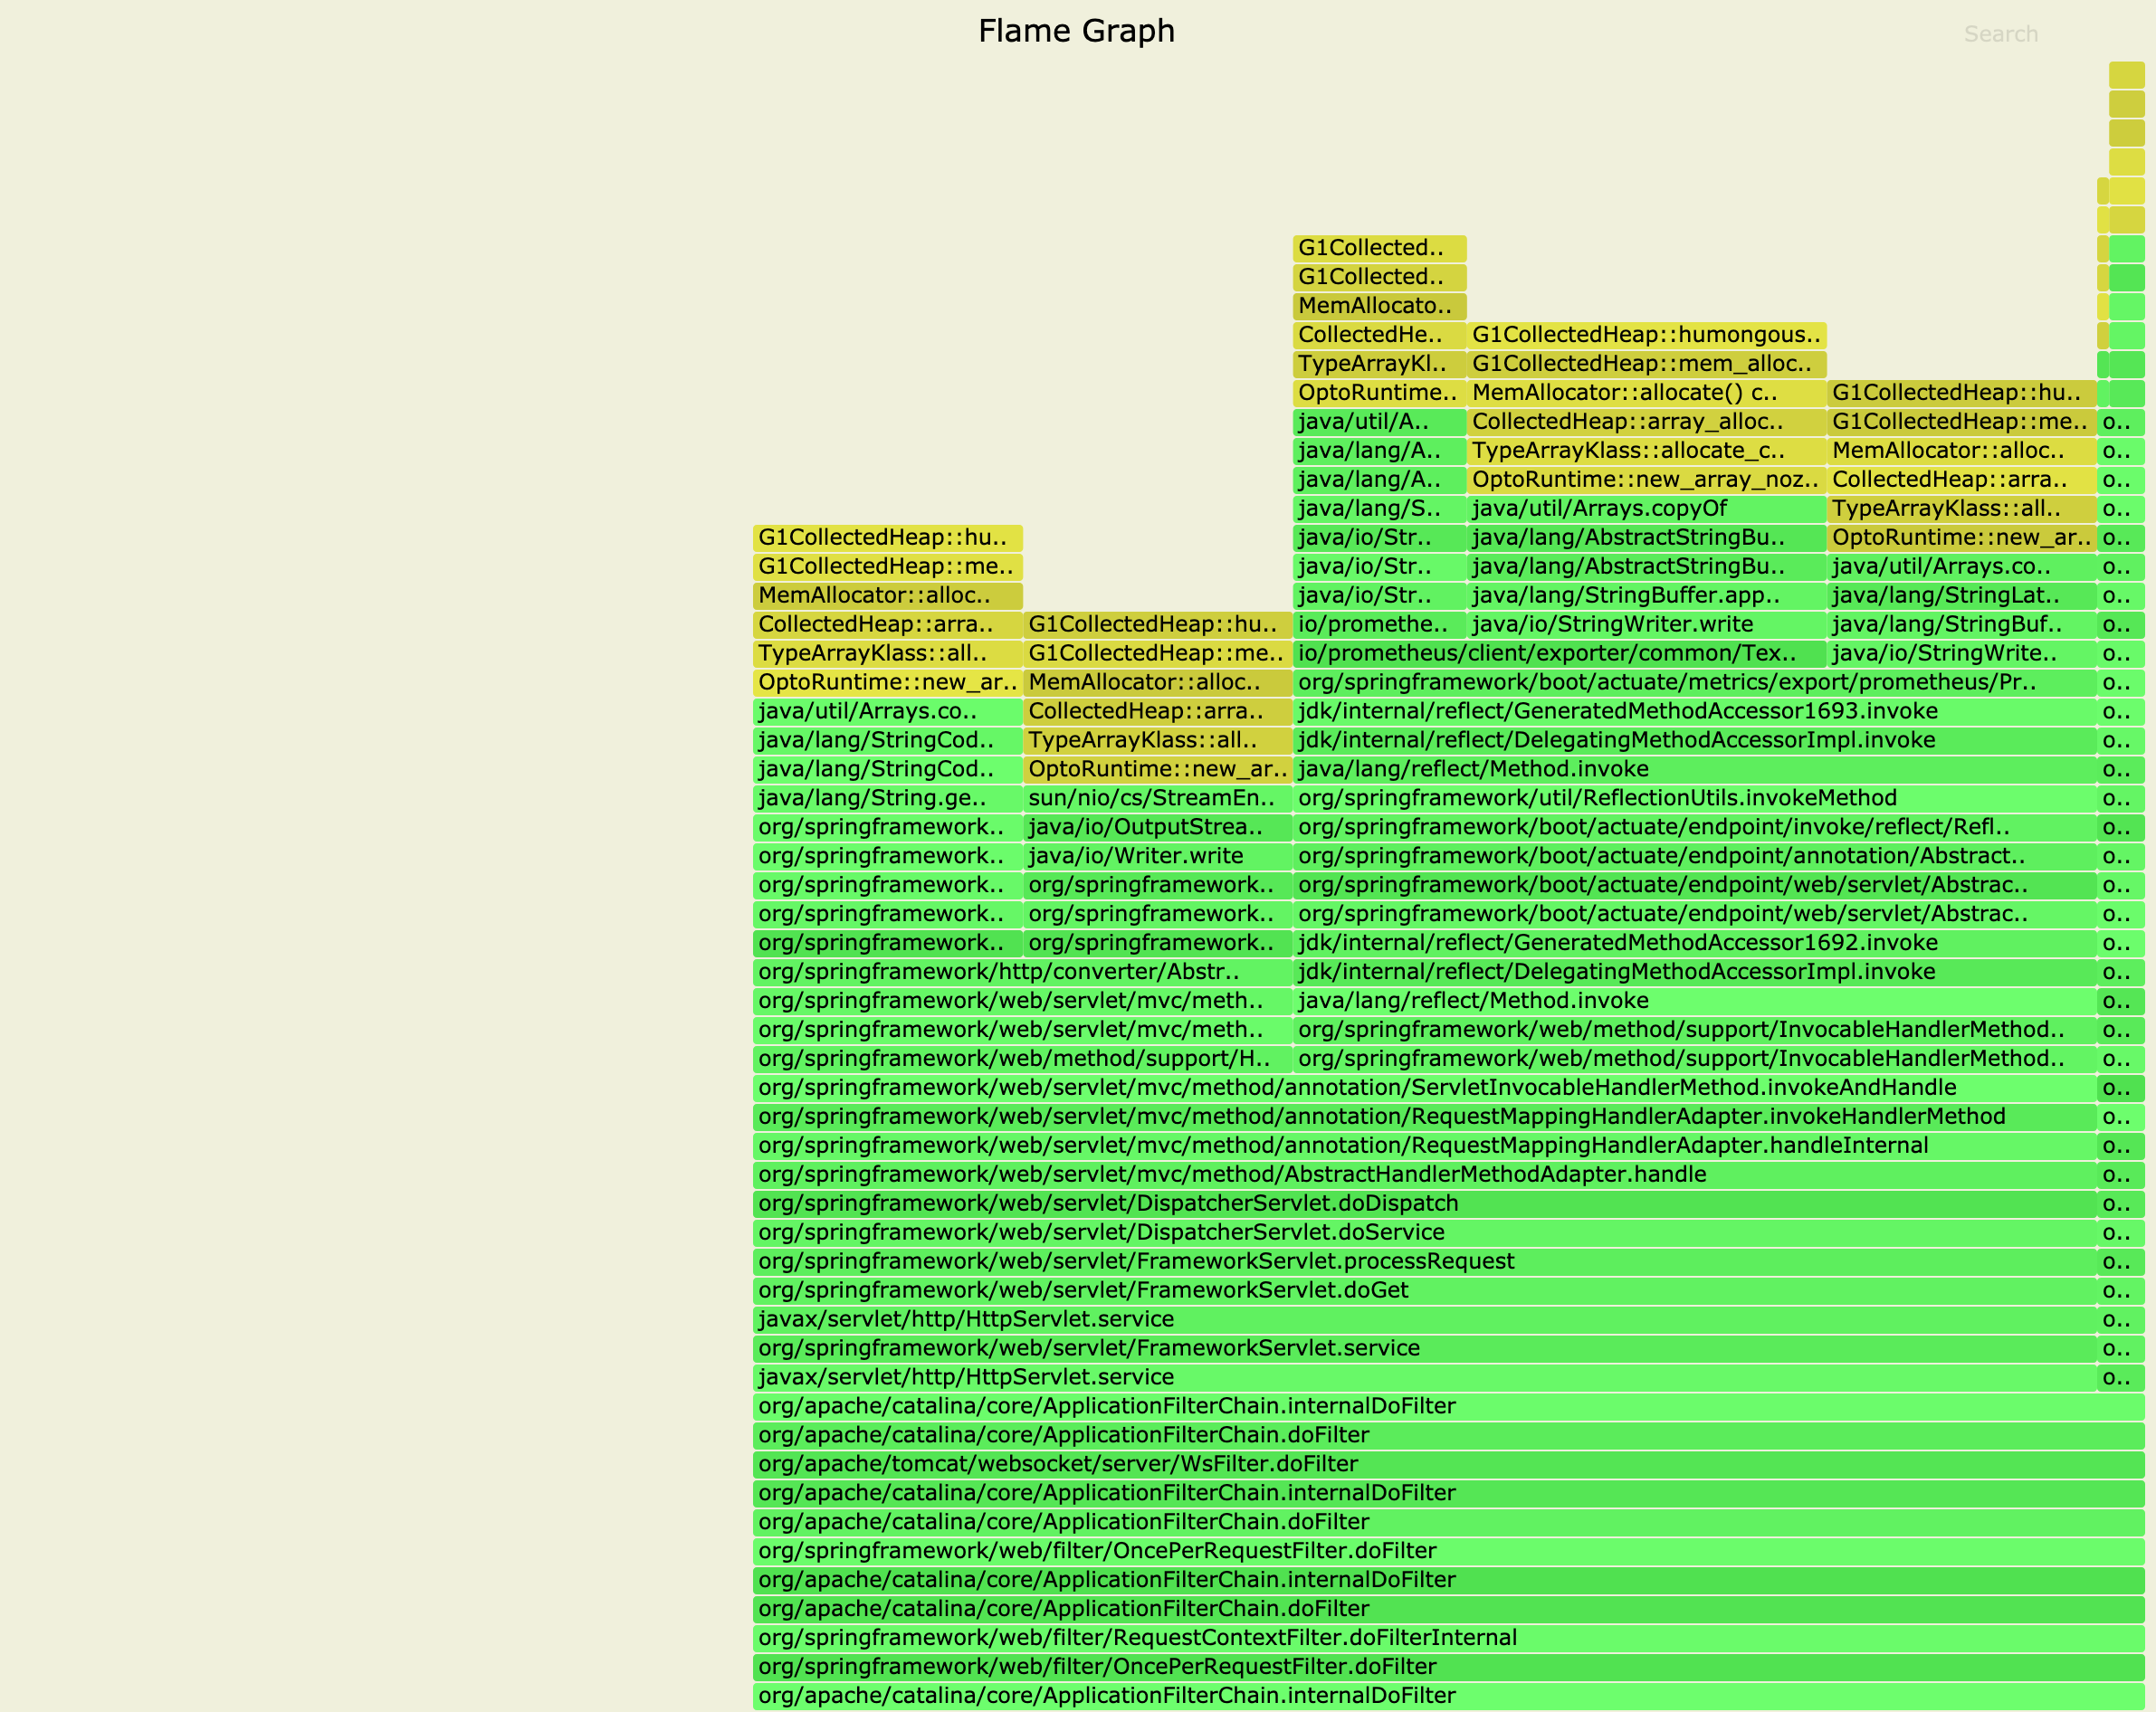
I come from spring-projects/spring-boot#21308, where I noticed that Spring related code is triggering humongous allocations (g1GC). Part of these are related to Spring Boot actuators. But others are triggered by WebMVC code.
This is causing regular unresponsiveness in the application(s) (pauses up-to ~100ms).
I can share the flamegraph privately as there are other _private flames_ triggering humongous allocations.
 bric3
bric3
All 12 comments
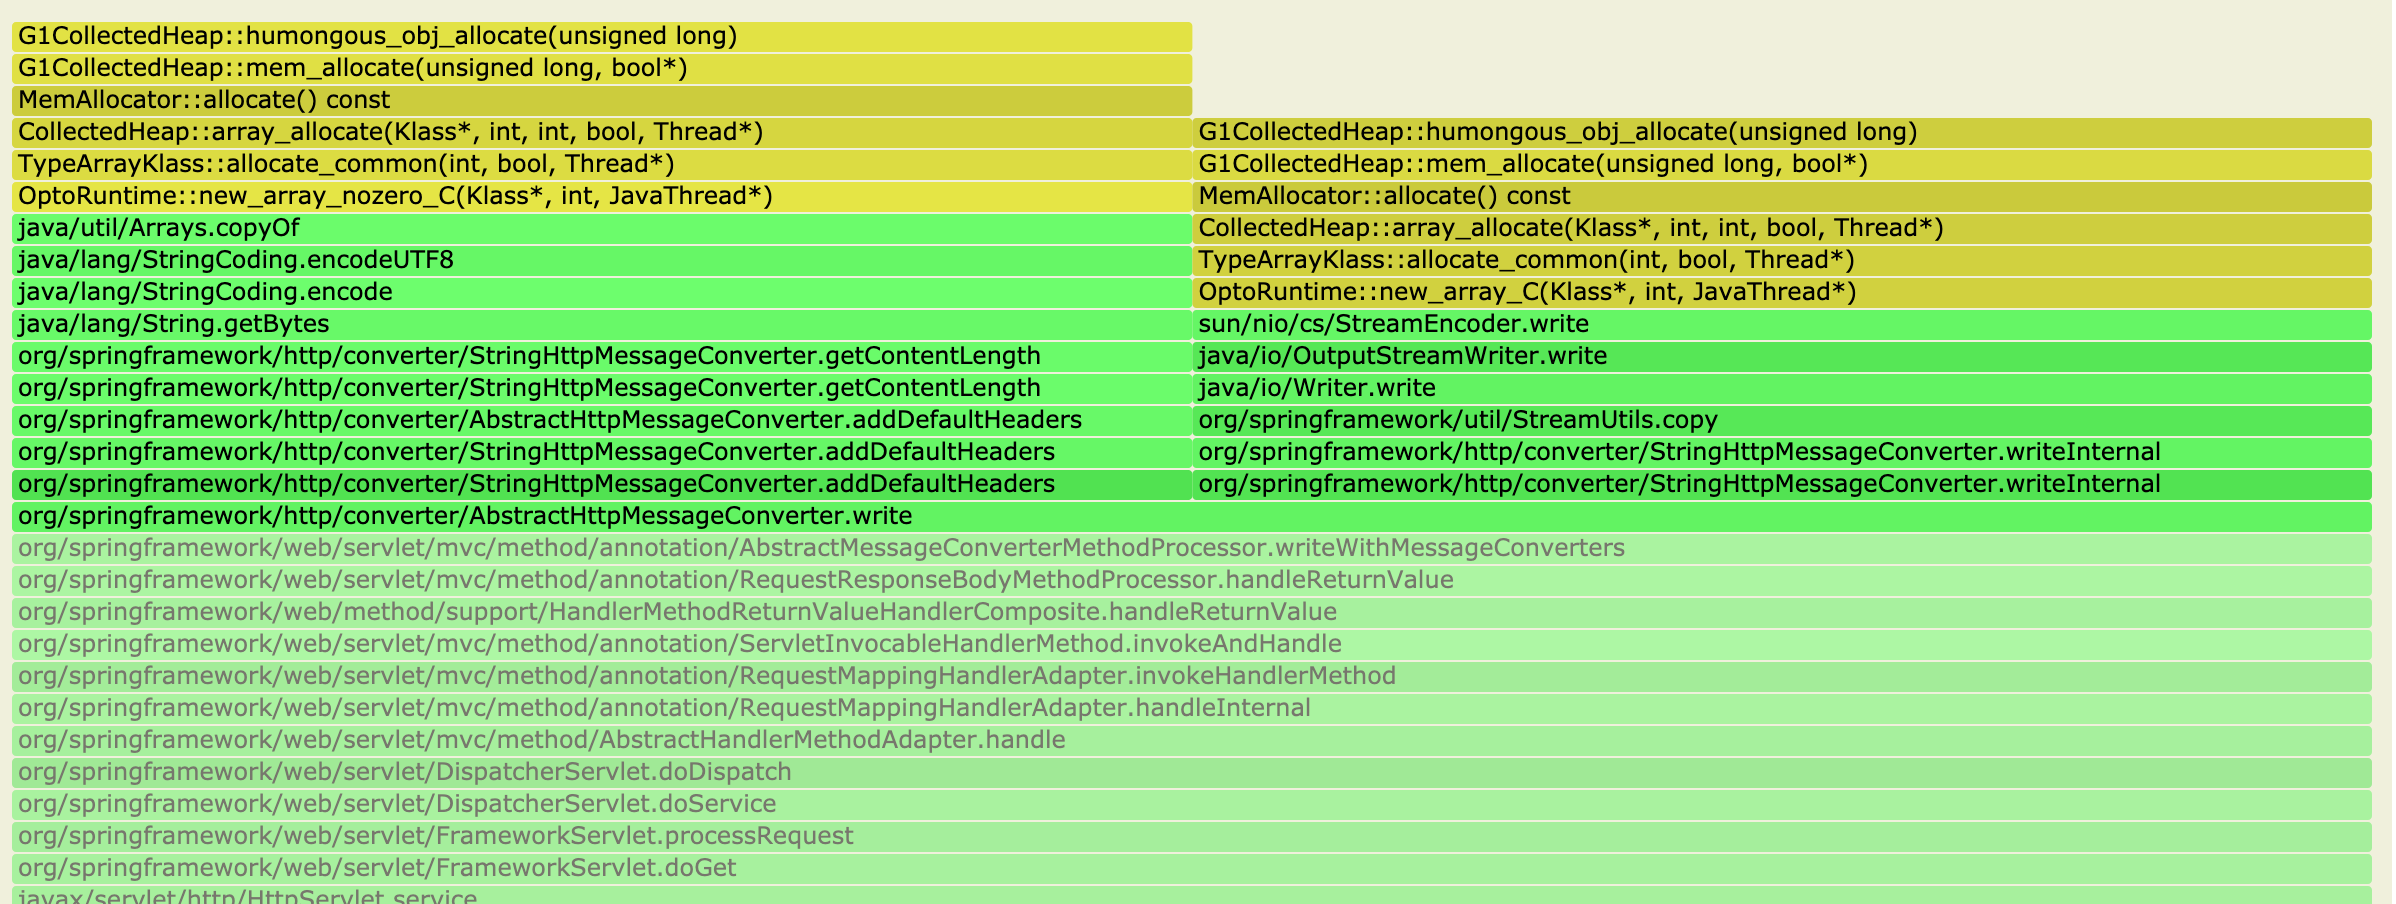
The flame graph for the Spring Framework classes doesn't look unusual - it just looks like you're trying to write a very large String instance. Could you tell us more about the size of the String (the Content-Length response header should be useful here)?
Looking at spring-projects/spring-boot#21308, and if this large allocation is directly linked to the size of the String input, I don't see how we can improve the situation in Framework.
 bclozel
on 26 Aug 2020
bclozel
on 26 Aug 2020
can you share GC logs, though? a humongous allocation triggers a _concurrent_ cycle to begin with. But the fact that you say 100ms does not make it a bad thing either, you are 50% below MaxGCPauseMillis anyway.
 wind57
on 26 Aug 2020
wind57
on 26 Aug 2020
Indeed but previous GC pauses (before the humongous allocations) were topping 50ms. This app doesn't use spring web, the only usage I see is done by the spring boot actuators. And in partuclar the prometheus one which is invoked quite often.
In the originating spring-projects/spring-boot#21308 I noticed this actuator returns a response as a String. And indeed there quite a lot of metrics in there, resulting in more than 512kiB payload (the region size is currently 1024kiB).
bric3
on 27 Aug 2020
@wind57 Indeed after looking at the gc logs, the long pauses may be related to something else. Thanks for pointing to the concurrent start !
This log is 18 mins but should be enough to peek around. If more data is needed, I can provide more.
bric3
on 27 Aug 2020
@bric3 so first things first. concurrent cycle is indeed triggered first, but a concurrent cycle in G1 also triggers a young collection (or it can trigger a mixed/full collection, which is somehow worse), more details here:
https://hg.openjdk.java.net/jdk/jdk13/file/0368f3a073a9/src/hotspot/share/gc/g1/g1Policy.cpp#l553
the log that you shared shows zero Full GCs, which you should be proud (happy?) of, imho.
From what I see, you have only two reasons for young GC there:
Pause Young (Normal) (G1 Evacuation Pause)
- Pause Young (Concurrent Start) (G1 Humongous Allocation)
Both are pretty normal.
I was looking into the size of young regions and seeing they are so big, I was very much expecting that "Remembered Sets" scanning would eat the majority of your time - but it was a false alarm.
So your ~ 100ms in each pause are taken all the time by the minor collections. There are three things you can try:
increase the numbers of threads that will do the evacuation; after all, since this is a STW event, you might benefit from such an increase. But you do need a lot more cores to see an effect.
play around with
UseAdaptiveSizePolicy... The explanation is here (disclaimer : it's me talking to myself there :) )I would also most probably try to narrow
MaxGCPauseMillisdown. WhenUseAdaptiveSizePolicyis _on_, this will trigger to re-calculate the size of young regions, on each cycle. So, if you make that value smaller - you might get more frequent young calls (since there will be less regions), but they will take less time.
Overall, what are you doing that you are un-happy about ~ 100ms slowdown? I do work for a product that cares about this too, but we use Shenandoah 2.0, not G1.
wind57
on 27 Aug 2020
@wind57 Sorry for the lack of answer, I have a personnal situation that came up. I'll come back on the topic in a couple of weeks. Thank you for your help and comments, I appreciate it a lot.
bric3
on 3 Sep 2020
@wind57 Thanks for the suggestions, I tweaked the gc logs a bit quite sometime before the humongous allocation patterns appeared.
      value: >-
        -Xms3g -Xmx3g
        -Xlog:gc*=debug,gc+ergo*=trace,gc+age*=trace,safepoint*,os*:file=/gclogs/%t-gc2.log:uptime,tags,level:filecount=10,filesize=20M
        -XX:+UseG1GC
        -XX:+UseStringDeduplication
        -XX:+UnlockExperimentalVMOptions
        -XX:G1NewSizePercent=60
        -XX:G1MaxNewSizePercent=70
        -XX:G1MixedGCCountTarget=4
        -XX:InitiatingHeapOccupancyPercent=15
        -XX:MetaspaceSize=164m
        -XX:+AlwaysPreTouch
Previous, before tweaking the GC parameters, I noticed that object were collected to old prematurely, and once object were in old they seems to accumulate there while they shouldn't (the log didn't show no mixed collection happened).
This application receives a lot of HTTP request and the bakend calls have varying latencies, from single digit millis seconds, and unfortunately some others ranging the single digit second. For the shortest calls ie. thos under 50ms I'd like to avoid adding 100ms cost (40 to 50 is ok). This application barely have caches.
Some of the request create objects that may survive a few collections, then end up dead. So I had to tweak the _ihop_ in order to trigger mixed collection to avoid accumulating object that are dead in the old regions. At some point some of these obects could reference DirectByteBuffers so they need to be cleaned in order to release memory.
And the application workload is handling _medium_ lived objects of the requests, the new size had be tweaked as well to allow more room for new objects, hoping they will be mostly collected during a regular G1 evacuation pause.
Not that with 70%, and with the default 10% reserve, I'm hoping to have 20% of old maximum which should be well enough for this application (with a 3gb heap).
- increase the numbers of threads that will do the evacuation; after all, since this is a STW event, you might benefit from such an increase. But you do need a lot more cores to see an effect.
Actually has 2048 shares, so roughly 2 cores. And the ParallelGCThreads value is already 2.
- play around with
UseAdaptiveSizePolicy... The explanation is here (disclaimer : it's me talking to myself there :) )
Yes but that's the _ratio_ of regions that should be new. By the way very good article I din't know about the region heuristics in the current GC cycle !
- I would also most probably try to narrow
MaxGCPauseMillisdown. WhenUseAdaptiveSizePolicyis on, this will trigger to re-calculate the size of young regions, on each cycle. So, if you make that value smaller - you might get more frequent young calls (since there will be less regions), but they will take less time.
I don't think Young collections, cycle has to work on all Eden regions anyway. But I'd like to try lower the max pause, previsouly it didn't work very well during startup, because the GC was occuring too frequently while the app had to initialize everything, not even accounting C2, but that was before I changed the initial new size.
In the SO link I noticed the title indicate this log configuation -Xlog:gc*=debug, but you may be interested by the tenuring distribution gc+age*=trace. Hence my logging config -Xlog:gc*=debug,gc+ergo*=trace,gc+age*=trace.
I wrote a long article on unified logging with some GC related config https://blog.arkey.fr/2020/07/28/embracing-jvm-unified-logging-jep-158-jep-271/#_migrating_the_gc_log_configuration_jep_271
bric3
on 15 Sep 2020
@bric3 Your last comment seems to be unrelated to the issue here, besides that the 100ms pauses might be linked to some other parts of your application or GC configuration. Could we circle back on the StringHttpMessageConverter?
Do you have an idea about the size of the String provided to the converter? Is there something we can do here in Spring Framework to improve the situation?
bclozel
on 15 Sep 2020
@bclozel Yes I wrote about the size paylod in a comment above https://github.com/spring-projects/spring-framework/issues/25645#issuecomment-681969859. Sorry for the noise I know you have to look at a lot of tickets to handle.
In the originating spring-projects/spring-boot#21308 I noticed this actuator returns a response as a String. And indeed there quite a lot of metrics in there, resulting in more than 512KiB payload (the region size is currently 1024KiB).
Maybe this could be fixed on the spring-boot end, if the prometheus actuator avoids change its usage of StringWriter to a stream based response.
bric3
on 15 Sep 2020
I can't think of anything we could improve here in Spring Framework. We're basically creating a writer with the response output and writing the incoming String to it.
At that point, the allocation is already done (even if further allocation can be done by OutputStreamWriter). I think improving the approach in Spring Boot is the best course of action.
Feel free to reopen this issue if you've got ideas about possible StringHttpMessageConverter improvements.
bclozel
on 15 Sep 2020
@bclozel OK makes sense ! Of course I was thinking about avoiding the big allocation when talking about removing the usage of StringWriter.
Thank you for the feedback.
bric3
on 15 Sep 2020
@bric3
Actually has 2048 shares, so roughly 2 cores
The _shares_ make sense only when you think in perspective; i.e.: you know all _other_ shares too. You can't say 2048 == 2 cores (unless you truly know that this is the case, if so, I apologize).
Yes but that's the ratio of regions that should be new
I am confused here, to be honest. After a certain GC cycle, the heap can shrink, and there could be less regions after that - less space; this is what UseAdaptiveSizePolicy does. May be I am missing your point here...
I don't think Young collections, cycle has to work on all Eden regions anyway.
It does. A young collection acts on all Eden regions. As a matter of fact - _it has no choice_, the explanation (somehow convoluted) has to do with remembered sets and some history of how G1 came to life. But the bottom line is that a young GC cycle will perform its actions on _all_ Eden Regions.
This is crazy. Your article is in my favorites tab since day 1 when I found it! What a small world...
wind57
on 17 Sep 2020
Related issues
 antonalechnovic
·
4Comments
antonalechnovic
·
4Comments
 spring-projects-issues
·
5Comments
spring-projects-issues
·
5Comments
 sdeleuze
·
3Comments
sdeleuze
·
3Comments
 davidjgoss
·
4Comments
spring-projects-issues
·
3Comments
davidjgoss
·
4Comments
spring-projects-issues
·
3Comments