Sponge: PhaseTracker vs BlockVolumeWorker - Requesting improvements
I am currently running
- SpongeForge version: stable-7 exact commit
- Java version: 1.8.0_231
- Operating System: Win 10
I am trying to move around 60,000 blocks including their tile entities and having to use BlockSnapshot and it's method restore(), this accounts for 52% of my block moving code's runtime. Most of which are calls to the PhaseTracker.
People have suggested using a BlockWorker, however, they do not handle the tile entities and I cannot find a way to move them separately.
Would it be possible to optimise the PhaseTracker or implement a TileEntityVolumeWorker with the ability to place BlockStates and TileEntity at the same time?
 Pulverizer
All 13 comments
There is little to nothing to go on to substantiate your claims and therefore allow us to try to understand your performance problems. Please put more effort into telling us as much as possible.
SpongeForge version: stable-7
That's not a version. We need to know what version you're using at this moment. stable-7 changes over time.
Java version: 8
I don't think this is going to matter, but run java --version and tell us what you're running. 8 is a large target.
I am trying to move around 60,000 blocks ...
In a tick? Presuming you have the whole tick to play with, so 50ms, each block is given about 800ns to process. That's ignoring all other processes. So, you're probably looking at 500ns per block + tile entity. Is that viable? _Possibly_, if you had _nothing_ else on the server. Throw mods in and you've got no chance. So, there is some merit in asking yourself whether you can seriously split some of the process up over multiple ticks. I think you said in Discord that it's taking about 150ms already.
I have to say that what you're asking for is erring on unrealistic in the way that it is currently being done. Lots of processing, lots of data so I suspect there will be a lot of swapping in and out of CPU caches. I suspect some of it is down to not being able to bulk change blocks/tile entities (I understand why) and so a lot of processing is likely happening individually.
Be that as it may...
...including their tile entities and having to use BlockSnapshot and it's method restore(), this accounts for 52% of my block moving code's runtime.
So... what are you running? Plugins, mods? Processor specs? RAM? Every piece of information counts here. 52% to you might not be 52% on my machine, depending on what I have running.
Further, how did you measure this? Have you got a copy of the profiler dump you could share? Is the other 48% your code, or is there something else we might need to look at?
Most of which is calls to the PhaseTracker.
Is most of the time _in_ those calls, or in sub calls that take it back out of the tracker? Is there an event which is being called which is slowing it down measurably? Is it calls to restore the block in the world?
I doubt it's the tracker itself.
Would it be possible to optimise the PhaseTracker
@gabizou already puts an insane amount of time into optimising the tracker. I should know as I've tried to sanity check it.
or implement a TileEntityVolumeWorker with the ability to place BlockStates and TileEntity at the same time?
Can you create and restore a Schematic in a different place?
 dualspiral
on 26 Feb 2020
dualspiral
on 26 Feb 2020
There is little to nothing to go on to substantiate your claims and therefore allow us to try to understand your performance problems. Please put more effort into telling us as much as possible.
Versions updated to be more exact.
I am trying to move around 60,000 blocks ...
In a tick? Presuming you have the whole tick to play with, so 50ms, each block is given about 800ns to process. That's ignoring all other processes. So, you're probably looking at 500ns per block + tile entity. Is that viable? _Possibly_, if you had _nothing_ else on the server. Throw mods in and you've got no chance. So, there is some merit in asking yourself whether you can seriously split some of the process up over multiple ticks. I think you said in Discord that it's taking about 150ms already.
Yep, in a single tick. Ticks can be allowed to run over, it is expected. However, I have seen this sort of performance with the Bukkit version of my plugin.
I have to say that what you're asking for is erring on unrealistic in the way that it is currently being done. Lots of processing, lots of data so I suspect there will be a lot of swapping in and out of CPU caches. I suspect some of it is down to not being able to bulk change blocks/tile entities (I understand why) and so a lot of processing is likely happening individually.
Be that as it may...
...including their tile entities and having to use BlockSnapshot and it's method restore(), this accounts for 52% of my block moving code's runtime.
So... what are you running? Plugins, mods? Processor specs? RAM? Every piece of information counts here. 52% to you might not be 52% on my machine, depending on what I have running.
Stable-7 decompWorkspace with the in-dev version of my plugin.
CPU: Ryzen 7 2700X @ 4.2Ghz
RAM: 16GB @ 3400Mhz
What else would help? I'm still new to this.
Further, how did you measure this? Have you got a copy of the profiler dump you could share? Is the other 48% your code, or is there something else we might need to look at?
I've never used a profiler before so it was guesswork to understand as much as I did.
JProfiler via IntelliJ plugin. I found my method call and saw how bad it was and then looked at how much was caused by calls it made. The BlockSnapshot#restore() calls took up 52%. The three calls to the PhaseTracker within that took about 20% each.
I would have to run it again to get a dump I think?
Most of which is calls to the PhaseTracker.
Is most of the time _in_ those calls, or in sub calls that take it back out of the tracker? Is there an event which is being called which is slowing it down measurably? Is it calls to restore the block in the world?
I doubt it's the tracker itself.
Guess I'll need to run it again. I can discuss live results via a Discord call if it helps.
Would it be possible to optimise the PhaseTracker
@gabizou already puts an insane amount of time into optimising the tracker. I should know as I've tried to sanity check it.
I know, Gabizou is amazing. ❤️
or implement a TileEntityVolumeWorker with the ability to place BlockStates and TileEntity at the same time?
Can you create and restore a
Schematicin a different place?
Is there somewhere that explains how to do this?
Pulverizer
on 26 Feb 2020

Pulverizer
on 27 Feb 2020
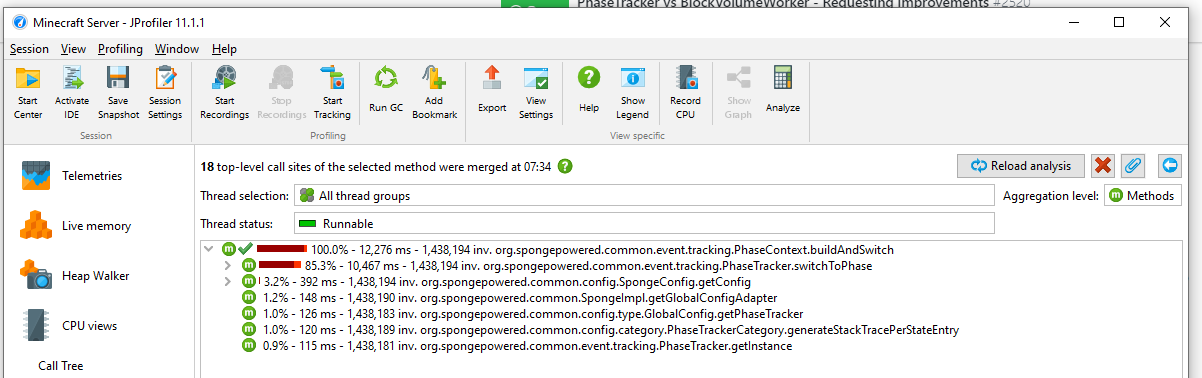
Instead of screenshots, could you send the full profiling file? Otherwise, here's a very descriptive explanation of thoughts on your findings.
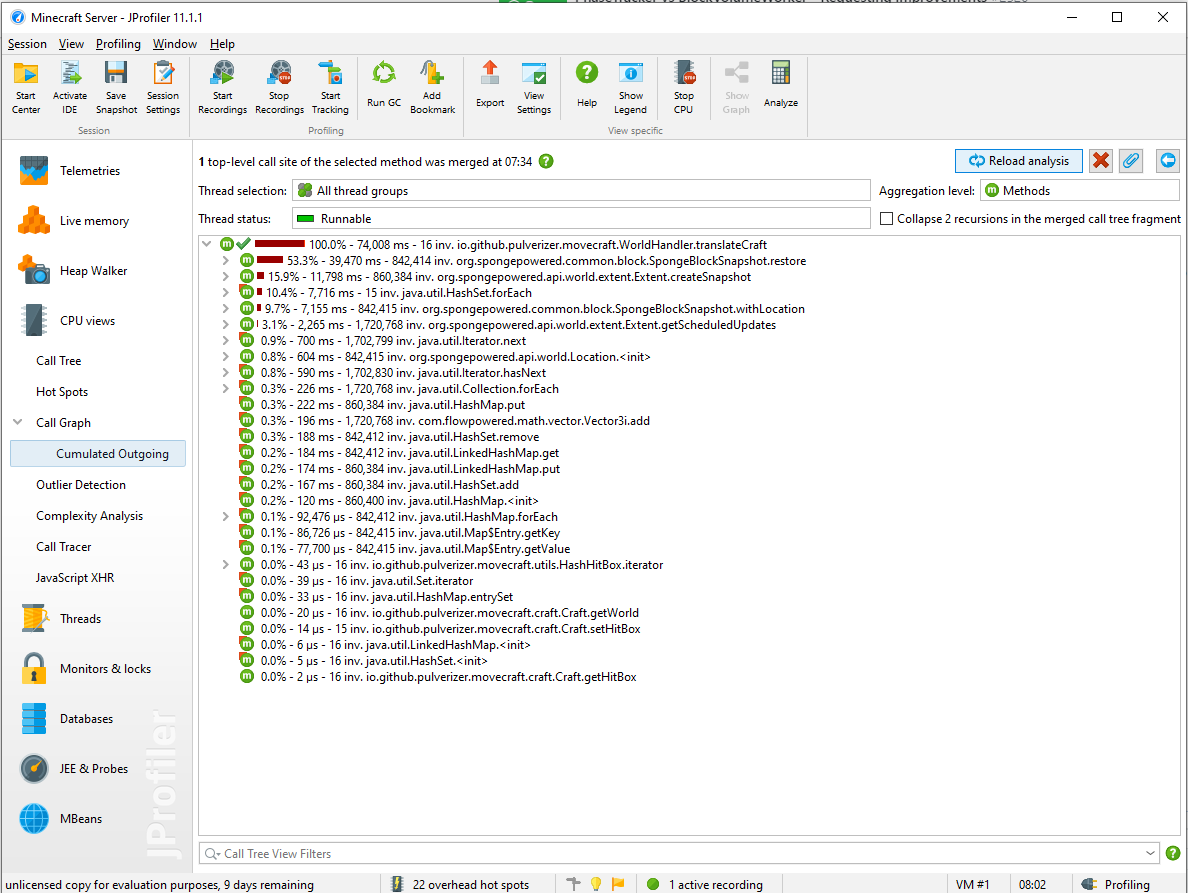
Screenshot showing 842,414
SpongeBlockSnapshot.restore()called taking 39,470ms total
You do realize this is the root of your problem, as we've said before in discord, it'd be far more efficient to make Schematics (pro tip: you only have to update the schematic if the aircraft is being damaged) and "place" those by moving them. Restoring snapshots individually is expensive because of the number of times you're doing it.
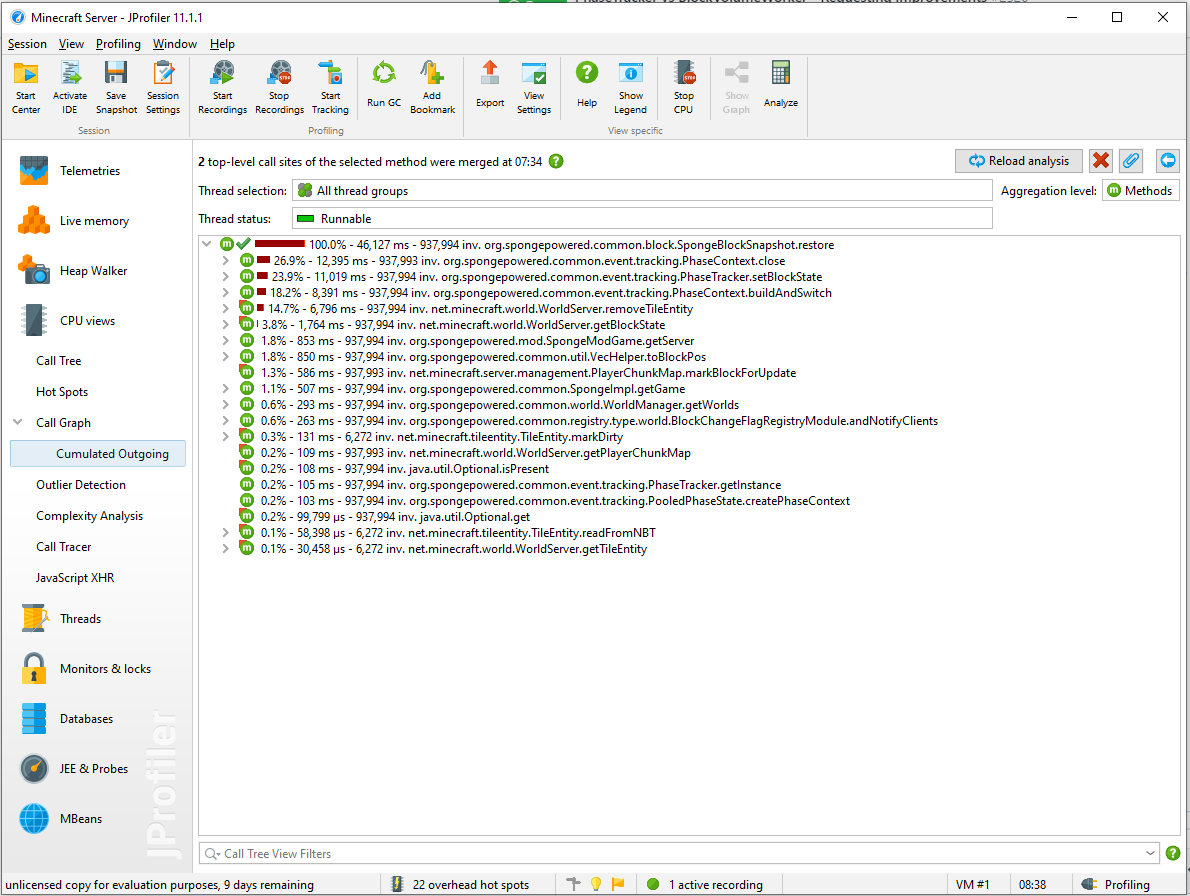
Screenshot showing practically useless information of
PhaseContext.close(),PhaseTracker.setBlockState(),PhaseTracker.buildAndSwitch(), andWorldServer.removeTileEntityall being called 937,994 times (minus a few for some cases)
This is why restoring snapshots is cheap for small counts, but you're effectively wasting a lot of processing all over by restoring snapshots individually.
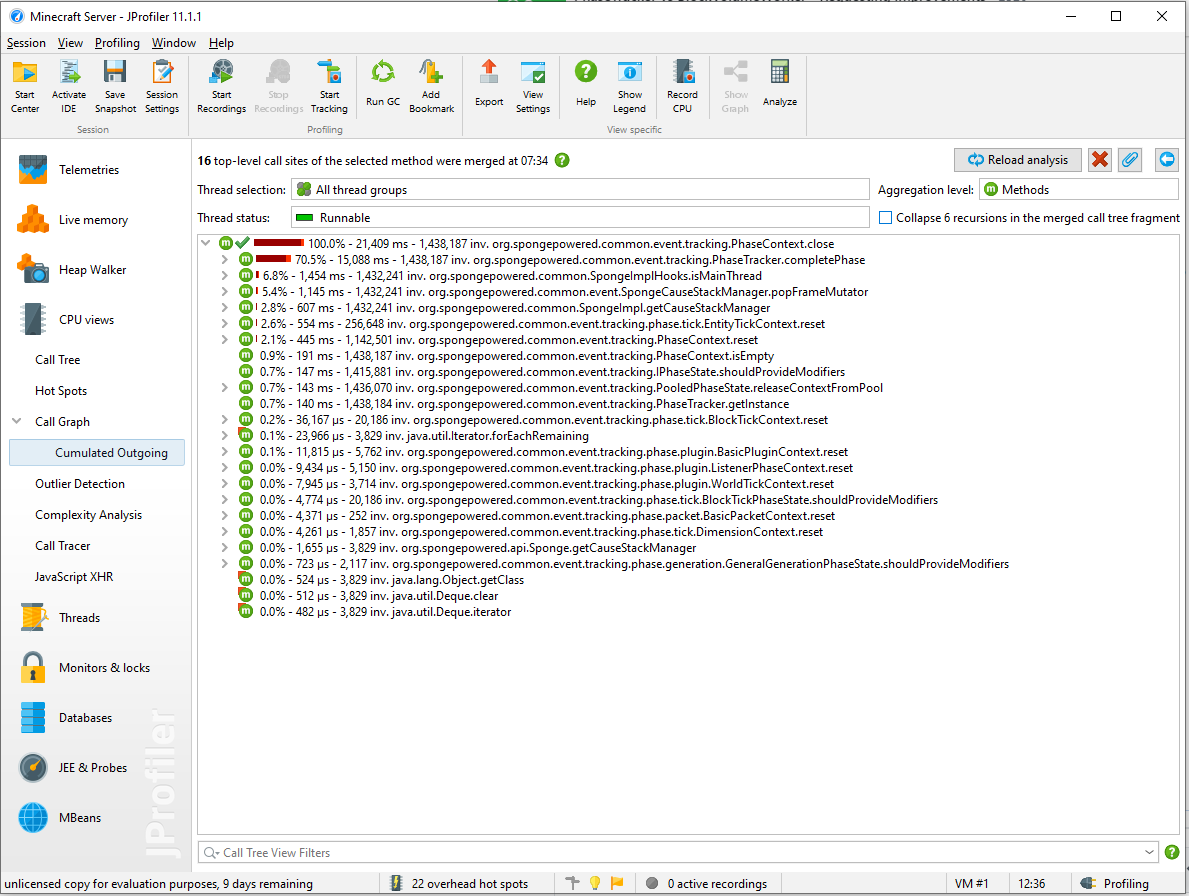
Screenshot showing
PhaseContext.close()nested withPhaseTracker.completePhase()taking 15,088 ms for 1,438,187 calls
Yeah, imagine if this was called maybe a quarter the amount, but you really don't understand what it's doing there because completePhase() is a wildcard of "Ok, let's process captures, neighbor notification requests, and block physics."
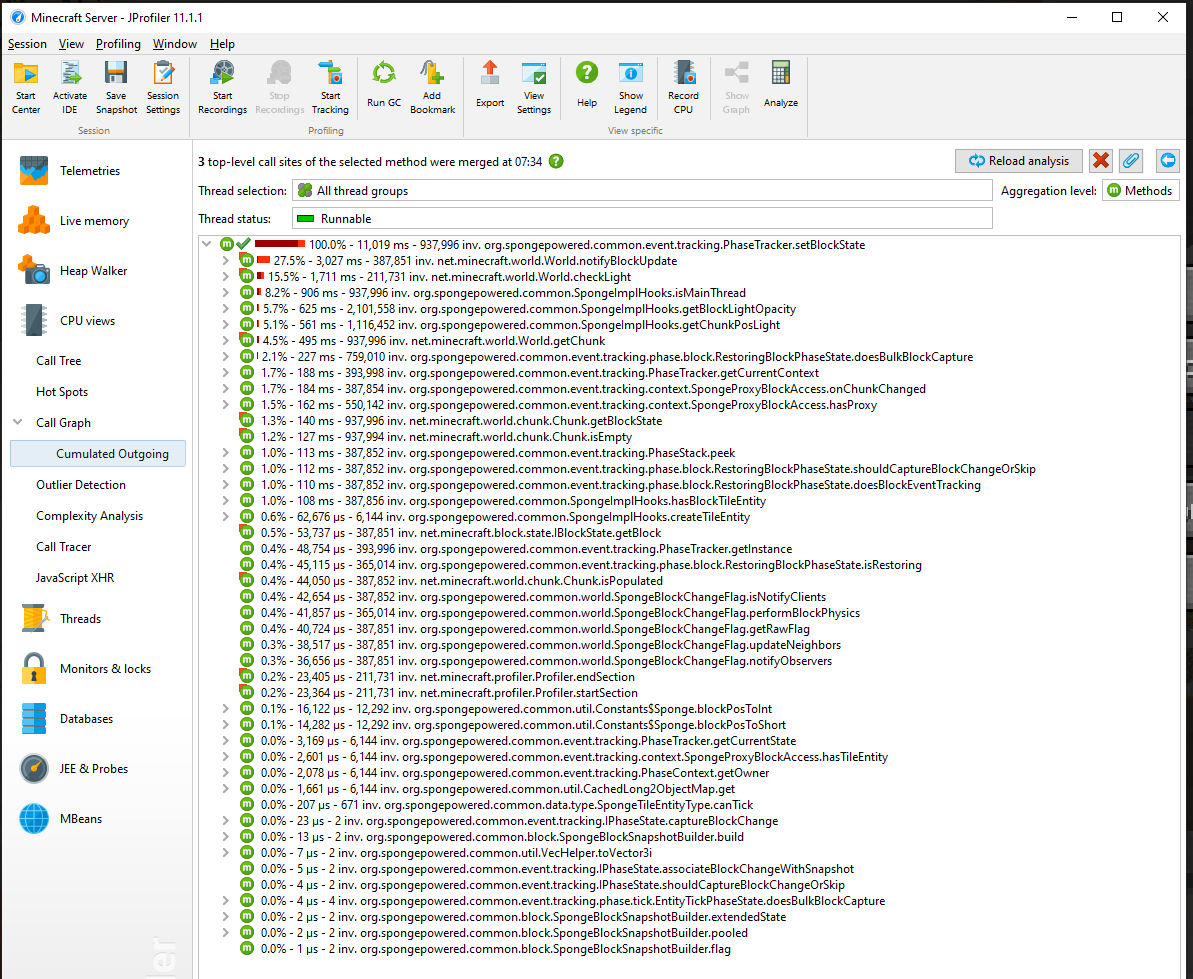
Screenshot showing
PhaseTracker.setBlockState()withWorld.notifyBlockUpdatebeing called 387,851 times taking 3,027ms andWorld.checkLight()called 211,731 times taking 1,711ms and some other proxied methods likeisMainThreadandgetBlockLightOpacityuntil finally the only realPhaseTrackermethod that shows up isRestoringBlockPhaseState.doesBulkBlockCapturebeing called 759,010 times taking 227ms and then goes on with other stupid fast methods
Yeah, this means nothing because all of the block changes perpetuates a required notification to clients and light scheduled updates to where the Sponge relevant code bits are in the nanosecond ranges (which guess what, there's a reason why 227ms / 759,010 is roughly 300 nanoseconds, it's to do with the lack of precision of the JVM and computer clocks, you can read more on that here). Overall, the n amount of blocks changing will always incur a constant cost of at least the notification/lighting portion of MC's code.
Taking a step back
I am trying to move around 60,000 blocks including their tile entities and having to use BlockSnapshot and it's method restore(), this accounts for 52% of my block moving code's runtime. Most of which are calls to the PhaseTracker.
This is the most glaring issue of all, you've made no consideration of actually seeing "what are the costs" of moving that many blocks. You did one step to look into some of the methods and nested methods of those costs, and the circumstances are such that you didn't quite explore exactly how much each individual method costs and why. Only in the second to last screenshot do you show that in PhaseTracker.setBlockState is the vanilla MC code (top 6 time consuming methods in that screenshot) is accounting for 66% of the cost already, and those calls are significantly less than some of the similar calls to Sponge's own code.
Even when we consider that PhaseTracker.setBlockState is at this point a wrapper around the vanilla method, you're not really understanding how the PhaseTracker really functions, let alone how MC really functions with performing block changes. Part of the problem that you're grazing past is the screenshot of PhaseContext.close(), you didn't show what is nested within the completePhase() portion, and maybe you might've noticed it if you did look at it, but I'll give you a one sentence explanation: PhaseTracker.completePhase() is the wrapper around every single PhaseContext.close() and applying any and all captures, notifications, events, and post processing. In easier to understand ways: If you have 1,234,567,890 PhaseContext.buildAndSwitch()s, you'll have 1,234,567,890 PhaseContext.close()s and equally (almost always) PhaseTracker.completePhase()s.
Ok, so what? Why can't you optimize the PhaseTracker? I just want to move thousands of blocks...
To try and optimize the PhaseTracker, you have to understand how the logic works for block changes: A block change takes place and clients are notified, lighting is queued for an update, and neighboring blocks are notified through method call. This last one is where a lot of people don't understand that this is the actual cost of processing thousands of block changes. Each block change necessitates calling world.notifyNeighborOfStateChange() for each of the 6 neighboring blocks even if the block is air, and this is bordering on how the notification logic makes Redstone machines work. To optimize this, you'd be reinventing a system to improve nested notifications and propagation logic that can happen with block physics (Redstone wire updates it's neighbors on an update, and it's neighboring wires update their neighbors) to where it's doing an exhaustive depth-first iteration of chaining. So, the more complicated the blocks themselves that you're moving, the potentially more complicated (and countable) block notifications are going to be performed. The PhaseTracker simply acts as an arbiter of saying "ok, you want to do xyzzy, but we're restoring blocks, so you can't do xyzzy." so it "Saves time" a lot of the times by making those checks (like the 759,010 calls to RestoringBlockState.doesBulkBlockCapture) and avoiding other costlier calls.
To keep continuing
People have suggested using a BlockWorker, however, they do not handle the tile entities and I cannot find a way to move them separately.
Don't use block workers if you're going to avoid all the block physics or you already have a whole volume of blocks (like an ArchetypeVolume), it's not that you're going to run into the same problem, but you're effectively replicating a similar issue.
Would it be possible to optimise the PhaseTracker or implement a TileEntityVolumeWorker with the ability to place BlockStates and TileEntity at the same time?
Remember in one of your screenshots that there's thousands of calls to World.removeTileEntity during the block changes? That's because a block removal still has to be called, and then the new block has to potentially place a new TileEntity by creating them. The better solution is to use a Schematic or ArchetypeVolume. Both of which are demonstrated here in the CopyPasta plugin.
In summary
- Profilers only tell half the story if you aren't investigating the full breath of what is costing time in a method call.
- Thinking of time only and not the amount of calls for the time spent is one sided because of profiling skewed results down to the 300ns restriction
- Just like a sorting algorithm, there's multiple ways to move thousands of blocks, but the way you chose is very time consuming and wastes a lot of compute cycles (and
PhaseContexts) when there's better ways to solve the problem - Seriously consider the limit of just how much optimization can be done on the game, let alone Sponge's code when you want to throw around a stupid amount of block changes, there's possible ways to optimize the
PhaseTracker's various bits, but nothing that is actually coming out from this - Don't just share screenshots of a profiling result, it's damn near useless.
I'm gonna close this as a support discussion because it's not worth any amount of time to speculate where some optimizations could be done when you consider that a lot of the Sponge code is executing at the native nanosecond timeframe, or wrapping around vanilla functions that are reimplemented in Sponge methods.
 gabizou
on 28 Feb 2020
gabizou
on 28 Feb 2020
Thanks, Gabizou, it's been helpful. I've tried to give Profiler results but, as I've said, I'm new to it and don't really know what I'm doing. I'll study the schematic code and try implementing it. In regards to whether 60k blocks in less than 50ms is possible in Sponge, IDK, but I have seen it done in about 10ms using Bukkit, so I still have hope.
Pulverizer
on 28 Feb 2020
Okay, so thanks to the code you linked I finally figured out how to use the ArchetypeVolume.
Unfortunately, in my attempts ArchetypeVolume#apply() increases the processing time by almost 100%. (reworked my code) offers no performance increase and does not invalidate the old tile entities.
Pulverizer
on 28 Feb 2020
@gabizou ArchetypeVolume#apply() just wraps World#setBlock() for the block replacement, leading to the same amount of PhaseTracker calls.
Pulverizer
on 29 Feb 2020
I did some editing to my local Sponge code if having a single set of calls to the PhaseTracker improved much. Processing time was reduced from 330ms to 200ms (peak) and 160ms (avg).
Pulverizer
on 1 Mar 2020
In regards to whether 60k blocks in less than 50ms is possible in Sponge, IDK, but I have seen it done in about 10ms using Bukkit, so I still have hope.
This is dependent on how they're being set, just saying that it's being set tells me nothing of what systems are in place, whether the setting of blocks bypasses all events in CraftBukkit, whether it's using raw NMS, or worse, setting the blocks in the chunk array directly.
Unfortunately, in my attempts ArchetypeVolume#apply() ~increases the processing time by almost 100%.~ (reworked my code) offers no performance increase and does not invalidate the old tile entities.
So that might be from profiler bias, but I'm fairly sure there should be fewer physics changes overall if you're using the right flags (BlockChangeFlags.NONE) which would drastically reduce the amount of calls all around within the block worker.
@gabizou ArchetypeVolume#apply() just wraps World#setBlock() for the block replacement, leading to the same amount of PhaseTracker calls.
Again, don't conflate the amount of World.setBlock to the processing going on behind the scenes, there might be some lost handling from some refactoring in the past that might've increased the tracker's phase entry, but by no means should it be actually switching into a new PhaseContext for every block.
I did some editing to my local Sponge code if having a single set of calls to the PhaseTracker improved much.
I don't know what this means.
does not invalidate the old tile entities.
Right, because that's not what applying a schematic will do. Nothing about emptying the existing volume area is being considered when applying a schematic/archetype volume. No where does the API contract say it will remove existing blocks before applying the archetype.
gabizou
on 3 Mar 2020
In regards to whether 60k blocks in less than 50ms is possible in Sponge, IDK, but I have seen it done in about 10ms using Bukkit, so I still have hope.
This is dependent on _how_ they're being set, just saying that it's being set tells me nothing of what systems are in place, whether the setting of blocks bypasses all events in CraftBukkit, whether it's using raw NMS, or worse, setting the blocks in the chunk array directly.
I will look into it. However, I simply meant that I wasn't going to give up.
Unfortunately, in my attempts ArchetypeVolume#apply() ~increases the processing time by almost 100%.~ (reworked my code) offers no performance increase and does not invalidate the old tile entities.
So that might be from profiler bias, but I'm fairly sure there should be fewer physics changes overall if you're using the right flags (
BlockChangeFlags.NONE) which would drastically reduce the amount of calls all around within the block worker.
I was using that flag before. I stopped using the profiler I fell back to the timer my plugin uses to give the player information. It records processing time by fetching the system time at the start of translating the craft and comparing it to the system time when it has finished. It isn't as accurate but still enough to notice any major improvements. eg. a change of more than 20ms.
@gabizou ArchetypeVolume#apply() just wraps World#setBlock() for the block replacement, leading to the same amount of PhaseTracker calls.
Again, don't conflate the amount of
World.setBlockto the processing going on behind the scenes, there might be some lost handling from some refactoring in the past that might've increased the tracker's phase entry, but by no means should it be actually switching into a newPhaseContextfor every block.I did some editing to my local Sponge code if having a single set of calls to the PhaseTracker improved much.
I don't know what this means.
I edited my local decompWorkspace copy of Sponge. It reduced the time my plugin recorded by about 100ms. Feel free to correct me if I am misusing the PhaseTracker calls: Gist
does not invalidate the old tile entities.
Right, because that's not what applying a schematic will do. Nothing about emptying the existing volume area is being considered when applying a schematic/archetype volume. No where does the API contract say it will remove existing blocks before applying the archetype.
This isn't part of the optimisation discussion if it's not meant to. However, I can't seem to find a method to invalidate the tile entities. This causes the tile entities to drop their contents as if broken by a player.
Pulverizer
on 3 Mar 2020
@gabizou Are my changes to Sponge correct? If so, should I look doing more changes (if possible) to optimise block placement?
Is there anything else I should be considering?
Pulverizer
on 23 Mar 2020
@Pulverizer We cannot see what those changes are easily because you've just posted your class with no signposting as to what has changed.
If you want us to look at them, at this stage, post a diff (use gif diff on your workspace).
dualspiral
on 23 Mar 2020
Sorry, the link is supposed to go to the method I added. And that only seems to say which files I've edited?
Pulverizer
on 23 Mar 2020
Related issues
 Rasgnarok
·
4Comments
Rasgnarok
·
4Comments
 JoeSGT
·
5Comments
JoeSGT
·
5Comments
 Grinch
·
4Comments
Grinch
·
4Comments
 Eufranio
·
4Comments
Eufranio
·
4Comments
 Xemiru
·
3Comments
Xemiru
·
3Comments
Most helpful comment
Instead of screenshots, could you send the full profiling file? Otherwise, here's a very descriptive explanation of thoughts on your findings.
You do realize this is the root of your problem, as we've said before in discord, it'd be far more efficient to make
Schematics (pro tip: you only have to update the schematic if the aircraft is being damaged) and "place" those by moving them. Restoring snapshots individually is expensive because of the number of times you're doing it.This is why restoring snapshots is cheap for small counts, but you're effectively wasting a lot of processing all over by restoring snapshots individually.
Yeah, imagine if this was called maybe a quarter the amount, but you really don't understand what it's doing there because
completePhase()is a wildcard of "Ok, let's process captures, neighbor notification requests, and block physics."Yeah, this means nothing because all of the block changes perpetuates a required notification to clients and light scheduled updates to where the Sponge relevant code bits are in the nanosecond ranges (which guess what, there's a reason why 227ms / 759,010 is roughly 300 nanoseconds, it's to do with the lack of precision of the JVM and computer clocks, you can read more on that here). Overall, the n amount of blocks changing will always incur a constant cost of at least the notification/lighting portion of MC's code.
Taking a step back
This is the most glaring issue of all, you've made no consideration of actually seeing "what are the costs" of moving that many blocks. You did one step to look into some of the methods and nested methods of those costs, and the circumstances are such that you didn't quite explore exactly how much each individual method costs and why. Only in the second to last screenshot do you show that in
PhaseTracker.setBlockStateis the vanilla MC code (top 6 time consuming methods in that screenshot) is accounting for 66% of the cost already, and those calls are significantly less than some of the similar calls to Sponge's own code.Even when we consider that
PhaseTracker.setBlockStateis at this point a wrapper around the vanilla method, you're not really understanding how thePhaseTrackerreally functions, let alone how MC really functions with performing block changes. Part of the problem that you're grazing past is the screenshot ofPhaseContext.close(), you didn't show what is nested within thecompletePhase()portion, and maybe you might've noticed it if you did look at it, but I'll give you a one sentence explanation:PhaseTracker.completePhase()is the wrapper around every singlePhaseContext.close()and applying any and all captures, notifications, events, and post processing. In easier to understand ways: If you have 1,234,567,890PhaseContext.buildAndSwitch()s, you'll have 1,234,567,890PhaseContext.close()s and equally (almost always)PhaseTracker.completePhase()s.Ok, so what? Why can't you optimize the
PhaseTracker? I just want to move thousands of blocks...To try and optimize the
PhaseTracker, you have to understand how the logic works for block changes: A block change takes place and clients are notified, lighting is queued for an update, and neighboring blocks are notified through method call. This last one is where a lot of people don't understand that this is the actual cost of processing thousands of block changes. Each block change necessitates callingworld.notifyNeighborOfStateChange()for each of the 6 neighboring blocks even if the block is air, and this is bordering on how the notification logic makes Redstone machines work. To optimize this, you'd be reinventing a system to improve nested notifications and propagation logic that can happen with block physics (Redstone wire updates it's neighbors on an update, and it's neighboring wires update their neighbors) to where it's doing an exhaustive depth-first iteration of chaining. So, the more complicated the blocks themselves that you're moving, the potentially more complicated (and countable) block notifications are going to be performed. ThePhaseTrackersimply acts as an arbiter of saying "ok, you want to do xyzzy, but we're restoring blocks, so you can't do xyzzy." so it "Saves time" a lot of the times by making those checks (like the759,010calls toRestoringBlockState.doesBulkBlockCapture) and avoiding other costlier calls.To keep continuing
Don't use block workers if you're going to avoid all the block physics or you already have a whole volume of blocks (like an
ArchetypeVolume), it's not that you're going to run into the same problem, but you're effectively replicating a similar issue.Remember in one of your screenshots that there's thousands of calls to
World.removeTileEntityduring the block changes? That's because a block removal still has to be called, and then the new block has to potentially place a newTileEntityby creating them. The better solution is to use aSchematicorArchetypeVolume. Both of which are demonstrated here in the CopyPasta plugin.In summary
PhaseContexts) when there's better ways to solve the problemPhaseTracker's various bits, but nothing that is actually coming out from thisI'm gonna close this as a support discussion because it's not worth any amount of time to speculate where some optimizations could be done when you consider that a lot of the Sponge code is executing at the native nanosecond timeframe, or wrapping around vanilla functions that are reimplemented in Sponge methods.