Splunk-connect-for-kubernetes: Splunk-connect consuming lot of API Server resources | 98% of the API connections are consumed by Fluentd
Hello Team,
We were using splunk-connect 1.0.1 and it was fine. Now we have upgraded to splunk-connect 1.4.0 and it exponentially increased number of API connections. We see 2 issues in our clusters due to this:
API Server is very busy processing these API calls and its consuming lot of resources even with less workload in the cluster.
We have enabled audit logging which is filled up very quickly and 98% of the events are from Splunk pods.
We need to see why fluentd consuming these many connections and resources. We understand it uses watch API but how we can minimize the consumption ?
What happened:
As Above consuming CPU and Memory resources along with Disk space for audit logs.
What you expected to happen:
We expected to happen this smooth without much stress on API server
How to reproduce it (as minimally and precisely as possible):
Install splunk-connect 1.4.0 with Openshift 3.11.x / Docker enterprise v1.14 version.
Anything else we need to know?:
Environment:
- Kubernetes version (use
kubectl version):v1.14.8 - Ruby version (use
ruby --version): - OS (e.g:
cat /etc/os-release): CentOS 7.7 - Splunk version: 7.x
- Others:
 dengalebr
All 17 comments
Hello Team,
I also observed the same issue with 1.4.0. Both API server and the logging pods are consuming more resources. I tried to delete the looging pods and when they were recreated, the CPU usage came down for both API server and logging pod. But after sometime the usage goes up again.
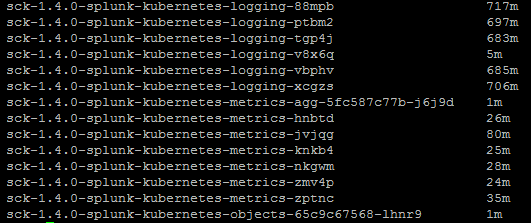
@dengalebr Did you also observe the cpu usage increase in the logging pods?
Environment:
Kubernetes version (use kubectl version): 1.15.4
OS (e.g: cat /etc/os-release): Ubuntu 18.04.2 LTS
Splunk version: 8.0.1
SCK Version - 1.4.0
 johnr84
on 25 Mar 2020
johnr84
on 25 Mar 2020
@johnr84 what is your cluster topology and specs?
1.4 added annotation support and metadata in logging stream, these all require more traffic to the APISERVERs. Using more resources doesn't really mean much when compared to a previous version as that could be for a few reasons....I guess what it comes down to is whether it uses too much resources for whats in your cluster....are you seeing issues in the cluster?
Also interesting you point out initial spike which is expected as we build the meta cache on each node and fire up watches on all your stuff....
Can you share any metrics or analysis from your environment, either here or via a support ticket please?
 matthewmodestino
on 25 Mar 2020
matthewmodestino
on 25 Mar 2020
@dengalebr as we will chat about later, this can be a little misleading if you are comparing to to apps in a cluster that dont rely on apiserver, or if the expectation in your environment is a certain number of requests and all of a sudden you double it......to track all the resources in a cluster....we are going to require resources. So we look forward to having a look with you and getting information as to whether the collector is running clean and as expected by the eng team.
In previous versions we made a conscious effort to NOT rely on the apiserver in the logging pod, and instead used the objects pod for polling meta and enrichment.
Overwhelmingly in the cloud native community and with OSS customers, they liked to constantly point at the fact we didn't add meta to log stream as something we lacked. ( which is technically false, we just chose to enrich with Splunk search tech, not the ingest side. see objects pods and automatic lookups) Hence, the features that allow more native k8s management and experience are now here, and with it come new normals. funny considering the times around us :).
So, are you seeing cluster degradation? I know this can result from apiservers being overwhelmed, so we'd love to work with red hat on what exact guidance there is around utilization of your master layer and ensure the caching that we use is optimized and that the outcomes are worth the resource for you.
Splunk app for infra still deploys 1.2 so you can still use 1.2 and 1.3 features as we continue to receive feedback. Look forward to looking closer with you!
matthewmodestino
on 25 Mar 2020
@matthewmodestino
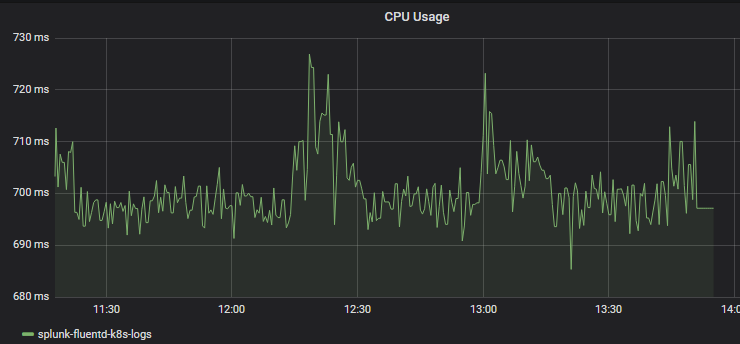
We use annotation to disable monitoring of most of the NS except kube-system and another project NS(Which has only one pod). As I mentioned above, I again deleted the pods that had high cpu usage..
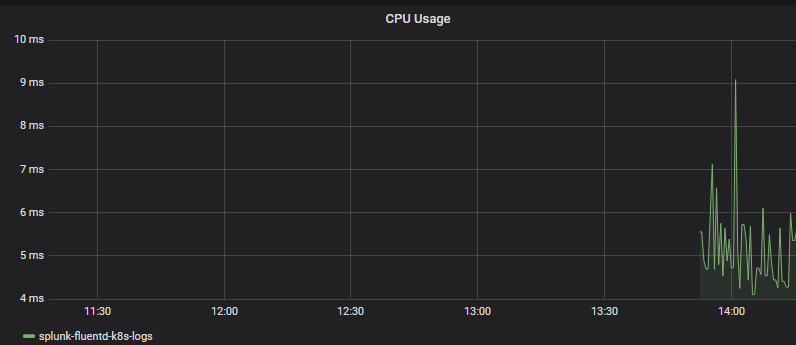
Immediately they were re-created and the usage is way too less now(700m to 5m) as you can see in the below screenshot. API server usage also came down from 1300m to 30-40m.

API Server usage - Before and after logging pod restart

Before Deletion - Logging Agent
After Recreation - Logging Agent
johnr84
on 25 Mar 2020
right, but what about your apiserver pods, etcd? your nodes?
100% constraining monitoring to certain namespaces will help reduce impact, but if you run it wide open, which some folks defintely do, i think it'll show up or be more of a shock.
I am very interested to see what happens in public managed clouds where users dont care about masters :)
matthewmodestino
on 25 Mar 2020
We are also seeing this occur, every few days the CPU utilisation on the control plane nodes (api server) inceases to 100%. Restarting the splunk-connect logging pods resolves this issue for another few days.
During the period of hi api-server usage the audit logs indicate a large number of repeated queries to /api/v1/watch/pods?fieldSelector=spec.nodeName%3Dus-prod-kubewrk-001.atl01.example.org&resourceVersion=78464987 for each worker node (6). These requests appear to be being made at a rate of approximately 1600 r/min on each api node (3).
 mgherman
on 25 Mar 2020
mgherman
on 25 Mar 2020
Thanks @mgherman! This is what @dengalebr and I saw as well. Can you try and track down that node and see if there is containers with high churn or high rate of change? We're trying to see why we would see such a crazy rate.
If you run the objects pod we can correlate audit to kube:objects:events or kube:objects:pods
matthewmodestino
on 25 Mar 2020
Yes, we run the objects pod. It has been running for ~7 days.
$ kubectl -n logging get po
NAME                                                        READY   STATUS    RESTARTS   AGE
splunk-connect-splunk-kubernetes-logging-4mpsp              1/1     Running   0          164m
splunk-connect-splunk-kubernetes-logging-b6gss              1/1     Running   0          164m
splunk-connect-splunk-kubernetes-logging-p6tbb              1/1     Running   0          164m
splunk-connect-splunk-kubernetes-logging-r557q              1/1     Running   0          164m
splunk-connect-splunk-kubernetes-logging-s99sn              1/1     Running   0          164m
splunk-connect-splunk-kubernetes-logging-sr6pj              1/1     Running   0          164m
splunk-connect-splunk-kubernetes-objects-6679c4c786-zq2px   1/1     Running   0          6d16h
mgherman
on 25 Mar 2020
Sweet, it collects the resourceid that you are seeing, it should lead us to a pod and or namespace and I’d love to know if it is shortlived or has dynamic config, etc.
Also, we can look at the logging pod info logs where there are cache stats. Also any other errors or interesting logs from the logging pod output?
matthewmodestino
on 25 Mar 2020
Hi Matthew,
I don't see anything in the objects pod logs, however in each of the logging pods, the behaviour appears to be the same. It occurred again a few hours ago in response to a short-lived HPA autoscale from 2 -> 10 pods (pods were scaled down after approximately 10 minutes). And on each of the nodes, at differing times (within an 18 minutes window) we see a dramatic and continual increase in the number of pod_cache_watch_ignored events.
A snipped of one of the logs:
2020-03-29 16:00:17 +0000 [info]: #0 stats - namespace_cache_size: 5, pod_cache_size: 19, namespace_cache_api_updates: 554, pod_cache_api_updates: 556, id_cache_miss: 554, pod_cache_watch_delete_ignored: 211, pod_cache_watch_updates: 1972, pod_cache_watch_ignored: 213, pod_cache_host_updates: 1
2020-03-29 16:00:47 +0000 [info]: #0 stats - namespace_cache_size: 5, pod_cache_size: 19, namespace_cache_api_updates: 555, pod_cache_api_updates: 557, id_cache_miss: 555, pod_cache_watch_delete_ignored: 211, pod_cache_watch_updates: 1972, pod_cache_watch_ignored: 213, pod_cache_host_updates: 1
2020-03-29 16:01:17 +0000 [info]: #0 stats - namespace_cache_size: 5, pod_cache_size: 19, namespace_cache_api_updates: 555, pod_cache_api_updates: 557, id_cache_miss: 555, pod_cache_watch_delete_ignored: 211, pod_cache_watch_updates: 1972, pod_cache_watch_ignored: 213
2020-03-29 16:01:47 +0000 [info]: #0 stats - namespace_cache_size: 5, pod_cache_size: 20, pod_cache_watch_updates: 1973, pod_cache_host_updates: 1, pod_cache_watch_ignored: 214, namespace_cache_api_updates: 555, pod_cache_api_updates: 557, id_cache_miss: 555, pod_cache_watch_delete_ignored: 211
2020-03-29 16:01:48 +0000 [info]: #0 [containers.log] following tail of /var/log/containers/notification-r2020031601-7cdfb97d-consumers-8d9498bd9-2gxmp_rosi_configbuilder-61f33300a1b6832e7250ba428c11703f9440476bd1eea98b7e64ef9eccd89704.log
2020-03-29 16:01:48 +0000 [info]: #0 disable filter chain optimization because [Fluent::Plugin::KubernetesMetadataFilter, Fluent::Plugin::RecordTransformerFilter] uses `#filter_stream` method.
2020-03-29 16:01:48 +0000 [info]: #0 [containers.log] following tail of /var/log/containers/notification-r2020031601-7cdfb97d-consumers-8d9498bd9-2gxmp_rosi_istio-init-9c44a6421b21724b5cbab1792d38da25a432905900a69c275320633f670b4ecc.log
2020-03-29 16:01:48 +0000 [info]: #0 disable filter chain optimization because [Fluent::Plugin::KubernetesMetadataFilter, Fluent::Plugin::RecordTransformerFilter] uses `#filter_stream` method.
2020-03-29 16:02:17 +0000 [info]: #0 stats - namespace_cache_size: 5, pod_cache_size: 20, pod_cache_watch_updates: 1977, namespace_cache_api_updates: 557, pod_cache_api_updates: 559, id_cache_miss: 557, pod_cache_host_updates: 1, pod_cache_watch_ignored: 214, pod_cache_watch_delete_ignored: 211
2020-03-29 16:02:47 +0000 [info]: #0 stats - namespace_cache_size: 5, pod_cache_size: 20, namespace_cache_api_updates: 559, pod_cache_api_updates: 561, id_cache_miss: 559, pod_cache_watch_updates: 1977, pod_cache_host_updates: 1, pod_cache_watch_ignored: 214, pod_cache_watch_delete_ignored: 211
2020-03-29 16:02:48 +0000 [info]: #0 [containers.log] following tail of /var/log/containers/notification-r2020031601-7cdfb97d-consumers-8d9498bd9-2gxmp_rosi_istio-proxy-015ab8a2d1c32df39883321152038d09870abd00095e500f01e65516486001f2.log
2020-03-29 16:02:48 +0000 [info]: #0 disable filter chain optimization because [Fluent::Plugin::KubernetesMetadataFilter, Fluent::Plugin::RecordTransformerFilter] uses `#filter_stream` method.
2020-03-29 16:02:48 +0000 [info]: #0 [containers.log] following tail of /var/log/containers/notification-r2020031601-7cdfb97d-consumers-8d9498bd9-2gxmp_rosi_rosi-consumer-819db3bd31ac26a7d1e3e6667f1decdf34b7301fda3482472608a889701b2814.log
2020-03-29 16:02:48 +0000 [info]: #0 disable filter chain optimization because [Fluent::Plugin::KubernetesMetadataFilter, Fluent::Plugin::RecordTransformerFilter] uses `#filter_stream` method.
2020-03-29 16:03:17 +0000 [info]: #0 stats - namespace_cache_size: 5, pod_cache_size: 20, namespace_cache_api_updates: 561, pod_cache_api_updates: 563, id_cache_miss: 561, pod_cache_watch_updates: 1977, pod_cache_host_updates: 1, pod_cache_watch_ignored: 214, pod_cache_watch_delete_ignored: 211
2020-03-29 16:03:47 +0000 [info]: #0 stats - namespace_cache_size: 5, pod_cache_size: 20, namespace_cache_api_updates: 561, pod_cache_api_updates: 563, id_cache_miss: 561, pod_cache_watch_updates: 1977, pod_cache_host_updates: 1, pod_cache_watch_ignored: 214, pod_cache_watch_delete_ignored: 211
2020-03-29 16:04:17 +0000 [info]: #0 stats - namespace_cache_size: 5, pod_cache_size: 20, namespace_cache_api_updates: 561, pod_cache_api_updates: 563, id_cache_miss: 561, pod_cache_watch_updates: 1977, pod_cache_host_updates: 1, pod_cache_watch_ignored: 214, pod_cache_watch_delete_ignored: 211
2020-03-29 16:04:47 +0000 [info]: #0 stats - namespace_cache_size: 5, pod_cache_size: 20, namespace_cache_api_updates: 561, pod_cache_api_updates: 563, id_cache_miss: 561, pod_cache_watch_updates: 1977, pod_cache_host_updates: 1, pod_cache_watch_ignored: 214, pod_cache_watch_delete_ignored: 211
2020-03-29 16:05:17 +0000 [info]: #0 stats - namespace_cache_size: 5, pod_cache_size: 20, namespace_cache_api_updates: 561, pod_cache_api_updates: 563, id_cache_miss: 561, pod_cache_watch_updates: 1977, pod_cache_host_updates: 1, pod_cache_watch_ignored: 214, pod_cache_watch_delete_ignored: 211
2020-03-29 16:05:47 +0000 [info]: #0 stats - namespace_cache_size: 5, pod_cache_size: 20, namespace_cache_api_updates: 561, pod_cache_api_updates: 563, id_cache_miss: 561, pod_cache_watch_updates: 1977, pod_cache_host_updates: 1, pod_cache_watch_ignored: 214, pod_cache_watch_delete_ignored: 211
2020-03-29 16:06:17 +0000 [info]: #0 stats - namespace_cache_size: 5, pod_cache_size: 20, namespace_cache_api_updates: 561, pod_cache_api_updates: 563, id_cache_miss: 561, pod_cache_watch_updates: 1977, pod_cache_host_updates: 1, pod_cache_watch_ignored: 214, pod_cache_watch_delete_ignored: 211
2020-03-29 16:06:47 +0000 [info]: #0 stats - namespace_cache_size: 5, pod_cache_size: 20, namespace_cache_api_updates: 561, pod_cache_api_updates: 563, id_cache_miss: 561, pod_cache_watch_updates: 1977, pod_cache_host_updates: 1, pod_cache_watch_ignored: 214, pod_cache_watch_delete_ignored: 211
2020-03-29 16:07:17 +0000 [info]: #0 stats - namespace_cache_size: 5, pod_cache_size: 20, namespace_cache_api_updates: 562, pod_cache_api_updates: 564, id_cache_miss: 562, pod_cache_watch_updates: 1977, pod_cache_host_updates: 1, pod_cache_watch_ignored: 214, pod_cache_watch_delete_ignored: 211
2020-03-29 16:07:47 +0000 [info]: #0 stats - namespace_cache_size: 5, pod_cache_size: 20, namespace_cache_api_updates: 562, pod_cache_api_updates: 564, id_cache_miss: 562, pod_cache_watch_updates: 1977, pod_cache_host_updates: 1, pod_cache_watch_ignored: 214, pod_cache_watch_delete_ignored: 211
2020-03-29 16:08:17 +0000 [info]: #0 stats - namespace_cache_size: 5, pod_cache_size: 20, namespace_cache_api_updates: 562, pod_cache_api_updates: 564, id_cache_miss: 562, pod_cache_watch_updates: 1977, pod_cache_host_updates: 1, pod_cache_watch_ignored: 214, pod_cache_watch_delete_ignored: 211
2020-03-29 16:08:47 +0000 [info]: #0 stats - namespace_cache_size: 5, pod_cache_size: 20, namespace_cache_api_updates: 562, pod_cache_api_updates: 564, id_cache_miss: 562, pod_cache_watch_updates: 1977, pod_cache_host_updates: 1, pod_cache_watch_ignored: 214, pod_cache_watch_delete_ignored: 211
2020-03-29 16:09:17 +0000 [info]: #0 stats - namespace_cache_size: 5, pod_cache_size: 20, namespace_cache_api_updates: 562, pod_cache_api_updates: 564, id_cache_miss: 562, pod_cache_watch_updates: 1977, pod_cache_host_updates: 1, pod_cache_watch_ignored: 214, pod_cache_watch_delete_ignored: 211
2020-03-29 16:09:47 +0000 [info]: #0 stats - namespace_cache_size: 5, pod_cache_size: 20, pod_cache_watch_updates: 1978, namespace_cache_api_updates: 562, pod_cache_api_updates: 564, id_cache_miss: 562, pod_cache_host_updates: 1, pod_cache_watch_ignored: 214, pod_cache_watch_delete_ignored: 211
2020-03-29 16:10:11 +0000 [info]: #0 [containers.log] detected rotation of /var/log/containers/notification-r2020031601-7cdfb97d-consumers-8d9498bd9-2gxmp_rosi_istio-proxy-015ab8a2d1c32df39883321152038d09870abd00095e500f01e65516486001f2.log; waiting 5 seconds
2020-03-29 16:10:11 +0000 [info]: #0 [containers.log] detected rotation of /var/log/containers/notification-r2020031601-7cdfb97d-consumers-8d9498bd9-2gxmp_rosi_rosi-consumer-819db3bd31ac26a7d1e3e6667f1decdf34b7301fda3482472608a889701b2814.log; waiting 5 seconds
2020-03-29 16:10:11 +0000 [info]: #0 [containers.log] detected rotation of /var/log/containers/notification-r2020031601-7cdfb97d-consumers-8d9498bd9-2gxmp_rosi_istio-init-9c44a6421b21724b5cbab1792d38da25a432905900a69c275320633f670b4ecc.log; waiting 5 seconds
2020-03-29 16:10:11 +0000 [info]: #0 [containers.log] detected rotation of /var/log/containers/notification-r2020031601-7cdfb97d-consumers-8d9498bd9-2gxmp_rosi_configbuilder-61f33300a1b6832e7250ba428c11703f9440476bd1eea98b7e64ef9eccd89704.log; waiting 5 seconds
2020-03-29 16:10:17 +0000 [info]: #0 stats - namespace_cache_size: 5, pod_cache_size: 20, pod_cache_watch_delete_ignored: 212, pod_cache_watch_updates: 1981, namespace_cache_api_updates: 562, pod_cache_api_updates: 564, id_cache_miss: 562, pod_cache_host_updates: 1, pod_cache_watch_ignored: 214
2020-03-29 16:10:47 +0000 [info]: #0 stats - namespace_cache_size: 5, pod_cache_size: 20, pod_cache_watch_delete_ignored: 212, pod_cache_watch_updates: 1981, namespace_cache_api_updates: 562, pod_cache_api_updates: 564, id_cache_miss: 562, pod_cache_host_updates: 1, pod_cache_watch_ignored: 214
2020-03-29 16:11:17 +0000 [info]: #0 stats - namespace_cache_size: 5, pod_cache_size: 20, namespace_cache_api_updates: 563, pod_cache_api_updates: 565, id_cache_miss: 563, pod_cache_watch_delete_ignored: 212, pod_cache_watch_updates: 1981, pod_cache_host_updates: 1, pod_cache_watch_ignored: 214
2020-03-29 16:11:47 +0000 [info]: #0 stats - namespace_cache_size: 5, pod_cache_size: 20, namespace_cache_api_updates: 563, pod_cache_api_updates: 565, id_cache_miss: 563, pod_cache_watch_delete_ignored: 212, pod_cache_watch_updates: 1981, pod_cache_host_updates: 1, pod_cache_watch_ignored: 214
2020-03-29 16:12:17 +0000 [info]: #0 stats - namespace_cache_size: 5, pod_cache_size: 20, namespace_cache_api_updates: 563, pod_cache_api_updates: 565, id_cache_miss: 563, pod_cache_watch_delete_ignored: 212, pod_cache_watch_updates: 1981, pod_cache_host_updates: 1, pod_cache_watch_ignored: 214
2020-03-29 16:12:47 +0000 [info]: #0 stats - namespace_cache_size: 5, pod_cache_size: 19, pod_cache_watch_ignored: 1012, namespace_cache_api_updates: 563, pod_cache_api_updates: 565, id_cache_miss: 563, pod_cache_watch_delete_ignored: 212, pod_cache_watch_updates: 1981, pod_cache_host_updates: 1
2020-03-29 16:13:17 +0000 [info]: #0 stats - namespace_cache_size: 5, pod_cache_size: 20, pod_cache_watch_ignored: 3467, namespace_cache_api_updates: 564, pod_cache_api_updates: 566, id_cache_miss: 564, pod_cache_watch_delete_ignored: 212, pod_cache_watch_updates: 1981, pod_cache_host_updates: 1
2020-03-29 16:13:47 +0000 [info]: #0 stats - namespace_cache_size: 5, pod_cache_size: 20, pod_cache_watch_ignored: 5909, namespace_cache_api_updates: 564, pod_cache_api_updates: 566, id_cache_miss: 564, pod_cache_watch_delete_ignored: 212, pod_cache_watch_updates: 1981, pod_cache_host_updates: 1
2020-03-29 16:14:17 +0000 [info]: #0 stats - namespace_cache_size: 5, pod_cache_size: 20, pod_cache_watch_ignored: 8385, namespace_cache_api_updates: 564, pod_cache_api_updates: 566, id_cache_miss: 564, pod_cache_watch_delete_ignored: 212, pod_cache_watch_updates: 1981, pod_cache_host_updates: 1
2020-03-29 16:14:47 +0000 [info]: #0 stats - namespace_cache_size: 5, pod_cache_size: 11, pod_cache_watch_ignored: 10844, namespace_cache_api_updates: 564, pod_cache_api_updates: 566, id_cache_miss: 564, pod_cache_watch_delete_ignored: 212, pod_cache_watch_updates: 1981, pod_cache_host_updates: 1
2020-03-29 16:15:17 +0000 [info]: #0 stats - namespace_cache_size: 5, pod_cache_size: 9, pod_cache_watch_ignored: 13287, namespace_cache_api_updates: 565, pod_cache_api_updates: 567, id_cache_miss: 565, pod_cache_watch_delete_ignored: 212, pod_cache_watch_updates: 1981, pod_cache_host_updates: 1
2020-03-29 16:15:47 +0000 [info]: #0 stats - namespace_cache_size: 5, pod_cache_size: 11, pod_cache_watch_ignored: 15734, namespace_cache_api_updates: 567, pod_cache_api_updates: 569, id_cache_miss: 567, pod_cache_watch_delete_ignored: 212, pod_cache_watch_updates: 1981, pod_cache_host_updates: 1
2020-03-29 16:16:17 +0000 [info]: #0 stats - namespace_cache_size: 5, pod_cache_size: 11, pod_cache_watch_ignored: 17983, namespace_cache_api_updates: 567, pod_cache_api_updates: 569, id_cache_miss: 567, pod_cache_watch_delete_ignored: 212, pod_cache_watch_updates: 1981, pod_cache_host_updates: 1
2020-03-29 16:16:47 +0000 [info]: #0 stats - namespace_cache_size: 5, pod_cache_size: 11, pod_cache_watch_ignored: 20241, namespace_cache_api_updates: 567, pod_cache_api_updates: 569, id_cache_miss: 567, pod_cache_watch_delete_ignored: 212, pod_cache_watch_updates: 1981, pod_cache_host_updates: 1
2020-03-29 16:17:17 +0000 [info]: #0 stats - namespace_cache_size: 5, pod_cache_size: 11, pod_cache_watch_ignored: 22226, namespace_cache_api_updates: 567, pod_cache_api_updates: 569, id_cache_miss: 567, pod_cache_watch_delete_ignored: 212, pod_cache_watch_updates: 1981, pod_cache_host_updates: 1
2020-03-29 16:17:47 +0000 [info]: #0 stats - namespace_cache_size: 5, pod_cache_size: 11, pod_cache_watch_ignored: 24136, namespace_cache_api_updates: 567, pod_cache_api_updates: 569, id_cache_miss: 567, pod_cache_watch_delete_ignored: 212, pod_cache_watch_updates: 1981, pod_cache_host_updates: 1
mgherman
on 29 Mar 2020
https://github.com/fabric8io/fluent-plugin-kubernetes_metadata_filter/issues/224
Probably worth trying the downgrade meta filter to 2.4.1 or trying 2.4.5, or waiting until 2.4.6 i guess?
matthewmodestino
on 29 Mar 2020
some action on the metadata filter repo points to this pull as the fix for cpu consumption, explains some of the watcher/resource version behaviour.
https://github.com/fabric8io/fluent-plugin-kubernetes_metadata_filter/pull/214
I am testing a logging pod with 2.4.5 version of metadata plugin. If anyone on this issue is willing to try a new container build hit me up on splunk slack (splk.it/slack) in the #kubernetes room. @mattymo
matthewmodestino
on 7 Apr 2020
Thank you very much @matthewmodestino for the updated image with metadata filter 2.4.5: https://hub.docker.com/layers/rock1017/fluentd-hec/test2/images/sha256-7646bff44bbc71182f4c78b25f8aee32bdb72053531b4ec08fa69d2a33f0653d?context=explore
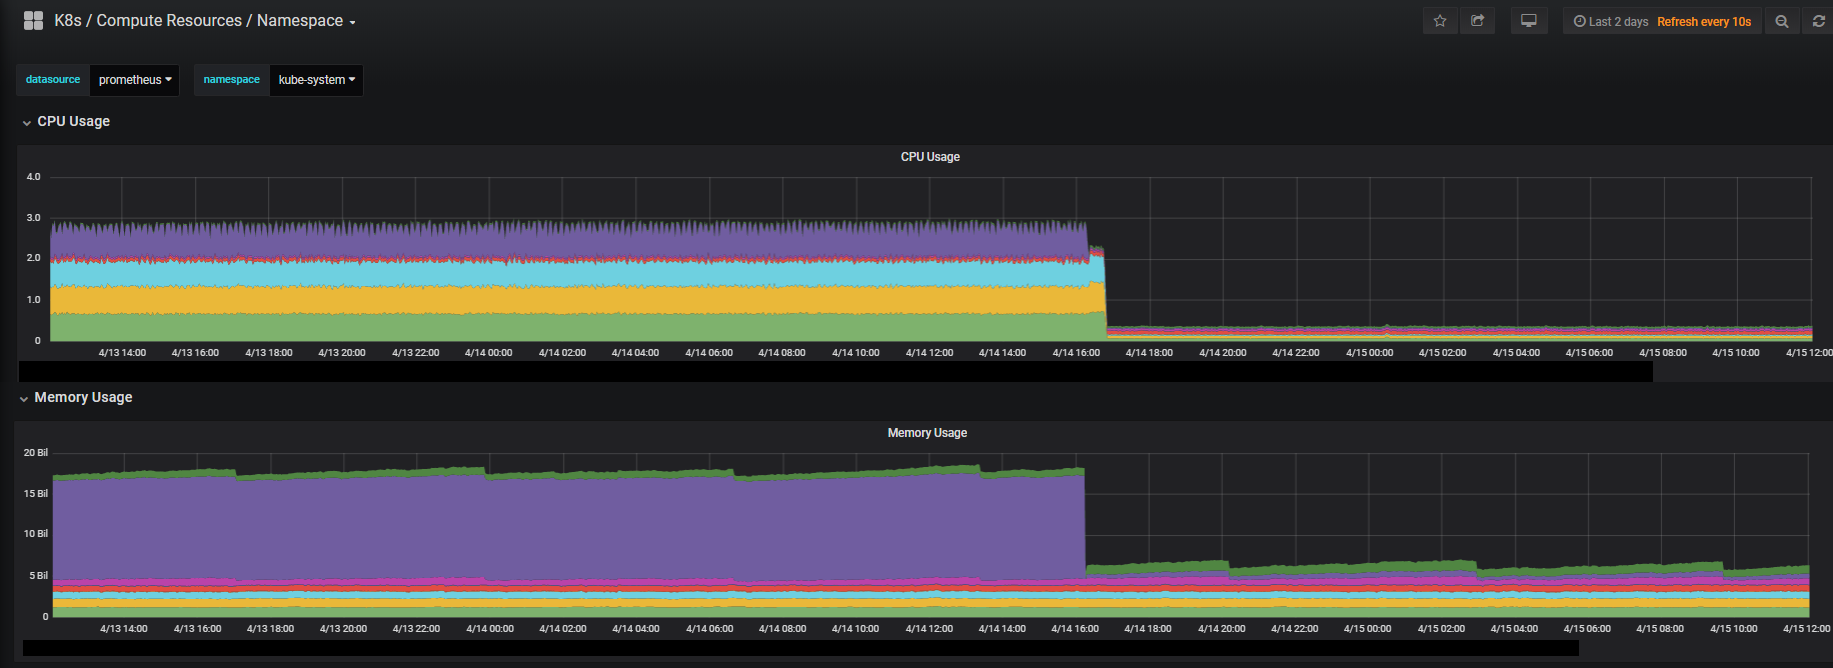
I deployed it yesterday and the load on the master nodes (api and etcd pods) decreased immediately (see screenshot).
We have SCK running in on our project cluster only. We will do some more tests before we go to production.
Our project cluster has following dimensions:
8 nodes:
3x compute each: 8 cores, 50 GB RAM
3x master each: 4 cores, 20 GB RAM
2x infra each: 4 cores, 16GB RAM
And we are currently only forwarding the logs of two projects/namespaces to Splunk. But we had high load even with this setup before the updated version of the filter plugin.
Again many thanks to @matthewmodestino. Would be great if you could update the filter plugin in the official image as well asap.
 crdnb
on 15 Apr 2020
crdnb
on 15 Apr 2020
Hey all 1.4.1 has been released! get yer testin on!
matthewmodestino
on 1 May 2020
Thanks @matthewmodestino for all help. We will surly try this.
dengalebr
on 1 May 2020
Thanks @matthewmodestino - it's working very well now!
crdnb
on 7 May 2020
Thank you! Closing
 rockb1017
on 21 May 2020
rockb1017
on 21 May 2020
Related issues
 beth2016
·
6Comments
beth2016
·
6Comments
 Joerg-L
·
9Comments
Joerg-L
·
9Comments
 rfrodrigues16
·
10Comments
rfrodrigues16
·
10Comments
 lindsjan
·
7Comments
lindsjan
·
7Comments
 tioumen
·
8Comments
tioumen
·
8Comments