Splunk-connect-for-kubernetes: kubernetes metrics is taking invalid sourcetype=httpevent
Logs are updating as below. splunk connect for kubernetes is not able to pick the sourcetype.
6/1/194:21:25.349 AM metric
6/1/194:21:25.349 AM metric
6/1/194:21:25.349 AM metric
6/1/194:21:25.349 AM metric
6/1/194:21:25.349 AM metric
We have downloaded the code and configured as below.
Only changes we made:
In configMap.yaml, lines 210/211 changed HEC Host and Port
In secret.yaml, changed hec token to base64 encode.
 Ramesh5a7
All 12 comments
Hi Ramesh!
The Metrics pods require a metrics index and should be searched with Splunk Metrics Workspace - https://splunkbase.splunk.com/app/4192/ - or mstats commands. They do not send logs/events in the traditional Splunk sense. What version of Splunk are you using?
https://github.com/splunk/splunk-connect-for-kubernetes#before-you-begin
The metric daemonset (metrics pods) and deployment (metric-agg pod) should be sending to a metric index, and you can control the sourcetype in the configmaps - https://github.com/splunk/splunk-connect-for-kubernetes/blob/77dd8967a19162b96c63267666116cb25f2249f5/manifests/splunk-kubernetes-metrics/configMap.yaml#L53-L75 - or by setting a default on your hec token, or using props/transforms.
FYI - Here is the spec for the fluent-hec plugin. You can stamp the sourcetype in here. Doesn't look like the current charts do.
https://github.com/splunk/fluent-plugin-splunk-hec#parameters
 matthewmodestino
on 3 Jun 2019
matthewmodestino
on 3 Jun 2019
Hi Matthew,
I am using splunk enterprise 7.1.2
I have created metrics index index="kubernetes_metrics"
Ramesh5a7
on 3 Jun 2019
Perfect. How are you searching them?
matthewmodestino
on 3 Jun 2019
index="kubernetes_metrics"
Ramesh5a7
on 3 Jun 2019
| mcatalog values(metric_name) AS metric_name WHERE index=kubernetes_metrics by host, source, sourcetype
Does this return info for you?
Splunk metrics use mstats or mcatalog commands, but you should really just install the metric workspace app!

https://docs.splunk.com/Documentation/Splunk/7.2.6/Metrics/Overview
https://docs.splunk.com/Documentation/Splunk/7.2.6/SearchReference/Mstats
https://docs.splunk.com/Documentation/Splunk/7.2.6/SearchReference/Mcatalog
https://splunkbase.splunk.com/app/4192/
matthewmodestino
on 3 Jun 2019
I have installed metric workspace app!
when i opened the metrics tab i see 500 internal server error.

Ramesh5a7
on 3 Jun 2019
Restart Splunk.
matthewmodestino
on 3 Jun 2019
Restarted. now i am able to open metrics page. i have selected time picker last 30 days.... still it is showing blank and no metrics.

Ramesh5a7
on 3 Jun 2019
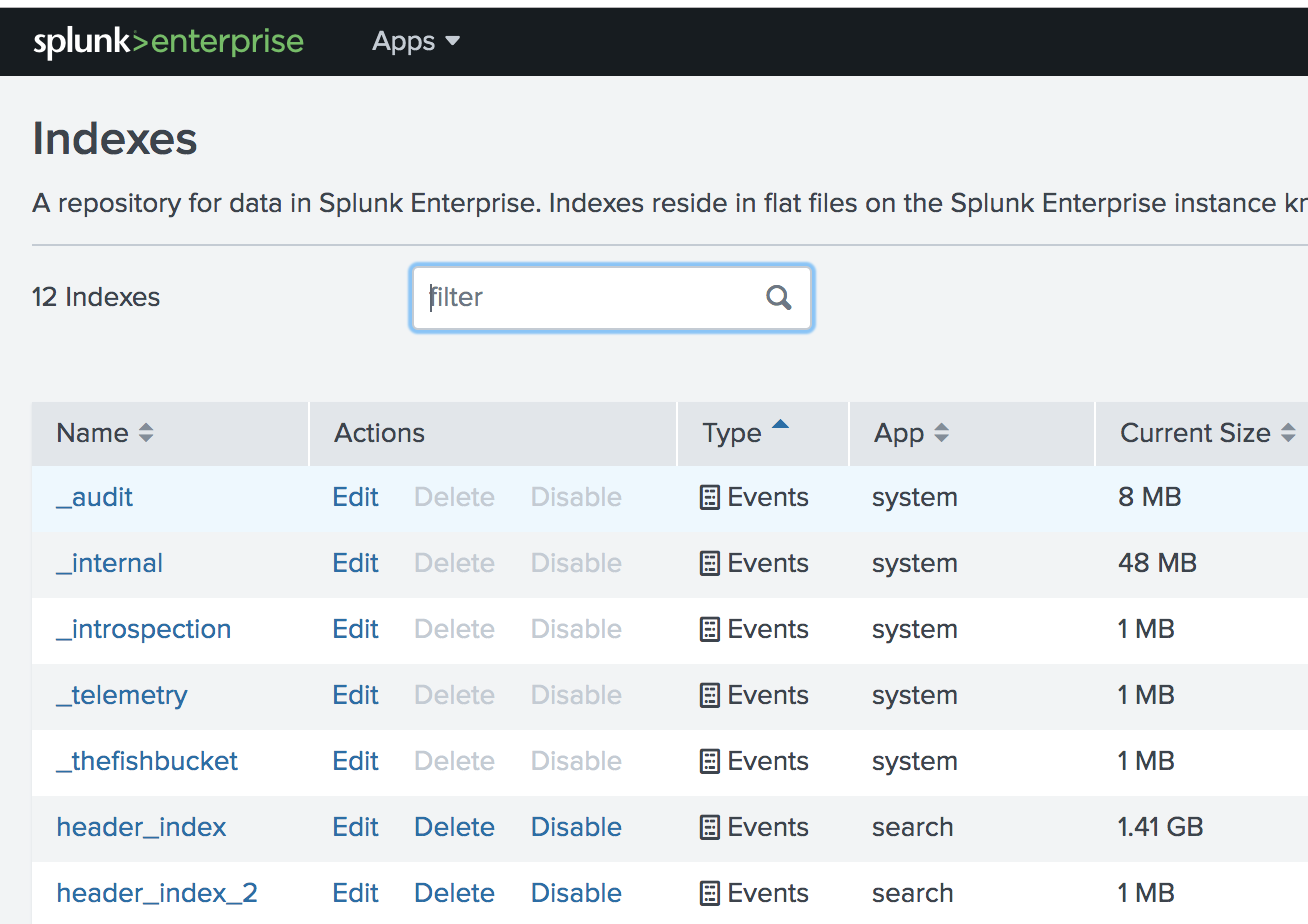
@Ramesh5a7 Looks like we are sending metrics to an event based index. Can we just confirm its configured as a metrics index.
When you go to the Settings -> Data -> indexes page.
What "Type" of index is kubernetes_metrics??
 dtregonning
on 4 Jun 2019
dtregonning
on 4 Jun 2019
Yes, it is showing Events. i don't see any option to change it...
Any idea how to change?

Ramesh5a7
on 4 Jun 2019
Thank you So much. I have changed the index type to metrics. now metrics are working.


Ramesh5a7
on 4 Jun 2019
Your welcome @Ramesh5a7 - Happy metrics searching
 dontregonning
on 4 Jun 2019
dontregonning
on 4 Jun 2019
Related issues
 ajsaclayan
·
5Comments
matthewmodestino
·
4Comments
ajsaclayan
·
5Comments
matthewmodestino
·
4Comments
 Joerg-L
·
7Comments
Joerg-L
·
7Comments
 dmcnaught
·
5Comments
dmcnaught
·
5Comments
 r6ricer
·
8Comments
r6ricer
·
8Comments
Most helpful comment
Thank you So much. I have changed the index type to metrics. now metrics are working.