Sp-dev-docs: Breakpoints not hit/activated
Category
- [ ] Question
- [ ] Typo
- [x ] Bug
- [ ] Additional article idea
Expected or Desired Behavior
Breakpoints in .ts files are hit when debugging on the hosted workbench (and local workench)
Observed Behavior
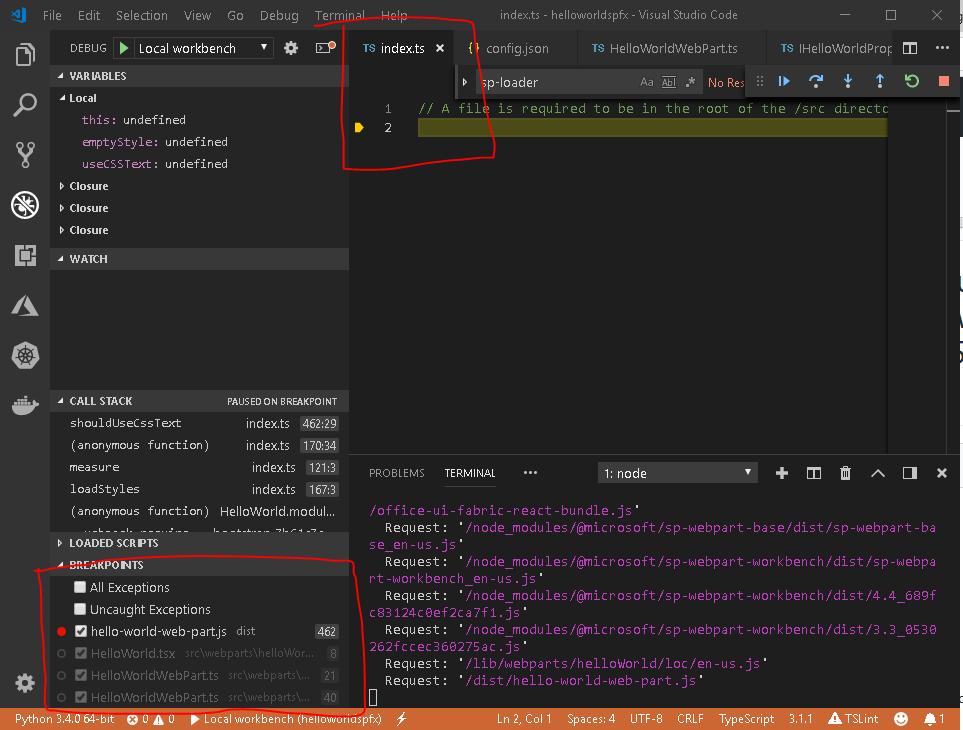
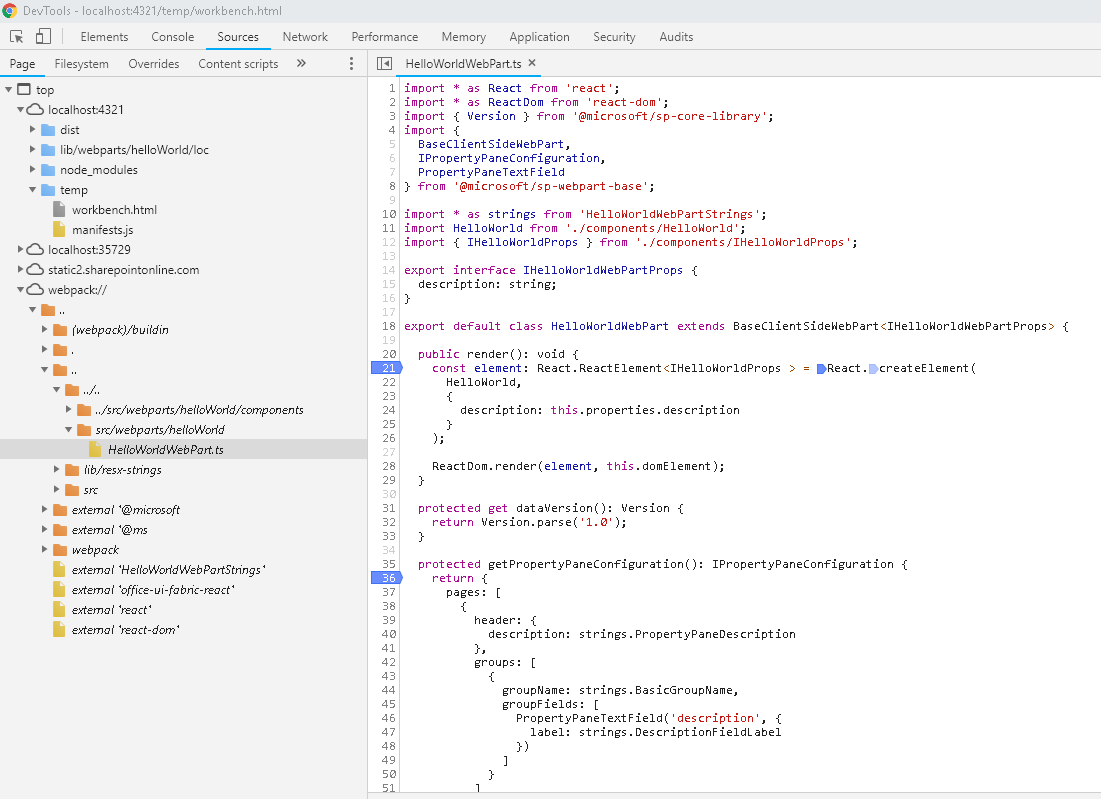
The runtime stops in /src/index.ts instead of the other breakpoints. Sometimes it stops at breakpoints in /dist/*.js files.
Steps to Reproduce
Created a helloworld webpart project. Followed "Debug in Hosted Workbench" section of https://docs.microsoft.com/en-us/sharepoint/dev/spfx/debug-in-vscode. Additionally set $env:NODE_NO_HTTP2="1" to get the workbench working. I am using Google Chrome.
On local workbench, I experienced https://github.com/SharePoint/sp-dev-docs/issues/2062. I resolved that issue following the workaround in https://github.com/SharePoint/sp-dev-docs/issues/2507. However regardless of the workbench I choose I still dont hit the breakpoints i set in HellowWorldWebpart.ts as shown below.
Following is the configurations in launch.json
"version": "0.2.0",
"configurations": [{
"name": "Local workbench",
"type": "chrome",
"request": "launch",
"url": "https://localhost:4321/temp/workbench.html",
"webRoot": "${workspaceRoot}",
"sourceMaps": true,
"sourceMapPathOverrides": {
"webpack:///../../../src/": "${webRoot}/src/",
"webpack:///../../../../src/": "${webRoot}/src/",
"webpack:///../../../../../src/": "${webRoot}/src/"
},
"runtimeArgs": [
"--remote-debugging-port=9222"
]
},
{
"name": "Hosted workbench",
"type": "chrome",
"request": "launch",
"url": "https://sganta.sharepoint.com/_layouts/15/workbench.aspx",
"webRoot": "${workspaceRoot}",
"sourceMaps": true,
"sourceMapPathOverrides": {
"webpack:///.././src/": "${webRoot}/src/",
"webpack:///../../../src/": "${webRoot}/src/",
"webpack:///../../../../src/": "${webRoot}/src/",
"webpack:///../../../../../src/": "${webRoot}/src/"
},
"runtimeArgs": [
"--remote-debugging-port=9222"
]
}
I am considering using docker images but I would still like to just get my development environment running properly for once without the docker image..
 sganta
All 6 comments
Do you have actual logic code in the line 2?
 Seiyasu
on 17 Oct 2018
Seiyasu
on 17 Oct 2018
No, there is no code in index.ts. I have not modified the code in any way. The index.ts is the same as it is after I run yo and insert the HelloWorld web part. The only change is that I added a key/value pair in the debug config above for hosted workbench.
"webpack:///.././src/": "${webRoot}/src/"
This is based on a suggestion in a different issue. It did not seem to change anything.
sganta
on 17 Oct 2018
I found out that I can debug the .ts files in Chrome itself. Some times the breakpoints set in chrome show up in VS Code.
This is not what is expected but atleast I am not stuck anymore. Anybody with a clue as to why the debugger for chrome extension is not working as expected, please share.
Thanks.
sganta
on 18 Oct 2018
The same issue had been reported in #625. The bug has been resolved since VS Code v1.24.0.
Somehow it's still not working for SharePoint online projects.
After my investigations, I found an option way to get the breakpoint. Just add the statement debugger; in your code. The debugger will stop at that line.
Here is my research for your reference:
Hopefully, they're useful.
 yuanzheng
on 26 Oct 2018
yuanzheng
on 26 Oct 2018
It seems the issue have been fixed, so close it now. If you it still does not work, feel free to let me know and i will reopen it for you
Seiyasu
on 31 Oct 2018
Issues that have been closed & had no follow-up activity for at least 7 days are automatically locked. Please refer to our wiki for more details, including how to remediate this action if you feel this was done prematurely or in error: Issue List: Our approach to locked issues
 msft-github-bot
on 26 Jan 2020
msft-github-bot
on 26 Jan 2020
Related issues
 jonthenerd
·
3Comments
jonthenerd
·
3Comments
 mikeparkie
·
3Comments
mikeparkie
·
3Comments
 StfBauer
·
3Comments
StfBauer
·
3Comments
 patrick-rodgers
·
3Comments
patrick-rodgers
·
3Comments
 acksoft
·
3Comments
acksoft
·
3Comments
Most helpful comment
The same issue had been reported in #625. The bug has been resolved since VS Code v1.24.0.
Somehow it's still not working for SharePoint online projects.
After my investigations, I found an option way to get the breakpoint. Just add the statement
debugger;in your code. The debugger will stop at that line.Here is my research for your reference:
Hopefully, they're useful.