Slate: Unbounded Cache causing some Memory Issues
Currently we memoize calls to select functions, but there is no limit to how much we store. Our caches uses immutable which is a bit of a memory hog. Eventually, the size of the cache can grow to be so large that it causes an out of memory error in V8.

doing some light memory profiling, the amount of memory that is created by normalizing is pretty heavy. At any rate, if we let the cache grow and grow, eventually it will hit a size that the browser can't collect and it will just crash.
Couple questions:
- Can we be more selective on the functions we memoize?
- Can we be more selective of when we memoize those functions? Should normalizing cause a memoize?
- Can we prune the cache over time?
 YurkaninRyan
All 21 comments
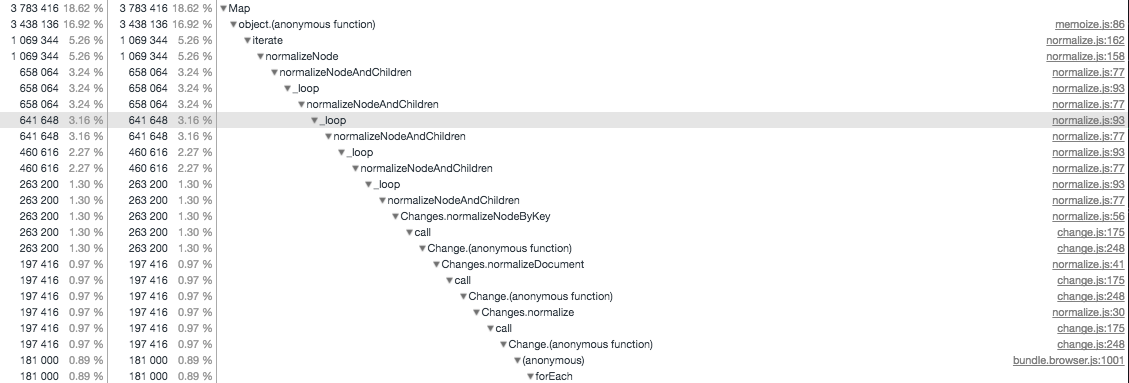
Here's a better drill down on the object that has the normalize.
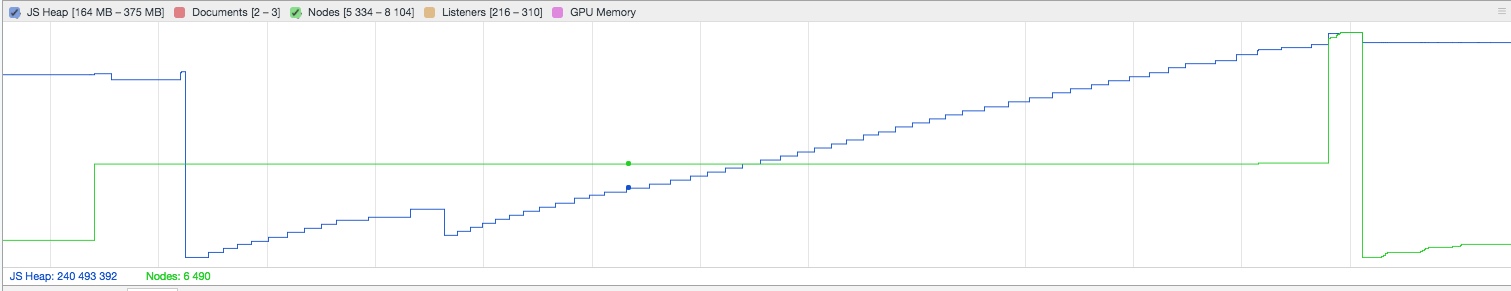
Here is a graph displaying what the memory consumption looks like over time, after a minor gc, it just never seems to be able to gc again
YurkaninRyan
on 14 Nov 2017
Off the top of my head, some random ideas for things that could lead to the larger-than-ideal memory usage:
- The
memoizeimplementation being incorrect and leaky somehow... - Memoizing too many under-used methods that aren't actually giving us enough performance benefits to be worth it. (We can absolutely get rid of any memoized methods that don't actually give us real performance improvements for the 90% use cases, but research needs to show which they are.)
- Memoizing methods that often get called with highly-variable arguments, resulting in poor cache hits and lots of cached values building up in memory. (Right now memoized methods are split into argument-less and argument-ed methods, so that would be a place to start looking.)
- The
Historystacks keeping around references to objects that themselves have larger caches, which prevents them from being garbage-collected. (This is probably a compounding factor, and combined with another factor could result in the large multiples being seen.)
That was just a quick list, so there are probably others.
For my own use, right now my order of priority for my focus is functionality > performance > memory, so this isn't something I'm going to be investigating myself soon. But I am happy to advise and help merge investigations of others.
Would love to hear others's thoughts!
Also, if anyone has good resources on how to approach memory-leak research that would be awesome. I'm pretty proficient in performance testing, but not on the memory side.
 ianstormtaylor
on 15 Nov 2017
ianstormtaylor
on 15 Nov 2017
For the memory leak stuff I find the chrome dev tools memory snapshot to be the one. If you want to dip your toes in I find the profiler that watches memory allocation by function call to be the most useful/easiest to digest.
I'll continue to investigate this and see what can be done, but any extra hands would be appreciated!
YurkaninRyan
on 15 Nov 2017
Hey guys a total noob thought since I don't know that much about Slate core but perhaps worth a poke.
- Is there a limit to the length of undo history? If not, perhaps we should place one or even give API for it (i.e. for mobile users it may be limited severely to 3 and desktop users could get a nice 100 ops)
- How does history handle images? I know they may be in some cases huge strings of datauri stuff that could weigh a ton while in browser memory.
 dmitrizzle
on 16 Nov 2017
dmitrizzle
on 16 Nov 2017
Good point on limits. Right now there is a100 entry limit that is hard coded, but I'd be open to a PR that makes that configurable.
As for images a data URIs, the history doesn't distinguish there. If you put a data URI as a data property of a node, it's going in the history. In general I'd recommend against doing that because even regardless of the history it's going to lead to extremely large documents.
ianstormtaylor
on 16 Nov 2017
Thank you for the advice, Ian. I'll have to investigate the image data-uri issue separately.
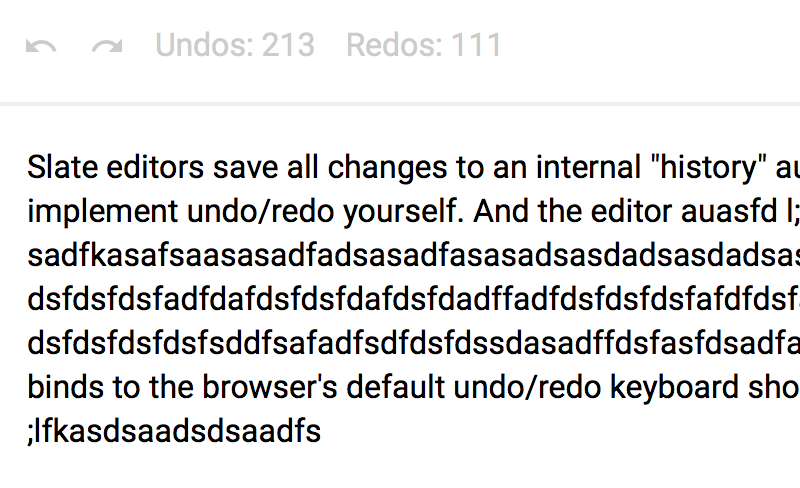
As for history entry limit: I've plaid around with it and it seems that ./slate/src/models/history.js:146 line does nothing to limit the number of undos and re-dos available. I'm not sure if I'm doing it wrong, but I'm attaching an image that demonstrates what I mean. It's from the examples/history and there seems to be no limit to the amount of operations available:
dmitrizzle
on 18 Nov 2017
@dmitrizzle Ah that's interesting. If that's the case it sounds like a bug. If you figure out why that's happening is love a PR to fix it!
ianstormtaylor
on 18 Nov 2017
@ianstormtaylor I think I've figured it out but I still need help understanding how to give API access to control undo size: #1421
Sorry for hijacking this thread 😅
dmitrizzle
on 19 Nov 2017
Replied over there about controlling the undo stack size.
@YurkaninRyan with this bug fixed, could you let us know if the unbounded memory issues are fixed? Thanks!
ianstormtaylor
on 19 Nov 2017
I'm running into this issue with documents with many nodes (in this case a table with about 2000 cells). When deserializing with normalization enabled, it runs out of memory. Without normalization it works fine.
If i disable memoization altogether it works when normalizing.
 julienp
on 26 Jan 2018
julienp
on 26 Jan 2018
Hey folks—just wanted to chime in here. I shipped Slate as the primary editor in Mailspring last week and users have reported a lot of memory issues around the composer. (Because email threads can be long, memory can become an issue quickly.) I've been digging in to the source and I think something definitely needs to change around memoization.
In my typical use case (replying to a short email thread), typing a few sentences in the composer is enough to build up about 45MB of stuff in memoize's __cache on different nodes. I think the most immediate problem is that the __cache isn't cleared, and Value objects hang around for a long time on the undo stack. (eg: having memoization doesn't leak memory permanently, but it makes elements in the undo stack very very "fat")
I think one option would be to convert things to JSON when pushing them on the undo stack - essentially clearing the cached values and the overhead of ImmutableJS in exchange for a bit of a performance hit.
The decentralized nature of the memoization makes it hard to clear, but I think another option would be moving the cache (eg this._cache) out of the individual objects and into a central WeakMap. You couldn't clear individual elements in the WeakMap (since it's weak), but you could wipe the entire thing externally (perhaps right after a new Value is applied to the editor) by resetting it (globalCache = new WeakMap())
Would love to get everyone's thoughts.
UPDATE: Global Weakmap didn't work for some reason, submitted a PR for the "plain objects in history" solution below.
 bengotow
on 30 Jan 2018
bengotow
on 30 Jan 2018
This looks very promising, Ben. Really hoping to get Slate a performance boost too, I hope this is a step in the right direction.
Regarding the undos. Would it make sense and be helpful to set limits like so?
Value.fromJSON({
// first attribute is an optional History object, second one is the undo limit:
history: History.create({}, 50),
/*
document,
schema,
...
*/
})
Of course this limit could have a different implication once #1069 is solved and/or #1456 implemented.
dmitrizzle
on 31 Jan 2018
Hey @bengotow thanks for you research on this, I really appreciate it.
I think I'd like us to focus on improvements and refactors right now that don't add other overhead or complexity to the codebase first though. There are a handful of different suggestions in this thread that could improve memory usage a lot, without having to resort to doing some potentially unexpected things with the history objects first.
Before we get to changing data structures, I'd like to see if there are lower-hanging fruit.
ianstormtaylor
on 31 Jan 2018
Hey @ianstormtaylor — sounds good! I will probably ship this patch in Mailspring in the meantime and see if any new bug reports come in. Since it uses very large Slate documents and a lot of editor plugins query the Value (causing a lot of memoized caching) the impact of keeping N copies of the value around with their caches is pretty huge. Reducing the size of the undo stack would also help bound it, but I'm not sure optimizing what is memoized will get me far enough.
That said, I'll see if I can instrument things a bit and identify functions which are cached but read infrequently or never read - if 30-40% of the cache is values aren't used after they're inserted (or something like that), that'd be a really quick win. 👍
bengotow
on 31 Jan 2018
Sounds good. My guess is there is definitely something like 50% gains to be had from reducing what gets memoized using better heuristics.
Another big win would be changing selections to use paths everywhere I believe, since it would eliminate the need to store operation.value with those operations if I recall correctly.
If those two were implemented, which are things that would reduce complexity even, my guess is we'd have huge wins.
ianstormtaylor
on 31 Jan 2018
Hey folks—I did some more research re: memoiziation effectiveness to look for some quick wins. I instrumented the memoize util to track 1) the number of cache insertions and cache hits for each memoized property in each class and 2) the computational cost of computing the property (by running the underlying function 20x and timing it) and then just used the editor for a while.
(Source: https://github.com/bengotow/slate/blob/memoization-metrics/packages/slate/src/utils/memoize.js#L68)
I think these stats would vary based on the Slate plugins you're using. The editor I'm testing has a dozen or so instances of slate-auto-replace, uses slate-soft-break and slate-edit-list, and has a custom spellcheck decorator and some other things. Hopefully I'm not doing anything particularly odd and it's a good representation of the kitchen sink. 😄
Column Meanings:
- Cache Hit %:
Reads / (Reads + Saves)- overall "usefulness" of this value being cached. - Time to Calculate: The number of milliseconds, on average, it took Slate to run the underlying method.
- Time Savings: The number of reads (cache hits) * the calculation time.


Based on this data, I believe the following properties are very easy to calculate and are not worth caching (caching them produces little time savings). These are at the bottom of the graph above which is sorted by Time Savings:
Node.hasVoidParent
text.getMarksAsArray
Node.getLastText
text.validate
Node.getNextText
Node.getDescendantAtPath
Node.getBlocksAtRange
Node.hasNode
Node.getOffset
text.getMarks
Node.getInsertMarksAtRange
schema.getParentRules
Node.isLeafInline
stack.getPluginsWith
Node.getKeys
The following cached properties have a very low hit rate (<20%), meaning Slate is caching them a lot and using the cached value infrequently, so it's a poor use of space in RAM:
Node.validate
Node.areDescendantsSorted
Node.getBlocksAtRange
Node.getPath
Node.getDescendantAtPath
Node.getInsertMarksAtRange
Node.getNextText
text.getMarks
Node.getKeys
Node.getOffset
(Node.getFragmentAtRange would have been in these sets, but it has a very high computation time so it might be an exception to the rule.)
On the other hand, it's nice to see things like Node.getParent are producing massive speed improvements by being cached—95% hit rate and 283s of computation time saved. I only typed for ~3min to build these results, sounds like memoizing that almost doubled performance.
bengotow
on 31 Jan 2018
@bengotow this is extremely awesome! Thank you for digging into that. These results are super helpful for thinking about this, and should absolutely help us make some quick savings on memoizing lots of these pieces. Before I get into dissecting, a few questions...
Is there any way to also factor into the results tables the overall size in memory that is taken up by the different caches? (Or even not inside the table, but just to see which cached methods are the ones taking up the most size over time.)
Is the "Time to Calculate (ms)" column there the average? (I'm assuming yes, which is great!)
@bengotow does your use case make heavy use of schemas to normalize the document? I know
slate-edit-listhas schema information, but is there any other schema use in your example?
(Also, I'm going to specifically call out PR's that I'd accept so far from this, just because I think it might make it more clear, since I've got a decent amount of context, and sometimes these kinds of research are hard to know when to trust data vs. familiarity. Hope that makes sense!)
One of the first things I notice, is that we have pair methods where one version returns a mutable value and the other returns the equivalent mutable value. For example getKeysAsArray and getKeys. We created these I believe because it seemed that often working on immutable values was slower, so internally we use the mutable arrays whenever possible.
But, this definitely adds duplication in the memoization. For example, getKeysAsArray is used a lot and has a high cache hit rate. But getKeys isn't used (almost at all) in core, so we're memoizing those potentially large sets of keys for no reason.
And even if it is read by external code, converting an array of keys to a set probably isn't that hard, and it will just be cached at the layer directly below of getKeysAsArray, saving all of the iteration of the tree which is the big cost anyways. So for the first change...
👌 Change 1: I'd accept a PR that removed memoization on node.getKeys, and also changed these two lines in core to use getKeysAsArray instead of getKeys.
Okay, so continuing on that train of thought, here are the comparisons on time savings written up for the "arrays vs. immutables" caching:
node.getKeys
  - array: 98,654
  - immutable: 0

node.getTexts
  - array: 56,901
  - immutable: 8,751

node.getMarksAtRange
  - array: 24,363
  - immutable: 3,306

node.getCharactersAtRange
  - array: 24,255
  - immutable: 1,725

node.getInlinesByType
  - array: 11,399
  - immutable: 134

node.getActiveMarksAtRange
  - array: 3,447
  - immutable: 6,513

node.getTextsAtRange
  - array: 2,436
  - immutable: 2,079

node.getInlinesAtRange
  - array: 2,376
  - immutable: 372

node.getInsertMarksAtRange
  - array: 540
  - immutable: 0

node.getBlocksAtRange
  - array: 45
  - immutable: 1

text.getMarks
  - array: 18
  - immutable: 0
All but one of them has the array variant saving the most time. Again this is probably because most of the core usage of these functions works on the array variant, and not the immutable one for speed reasons.
The only exception is getActiveMarksAtRange, where it seems like the immutable variant is actually saving us more time. And I think this is due to the immutable version being used in the Value model directly, so it's seeing more opportunity to have cache hits.
What this tells us—which is already known but good to remember—is that this data is impacted by how much the code paths are used. Anything that is used in core for its main calculations is going to see high use, and thus high chance for cache hits to play a factor. But if there are any paths that are highly depended on in user land but not in core, we might not see them show up. (This is tempered by @bengotow's use case, which is hopefully a kitchen-sink type use case.)
Okay, so with that, I think there are two more changes I'd accept:
👌 Change 2: I'd accept a PR that removed the memoization on the immutable variant of any method that also has an AsArray variant directly backing it. I believe that list would be:
node.getKeys
node.getTexts
node.getMarksAtRange
node.getCharactersAtRange
node.getInlinesByTypeAsArray
node.getActiveMarksAtRange
node.getTextsAtRange
node.getInlinesAtRange
node.getInsertMarksAtRange
node.getBlocksAtRange
text.getMarks
(I've included getActiveMarksAtRange in this list, because I think even though we're seeing some decent cache hits from it, those hits will simply fall to the *AsArray layer below, and we should still maintain most of the gains I think, while reducing some of the memory size.)
👌 Change 3: I'd accept a PR that looked in the Node, Value and Text models for any previous methods that were using the non-AsArray variant that could be changed to use the AsArray variant. This change would ensure that even after we've removed the memoization on the immutable variants that we're still using the most-cached path. For example, this line is a contender because getCharactersAtRange returns a Immutable.List and we're just iterating over it once, so it could easily be swapped for a regular array. (The only tricky part here is if the immutable value is an Immutable.Set, in which case the regular array won't be de-duped, so we can't rely on it.)
So far, after those changes, using the two lists that @bengotow compiled of candidates for removal, we're left with:
node.hasVoidParent
node.getLastText
text.validate
node.getNextText
node.getDescendantAtPath
node.hasNode
node.getOffset
schema.getParentRules
node.isLeafInline
stack.getPluginsWith
node.validate
node.areDescendantsSorted
node.getPath
node.getDescendantAtPath
node.getNextText
node.getOffset
For node.getLastText, I'm curious about that one. It seems like getFirstText is seeing massive savings, and I wonder if getLastText is not purely because it's used less, or whether the code paths aren't hitting it here. I'm reticent to remove the memoization on one but not both, for consistency.
For node.validate and text.validate I'm also curious about these. I'd have assumed that they'd see lots of cache hits if there are recursive schema validations happening. I think we need more information before we can remove these.
Given that, I'll wait for responses before digging more!
Thank you @bengotow!
ianstormtaylor
on 31 Jan 2018
I was wondering if it would make sense to disable memoization altogether in some circumstances, notably initial validation.
In practice all values will undergo a full validation when they are initial loaded into an editor, because of the schema check in the BeforePlugin, even if they are deserialized with normalize: false. In readOnly mode there's no gain at all from this memoization, and for large documents can cause very heavy memory usage, to the point that some documents cause out of memory errors (this is mostly the case for documents containing large or many tables, maybe having tables represent each cell as a real slate node is flawed).
Even when editing it seems somewhat wasteful.
julienp
on 14 Feb 2018
Just wondering if we can trust the garbage collector to detect cyclic references and still garbage them ?
 Soreine
on 22 Mar 2018
Soreine
on 22 Mar 2018
An update:
I would argue that asArray functions are not certainly faster than immutable functions in this stage.
Our data are stored, like characters, leaves, marks in an immutable way. Thus each time we are using
asArrayfunction, we have to transform these data withtoArray()function. However, immutable.js does not have an array cache. Each time of the convertion, we are creating new Arrays for each bottom-mostSometimes we use
forEach(push)rather thanconcatin our codebaseasArray(range)function cannot take advantage in cache. Because, even with same startKey, endKey, startOffset, endOffset, we cannot ensure the range is the same. For example, if we move cursor left and then move cursor back, thegetXXXAtRange(AsArray)cannot take advantage of cache. And I think we can remove the cache of AtRange functions
I will submit a PR about that soon.
 zhujinxuan
on 11 Apr 2018
zhujinxuan
on 11 Apr 2018
I think now that value is not in operations this would be largely mitigated. Feel free to open new issues for specific things that aren't though!
ianstormtaylor
on 9 May 2019
Related issues
 AlexeiAndreev
·
3Comments
AlexeiAndreev
·
3Comments
 Slapbox
·
3Comments
bengotow
·
3Comments
ianstormtaylor
·
3Comments
ianstormtaylor
·
3Comments
Slapbox
·
3Comments
bengotow
·
3Comments
ianstormtaylor
·
3Comments
ianstormtaylor
·
3Comments
Most helpful comment
Hey folks—I did some more research re: memoiziation effectiveness to look for some quick wins. I instrumented the
memoizeutil to track 1) the number of cache insertions and cache hits for each memoized property in each class and 2) the computational cost of computing the property (by running the underlying function 20x and timing it) and then just used the editor for a while.(Source: https://github.com/bengotow/slate/blob/memoization-metrics/packages/slate/src/utils/memoize.js#L68)
I think these stats would vary based on the Slate plugins you're using. The editor I'm testing has a dozen or so instances of
slate-auto-replace, usesslate-soft-breakandslate-edit-list, and has a custom spellcheck decorator and some other things. Hopefully I'm not doing anything particularly odd and it's a good representation of the kitchen sink. 😄Column Meanings:
Reads / (Reads + Saves)- overall "usefulness" of this value being cached.Based on this data, I believe the following properties are very easy to calculate and are not worth caching (caching them produces little time savings). These are at the bottom of the graph above which is sorted by
Time Savings:The following cached properties have a very low hit rate (<20%), meaning Slate is caching them a lot and using the cached value infrequently, so it's a poor use of space in RAM:
(
Node.getFragmentAtRangewould have been in these sets, but it has a very high computation time so it might be an exception to the rule.)On the other hand, it's nice to see things like
Node.getParentare producing massive speed improvements by being cached—95% hit rate and283sof computation time saved. I only typed for ~3min to build these results, sounds like memoizing that almost doubled performance.