Skywalking: [FEATURE] Performance profile at method level in production environment
Please answer these questions before submitting your issue.
- Why do you submit this issue?
- [ ] Question or discussion
- [ ] Bug
- [ ] Requirement
- [x] Feature or performance improvement
I wrote about the thread monitoring proposal in the mail list.
The doc is now complete to introduce this feature: https://docs.google.com/document/d/1rxMf1WN3PaFaZp7r8JmtwfdkmjLTcFW_ETAZv5FIU-s/edit
Because the amount of development is relatively large, I will divide the following steps into the development work:
Step 1: Save thread monitoring tasks to storage and corresponding graphQL
- Define thread monitoring DAO, graphql, mainly including adding task interface
- Implementing JDBC storage
- Implementing Elasticsearch storage
- Implementing Elastic-search 7 storage
Step 2: Downstream task to sniffer
- Define the cache interface (CacheDAO), which can be used to query the cached data. Implementing JDBC storage
- Complete queries in Elasticsearch and Elasticsearch 7
- Create a CacheService and start a scheduled task to write data to the cache
- Define the protocol file (query command) for OAP to communicate with the sniffer, and implement the gRPC server handler
Step 3: sniffer executes commands to monitor traces
- Start timing tasks for command reading, and define the gRPC protocol (for snapshot upload)
- Monitor trace generation and report data
- Write Testcase (JUnit) to ensure that snapshots can be created and reported after receiving the command
Step 4: OAP saves thread snapshot
- Define the receive module, define the interface for adding snapshots in the DAO, and receive the data save request passed by the sniffer
- Implementing JDBC storage
- Implementing Elasticsearch storage
- Implementing Elastic-search 7 storage
- Write Testcase, save operation based on received data
Step 5: Query data and display graphql
- Define query interface and graphql for querying task list, related trace list, and snapshot
- Implementing JDBC storage
- Implementing Elasticsearch storage
- Implementing Elastic-search 7 storage
- Complete test code (e2e-cluster-test-runner)
 mrproliu
All 11 comments
Branch profile will be created after 6.6.0 release. PRs of all steps should send to there, after all features tested and e2e test setup, I will submit a un-squash merge PR to the master.
This is a very important feature, @apache/skywalking-committers, welcome and look forward all of you could take part in and help on review. Design doc should be ready.
 wu-sheng
on 22 Dec 2019
wu-sheng
on 22 Dec 2019
To all in this thread
@mrproliu has made big progress in this feature. We miss the last step, then we could deliver the test env to UI team, @Fine0830.
I have submitted the CFP about this for SRECon and JavaZone, I hope I could at least get one passed.
wu-sheng
on 6 Feb 2020
To all in this thread
@mrproliu has made big progress in this feature. We miss the last step, then we could deliver the test env to UI team, @Fine0830.
I have submitted the CFP about this for SRECon and JavaZone, I hope I could at least get one passed.
hmm...I don't understand what the test env is and what we need to do in UI.
 Fine0830
on 7 Feb 2020
Fine0830
on 7 Feb 2020
hmm...I don't understand what the test env is and what we need to do in UI.
Test env is the one(by using docker), we will give you to set up locally, then you could easily query .
UI design is included in the Google doc, here are the links
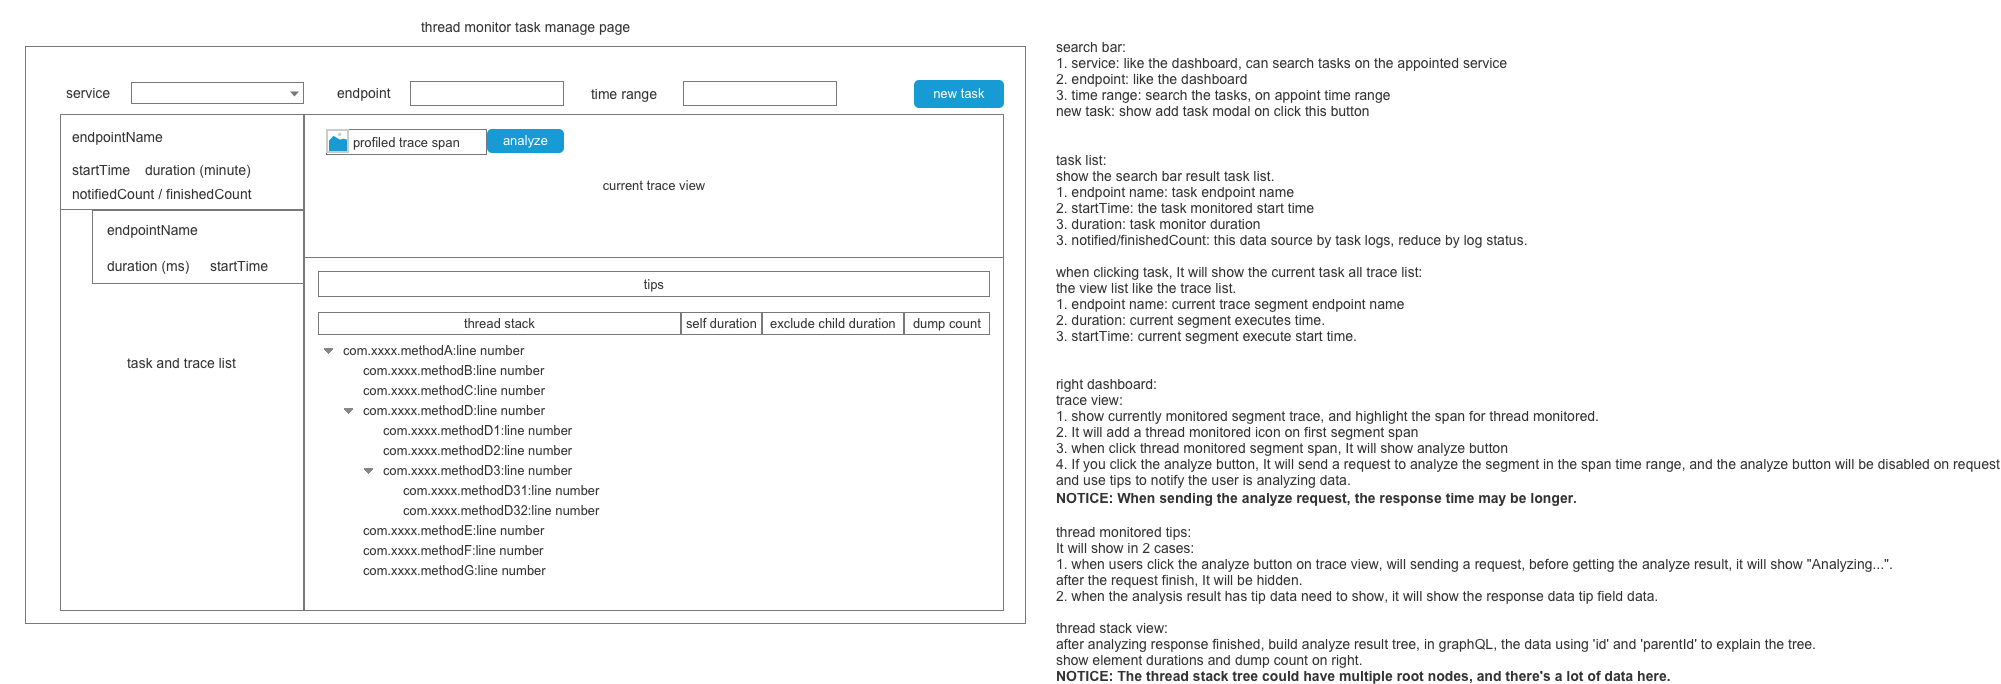
- Main page, https://bwd5l7.axshare.com/#id=8sgf47&p=thread-monitor-page&g=1
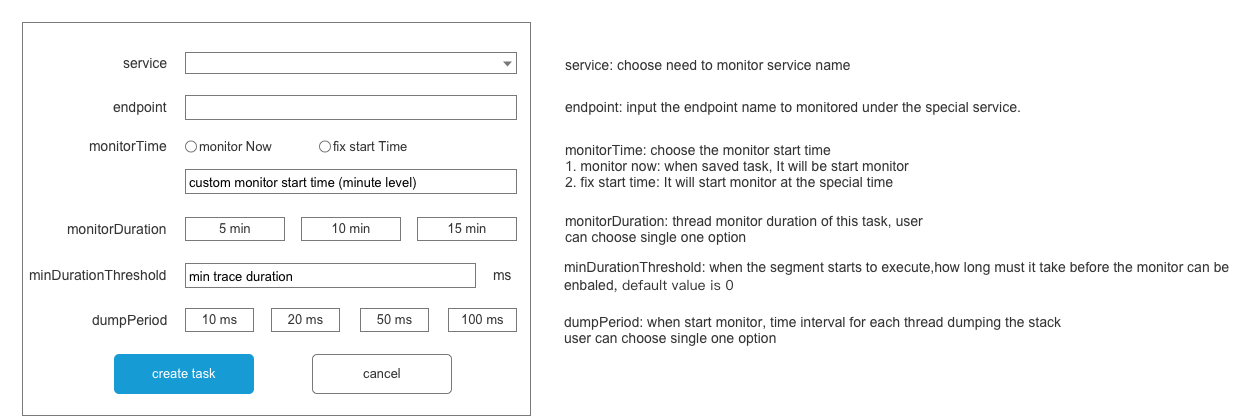
- Add task page, https://bwd5l7.axshare.com/#id=61ddhs&p=add-task-modal&g=1
@Fine0830 The UI design is just a proposal and matched the proposal, for details, after you read, we could talk more.
wu-sheng
on 7 Feb 2020
All backend related PRs have been merged, and e2e tests passed. @mrproliu Next step, let's provide a local test image with data to the UI team(@Fine0830 ). Notice, the TTL should be set as long as possible to avoid the profile data being deleted.
wu-sheng
on 11 Feb 2020
The data is ready for the UI team(@Fine0830 ) to access.
- By running this command, you can start the OAP server locally, which already contains the data content:
docker run -d -p 12800:12800 -p 9090:9090 mliu111477/profile-graphql:0.0.5
- Data query related GraphQL has generated query related statements through postman(exclude create). You can refer to this file. After importing, you can use.
mrproliu
on 11 Feb 2020
@Fine0830 Above inform should be ready for your local run and test. UI draft is there if you have any issue, please ping me, we could discuss, especially about the UI design.

wu-sheng
on 11 Feb 2020
I will review the UI design draft again tomorrow, and try to finalize with @mrproliu
wu-sheng
on 11 Feb 2020
The UI design has been finished.
- Add task model:
- Profile main page:
mrproliu
on 12 Feb 2020
@Fine0830 This is a backend performance benchmark for analysis button action.
https://cwiki.apache.org/confluence/display/SKYWALKING/Performance+profile+analyze+benchmark
Give the tips The analysis usually takes 2-10s, please wait. when user confirms to do analysis action at the UI.
wu-sheng
on 16 Feb 2020
Hi, @Fine0830. I missed the profiled segment query in GraphQL, now has added.
I create the new docker images, please running this command to run it.
docker run -d -p 12800:12800 -p 9090:9090 mliu111477/profile-graphql:0.0.8
The postman has also added this query:
https://www.getpostman.com/collections/8f84a74da2bb9bb6f118
mrproliu
on 25 Feb 2020
Related issues
 vanlin
·
6Comments
vanlin
·
6Comments
 valyala
·
3Comments
valyala
·
3Comments
 Icefoxes
·
3Comments
Icefoxes
·
3Comments
 wuxingye
·
4Comments
wuxingye
·
4Comments
 xiaour
·
6Comments
xiaour
·
6Comments