Sktime: Plotting confidence intervals
Is your feature request related to a problem? Please describe.
Plotting confidence intervalls with the current plot function from sktime.utils.plotting import plot_series is not well suitable in case all lines are very close, see picture.
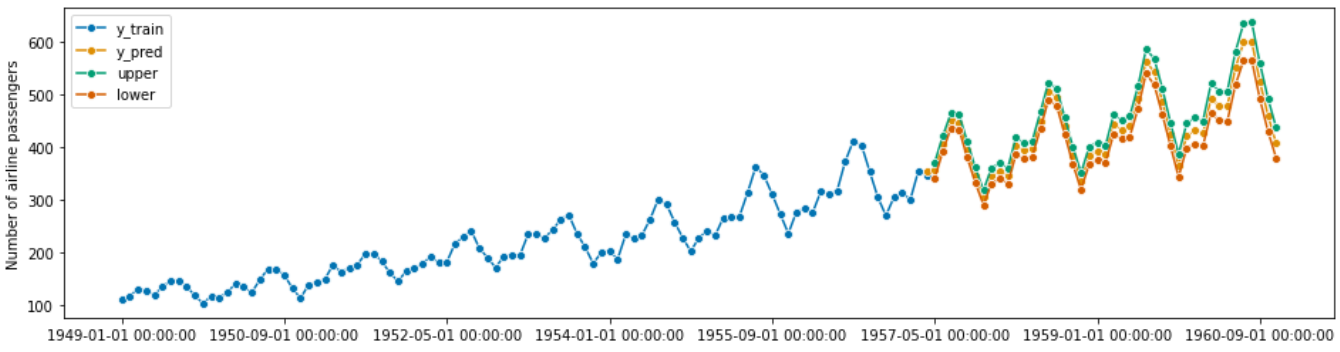
Describe the solution you'd like
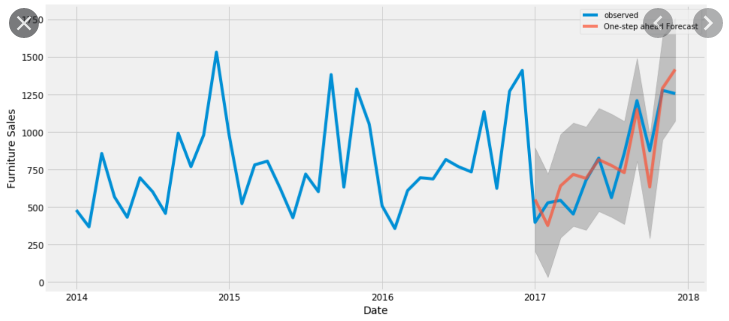
Plot like this would be great, with the points as an option ideally. The function could just receive the DataFrame pred_int from y_pred, pred_int = model.predict(fh=fh, return_pred_int=True)
as an input so this is already well structured and named.
 aiwalter
All 8 comments
Yes we could add an pred_int=None input argument to plot_series with the same time index as one of the other series. As you say, it would optionally accept a pd.DataFrame and plot the intervals.
 mloning
on 15 Dec 2020
mloning
on 15 Dec 2020
I'd love to take this on!
 timcashion
on 16 Dec 2020
timcashion
on 16 Dec 2020
@timcashion cool, I have just seen that in examples 01_forecasting.ipynb at the end there is a plot like I proposed. So basically you could just copy this into the function :)
aiwalter
on 16 Dec 2020
- Would it be a good idea to have CIs at different confidence levels (say, 90%, 95%, 99%) also graphically represented in these plots?
- Would it also be good to have a related feature to store the CIs in the forecast as series (series of tuples, or as individual columns)?
 aiexplorations
on 6 Jan 2021
aiexplorations
on 6 Jan 2021
@aiwalter, @timcashion, one of the ideas in the sktime ecosystem was to use interval and distribution returns compatible with the skpro (probabilistic prediction) toolbox https://github.com/alan-turing-institute/skpro
Unfortunately skpro has gone on hiatus after the disappearance of its maintainer half a year ago - any appetite for taking parts of the development/prototyping on with the ultimate aim of getting nice probabilistic returns for sktime?
 fkiraly
on 7 Jan 2021
fkiraly
on 7 Jan 2021
@aiexplorations
- We would have to fit multiple models because most models can only return CIs for a single alpha value. But actually it could work to accept also a list like
alpha = [0.95, 0.9, 0.5]and loop 3 times over_fit()andpredict(). - I think this would change the API because currently
predict()is returning apd.Seriesand nopd.DataFrame. A better solution could be to return the prediction also when doingpredict(return_pred_int=True). Or you can just merge the results ofpredict()andpredict(return_pred_int=True)?
@fkiraly thanks for mentioning, I think for now I will rather continue with contributing to sktime :)
aiwalter
on 7 Jan 2021
Re 2. if return_pred_int=True, both the point predictions (pd.Series) and intervals (pd.DataFrame) are returned
mloning
on 7 Jan 2021
@fkiraly thanks for mentioning, I think for now I will rather continue with contributing to sktime :)
@aiwalter, if you look at the roadmap, it is a necessary pre-condition for time-to-event modelling
https://github.com/alan-turing-institute/sktime/blob/master/docs/source/roadmap.rst
(last paragraph)
and it would be very useful for forecasting, too.
So it would count as a contribution to sktime :)
fkiraly
on 7 Jan 2021
Related issues
 big-o
·
6Comments
big-o
·
6Comments
 adelphi207831197
·
6Comments
adelphi207831197
·
6Comments
 TonyBagnall
·
10Comments
mloning
·
10Comments
mloning
·
9Comments
TonyBagnall
·
10Comments
mloning
·
10Comments
mloning
·
9Comments