Sktime: Add SlidingWindowSplitter visualization
Is your feature request related to a problem? Please describe.
I want to be able to visualize the cross folds generated by the sliding window splitter.
Describe the solution you'd like
In the example:
forecaster = ReducedRegressionForecaster(regressor=regressor, window_length=15, strategy="recursive")
param_grid = {"window_length": [5, 10, 15]}
train_window = int(len(y_train) * 0.5)
print('Train initial window = %d' % train_window)
print('Train size = %d' % len(y_train))
print('Test size = %d' % (len(y) - len(y_train)))
# we fit the forecaster on the initial window, and then use temporal cross-validation to find the optimal parameter
cv = SlidingWindowSplitter(initial_window=train_window)
gscv = ForecastingGridSearchCV(forecaster, cv=cv, param_grid=param_grid)
gscv.fit(y_train)
y_pred = gscv.predict(fh)
I want to see all the training windows and their corresponding points in a dataframe that I can also use to plot via vertical lines.
I tried this:
print('Total Splits %d' % cv.get_n_splits(y=y_test))
print('Cutoff points %s' % cv.get_cutoffs(y=y_test))
Which gives me:
Total Splits 36
Cutoff points [-1  0  1  2  3  4  5  6  7  8  9 10 11 12 13 14 15 16 17 18 19 20 21 22
 23 24 25 26 27 28 29 30 31 32 33 34]
I am not sure how do I interpret those offsets, are they relative to the y_test index? For example -1 bleeds into the y_train (last point) and 0 is the first point of y_test?
How are the training windows expanded backward from the cutoff points?
Describe alternatives you've considered
For the cutoff maybe this is the solution:
cutoff = cv.get_cutoffs(y=y_test)
y_test.index[cutoff]
For the training windows I am not sure.
 robomotic
All 11 comments
Hi @robomotic, the offsets are based on a zero-based integer index of the passed data, so as you suspect, a cutoff of 0 is the first value, and a -1 for the test set means its the last value of the training set.
The windows are expanded backwards using the window_length information.
Check out the forecasting tutorial notebook where we illustrate this with a simple value range as input.
Very open to hear improvement suggestions!
 mloning
on 12 Nov 2020
mloning
on 12 Nov 2020
I'll close this for now, but feel free to re-open!
mloning
on 24 Nov 2020
Hi @mloning,
thanks for the clarification.
In relation to this code:
cv = SlidingWindowSplitter(initial_window=int(len(y_train) * 0.5))
it would be nice from the cv object to give me a list of all the folds intervals (it can be tuples of datetime or indexes) that are generated from the initial window.
I understand now they expand backward but I would like to be able to debug them and plot them somehow in a table or overlay into the time chart.
Sorry to be a pain!
robomotic
on 25 Nov 2020
Hi @robomotic
Here's a quick solution:
from sktime.datasets import load_airline
from sktime.forecasting.model_selection import SlidingWindowSplitter
from sktime.forecasting.base import ForecastingHorizon
import numpy as np
import matplotlib.pyplot as plt
import seaborn as sns
from matplotlib.ticker import MaxNLocator
y = load_airline()[:30]
window_length = 10
fh = ForecastingHorizon([1, 2, 3])
fh_length = len(fh)
cv = SlidingWindowSplitter(window_length=window_length, fh=fh, start_with_window=True)
n_splits = cv.get_n_splits(y)
windows = np.empty((n_splits, window_length), dtype=np.int)
fhs = np.empty((n_splits, fh_length), dtype=np.int)
for i, (w, f) in enumerate(cv.split(y)):
windows[i] = w
fhs[i] = f
fig, ax = plt.subplots(1)
window_color, fh_color = sns.color_palette("colorblind")[:2]
def get_y(length, split):
return np.ones(length) * split
for i in range(n_splits):
ax.plot(windows[i], get_y(window_length, i), marker="o", c=window_color, label="Window")
ax.plot(fhs[i], get_y(fh_length, i), marker="o", c=fh_color, label="Forecasting horizon")
ax.invert_yaxis()
ax.yaxis.set_major_locator(MaxNLocator(integer=True))
ax.set(ylabel="Window number", xlabel="Time", xticklabels=y.index);
# remove duplicate labels/handles
handles, labels = [(l[:2]) for l in ax.get_legend_handles_labels()]
ax.legend(handles, labels)
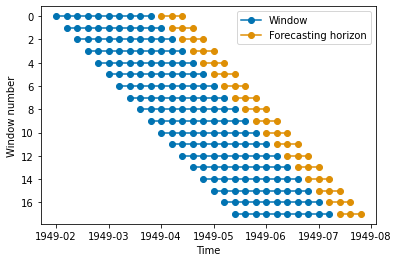
Adding this as a method for the temporal cross-validators would be very nice!
This is similar to the plots here.
mloning
on 26 Nov 2020
Yes very nice this is what I was looking for.
Maybe add that into the tutorial!
Feel free to close now.
robomotic
on 26 Nov 2020
@mloning
I have been trying to decompose the code to understand the functionality with various combinations of the inputs. This visualization would be an excellent addition to the library!
Also, can you elaborate what you mean by the following. Do you have any visualizations for this?
The windows are expanded backwards using the window_length information.
Thanks!
 ngupta23
on 2 Dec 2020
ngupta23
on 2 Dec 2020
Hi @ngupta23 - yes, I agree, I would appreciate a PR!
Regarding the statement, I think about it in terms of what we call cutoff points, that is, the points in time at which you want to generate a prediction based on same past data. How much past data you use is determined by the window_length. Hope this helps.
mloning
on 2 Dec 2020
Hi @mloning
I was thinking of adding this visualization as a method to the class. Something like this...
cv = SlidingWindowSplitter(window_length=window_length, fh=fh, start_with_window=True)
cv.visualize()
I would also add an empty method to the base class with a message so that it could be implemented by other CV classes at a later point in time. Do you think this would be OK?
ngupta23
on 13 Dec 2020
Yes sounds good, visualize should take some series y as an input argument. 👍
mloning
on 13 Dec 2020
Connected with https://github.com/alan-turing-institute/sktime/issues/544, we could also this visualisation on the docstrings:
For example for `window_length = 5`, `step_length = 1` and `fh = 3`
here is a representation of the folds:
|-----------------------|
| * * * * * x x x - - - |
| - * * * * * x x x - - |
| - - * * * * * x x x - |
| - - - * * * * * x x x |

* = training fold.
x = test fold.
 juanitorduz
on 20 Dec 2020
juanitorduz
on 20 Dec 2020
Hi @robomotic
Here's a quick solution:
from sktime.datasets import load_airline
from sktime.forecasting.model_selection import SlidingWindowSplitter
from sktime.forecasting.base import ForecastingHorizon
import numpy as np
import matplotlib.pyplot as plt
import seaborn as sns
from matplotlib.ticker import MaxNLocator

y = load_airline()[:30]
window_length = 10
fh = ForecastingHorizon([1, 2, 3])
fh_length = len(fh)

cv = SlidingWindowSplitter(window_length=window_length, fh=fh, start_with_window=True)
n_splits = cv.get_n_splits(y)

windows = np.empty((n_splits, window_length), dtype=np.int)
fhs = np.empty((n_splits, fh_length), dtype=np.int)
for i, (w, f) in enumerate(cv.split(y)):
    windows[i] = w
    fhs[i] = f

fig, ax = plt.subplots(1)

window_color, fh_color = sns.color_palette("colorblind")[:2]

def get_y(length, split):
    return np.ones(length) * split

for i in range(n_splits):
    ax.plot(windows[i], get_y(window_length, i), marker="o", c=window_color, label="Window")
    ax.plot(fhs[i], get_y(fh_length, i), marker="o", c=fh_color, label="Forecasting horizon")

ax.invert_yaxis()
ax.yaxis.set_major_locator(MaxNLocator(integer=True))
ax.set(ylabel="Window number", xlabel="Time", xticklabels=y.index);

# remove duplicate labels/handles
handles, labels = [(l[:2]) for l in ax.get_legend_handles_labels()]
ax.legend(handles, labels)
Adding this as a method for the temporal cross-validators would be very nice!
This is similar to the plots here.
These visualisations are very helpful! I would be up for creating a notebook about it (based on this code) and put it on the examples. It would explain and compare temporal_train_test_split, SlidingWindowSplitter and CutoffSplitter to begin with.
juanitorduz
on 21 Dec 2020
Related issues
 azev77
·
8Comments
azev77
·
8Comments
 pradithya
·
5Comments
pradithya
·
5Comments
 shoaibkhanz
·
4Comments
shoaibkhanz
·
4Comments
 shruthibalaji2307
·
6Comments
mloning
·
7Comments
shruthibalaji2307
·
6Comments
mloning
·
7Comments
Most helpful comment
Connected with https://github.com/alan-turing-institute/sktime/issues/544, we could also this visualisation on the docstrings: