Sitespeed.io: Grafana dashboard - same domain, different ports
Hi,
First of all, thank you for providing a great tool!
We have two teams who work on one site each. Both of the sites are hosted on the same test environment IP, but on different ports. We're also sharing the same Grafana dashboard.
The problem is that in the dashboard the ports are not included, so the data is meshed together. This can be partially solved with page aliases, but that doesn't work in the site summary.
One way to separate the data would be domain aliases, but I wasn't able to find that in the configuration docs. The current workaround is to edit /etc/hosts of the Sitespeed container. For example, say that Team A uses the fake domain team.a in their reports.
#!/bin/bash

FAKE_DOMAIN="team.a"
HOST="https://$FAKE_DOMAIN:$WEB_PORT"

docker run \
    --rm \
    -v "$PWD/sitespeed":/sitespeed.io \
    --network host \
    --add-host $FAKE_DOMAIN:$TEST_ENV_IP \
    -e HOST=$HOST \
    sitespeedio/sitespeed.io:12.0.0 \
    --outputFolder /sitespeed.io/reports \
    --config config.json \
    --graphite.host $GRAPHITE_IP \
    --graphite.webPort $GRAPHITE_WEB_PORT \
    --multi \
    tests/loadAllPages.js
If there is a nicer way of solving this, I am more than happy to receive feedback. Otherwise I suggest that support is added for either:
- ports in the dashboard, or
- domain aliases
I personally prefer the latter, since the dashboard becomes more readable.
 davidgrankvist
All 6 comments
I would write 2 separate CRON jobs for 2 sites (running on different ports)
If you have 2 scripts running and testing 2 sites you can add this type of parameter to separate out both the tests from different PORTS
/usr/local/var/www/sitespeed-result/server-port/$(date +\%Y-\%m-\%d-\%H-\%M-\%S)
So the folders would look like below
/sitespeed-result
+--- QA-server-8080
+--- QA-server-8081
You can also use the --name parameter & read from environment variable in sitespeed command-line e.g.
Script # 1 - pass the --name $serverport1
Script # 2 - pass the --name $serverport2
This name will appear in the SITESPEED SUMMARY PAGES on top e.g below

Let me know if you need any further help or if this didnt help answer your question.
 softwareklinic
on 21 Mar 2020
softwareklinic
on 21 Mar 2020
Thank you for your reply. Unfortunately, this does not solve the issue. I will try my best to explain the situation more clearly.
Here's the flow for each team:
PR is merged -> CI is triggered -> Sitespeed is run -> Grafana is updated
The HTML reports are separated, because each team has their own build agent that publishes the reports to its own location.
The problem is that in the Grafana dashboard, the measurements are grouped by domain.
I reproduced this with a local example. I have one site running on localhost:3000 and one on localhost:3001. Then I ran Sitespeed twice, once for each port. Here's the result:
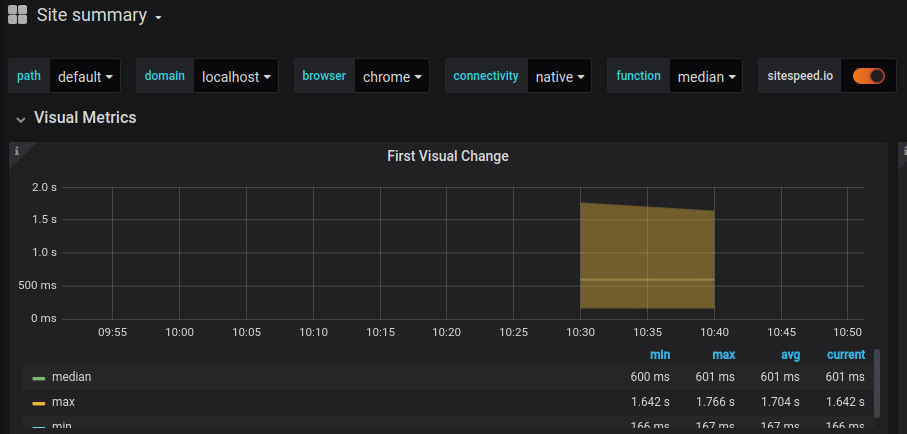
In this graph, it looks like there is one site on localhost that had a performance increase, but in reality the two measurements are unrelated. This is why I made the workaround to edit the hostnames, so you get team_a and team_b in the domain drop-down.
I did notice the path drop-down. Different paths would work in the site summary, but not in the leaderboard. For example localhost:3000/home and localhost:3001/home would not be separated.
davidgrankvist
on 22 Mar 2020
Let’s see if this helps
Have you tried using the graphite namespace parameter and then in the query
you should be able to define the alias by node to represent the numbers
clearly
Regards
Keyur
On Mar 22, 2020, at 6:26 AM, David Grankvist notifications@github.com
wrote:
Thank you for your reply. Unfortunately, this does not solve the issue. I
will try my best to explain the situation more clearly.
Here's the flow for each team:
PR is merged -> CI is triggered -> Sitespeed is run -> Grafana is updated
The HTML reports are separated, because each team has their own build agent
that publishes the reports to its own location.
The problem is that in the Grafana dashboard, the measurements are grouped
by domain.
I reproduced this with a local example. I have one site running on
localhost:3000 and one on localhost:3001. Then I ran Sitespeed twice, once
for each port. Here's the result:
In this graph, it looks like there is one site on localhost that had a
performance increase, but in reality the two measurements are unrelated.
This is why I made the workaround to edit the hostnames, so you get team_a
and team_b in the domain drop-down.
I did notice the path drop-down. Different paths would work in the site
summary, but not in the leaderboard. For example localhost:3000/home and
localhost:3001/home would not be separated.
—
You are receiving this because you commented.
Reply to this email directly, view it on GitHub
https://urldefense.proofpoint.com/v2/url?u=https-3A__github.com_sitespeedio_sitespeed.io_issues_2938-23issuecomment-2D602184471&d=DwMCaQ&c=udBTRvFvXC5Dhqg7UHpJlPps3mZ3LRxpb6__0PomBTQ&r=QdU9ynK_Pna3a4TlNm0IqSkTvAoOvgSYGNrfxhJcJgM&m=2ciqR0xkxowbzinEa8nnA6sAhCr5WoI4ZpA4mcQ2neQ&s=eEwGxrbi2072mCwnwHvTlH4VTl46MIaHDzLahWAmqLo&e=,
or unsubscribe
https://urldefense.proofpoint.com/v2/url?u=https-3A__github.com_notifications_unsubscribe-2Dauth_ABZQFCOKAEJNNMGYWVYLY6TRIXYXFANCNFSM4LQHHUXQ&d=DwMCaQ&c=udBTRvFvXC5Dhqg7UHpJlPps3mZ3LRxpb6__0PomBTQ&r=QdU9ynK_Pna3a4TlNm0IqSkTvAoOvgSYGNrfxhJcJgM&m=2ciqR0xkxowbzinEa8nnA6sAhCr5WoI4ZpA4mcQ2neQ&s=dimuGx-PTAZL7dZnvcBrSl5XztVl_lQFdeW3gtVwqwc&e=
.
softwareklinic
on 22 Mar 2020
Worst case I’m open to trying go help on Webex let me know
Regards
Keyur
On Mar 22, 2020, at 6:26 AM, David Grankvist notifications@github.com
wrote:
Thank you for your reply. Unfortunately, this does not solve the issue. I
will try my best to explain the situation more clearly.
Here's the flow for each team:
PR is merged -> CI is triggered -> Sitespeed is run -> Grafana is updated
The HTML reports are separated, because each team has their own build agent
that publishes the reports to its own location.
The problem is that in the Grafana dashboard, the measurements are grouped
by domain.
I reproduced this with a local example. I have one site running on
localhost:3000 and one on localhost:3001. Then I ran Sitespeed twice, once
for each port. Here's the result:
In this graph, it looks like there is one site on localhost that had a
performance increase, but in reality the two measurements are unrelated.
This is why I made the workaround to edit the hostnames, so you get team_a
and team_b in the domain drop-down.
I did notice the path drop-down. Different paths would work in the site
summary, but not in the leaderboard. For example localhost:3000/home and
localhost:3001/home would not be separated.
—
You are receiving this because you commented.
Reply to this email directly, view it on GitHub
https://urldefense.proofpoint.com/v2/url?u=https-3A__github.com_sitespeedio_sitespeed.io_issues_2938-23issuecomment-2D602184471&d=DwMCaQ&c=udBTRvFvXC5Dhqg7UHpJlPps3mZ3LRxpb6__0PomBTQ&r=QdU9ynK_Pna3a4TlNm0IqSkTvAoOvgSYGNrfxhJcJgM&m=2ciqR0xkxowbzinEa8nnA6sAhCr5WoI4ZpA4mcQ2neQ&s=eEwGxrbi2072mCwnwHvTlH4VTl46MIaHDzLahWAmqLo&e=,
or unsubscribe
https://urldefense.proofpoint.com/v2/url?u=https-3A__github.com_notifications_unsubscribe-2Dauth_ABZQFCOKAEJNNMGYWVYLY6TRIXYXFANCNFSM4LQHHUXQ&d=DwMCaQ&c=udBTRvFvXC5Dhqg7UHpJlPps3mZ3LRxpb6__0PomBTQ&r=QdU9ynK_Pna3a4TlNm0IqSkTvAoOvgSYGNrfxhJcJgM&m=2ciqR0xkxowbzinEa8nnA6sAhCr5WoI4ZpA4mcQ2neQ&s=dimuGx-PTAZL7dZnvcBrSl5XztVl_lQFdeW3gtVwqwc&e=
.
softwareklinic
on 22 Mar 2020
Problem solved! Thank you! :smile:
What I did:
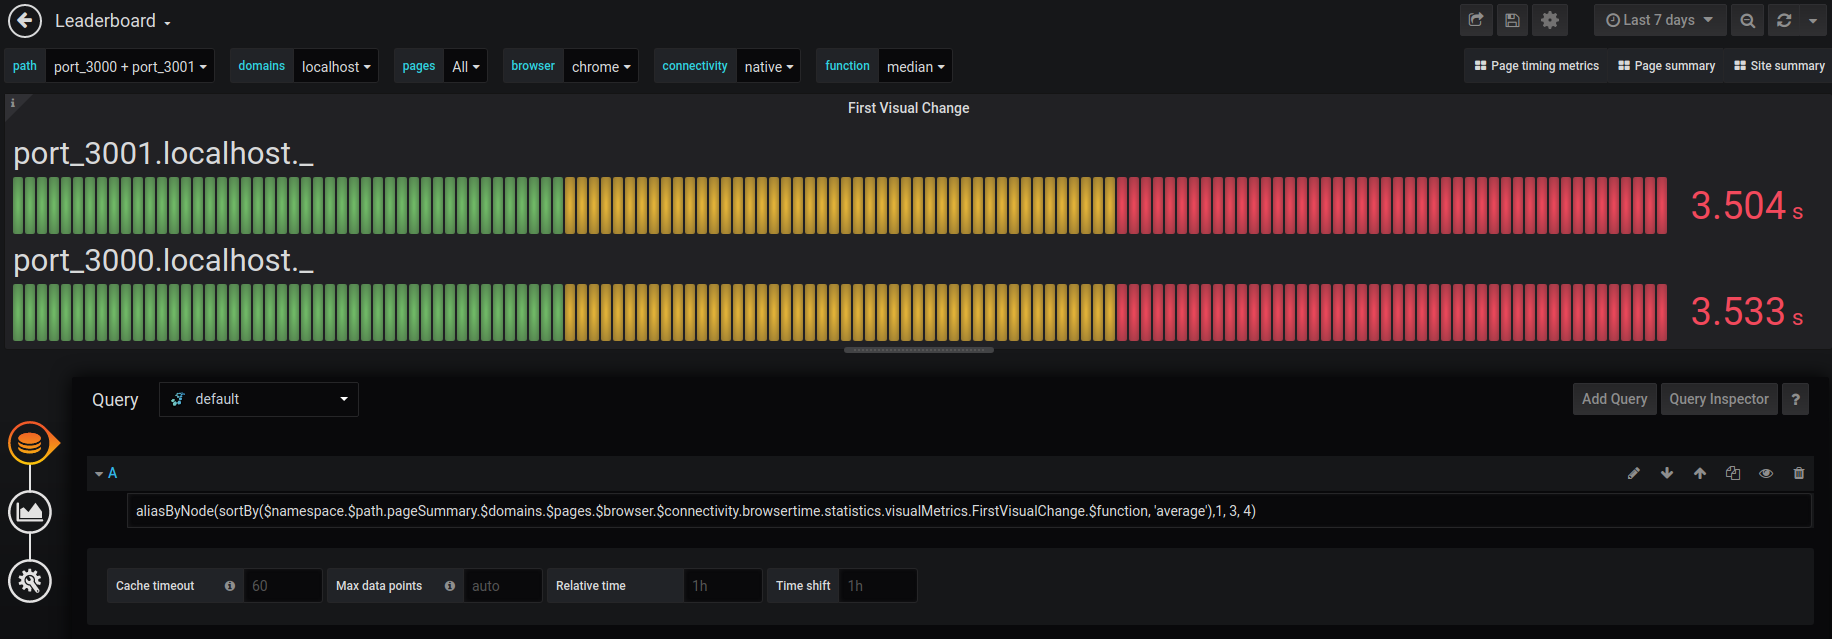
- I passed the arg
--graphite.namespace "sitespeed_io.port_$WEB_PORT". Then e.g.port_3000appears in the path drop-down. - In the leaderboard I changed
aliasByNode(..., 3, 4)toaliasByNode(..., 1, 3, 4)
Then the leaderboard looks like this
davidgrankvist
on 22 Mar 2020
Hurray - happy for you
Regards
Keyur
On Mar 22, 2020, at 3:27 PM, David Grankvist notifications@github.com
wrote:
Problem solved! Thank you! 😄
What I did:
- I passed the arg --graphite.namespace "sitespeed_io.port_$WEB_PORT".
Then e.g. port_3000 appears in the path drop-down. - In the leaderboard I changed aliasByNode(..., 3, 4) to aliasByNode(...,
1, 3, 4)
Then the leaderboard looks like this
[image: leaderboard_multiport]
https://urldefense.proofpoint.com/v2/url?u=https-3A__user-2Dimages.githubusercontent.com_1529561_77259015-2Dbe250e00-2D6c7e-2D11ea-2D8447-2D8644dd8b64a6.png&d=DwMFaQ&c=udBTRvFvXC5Dhqg7UHpJlPps3mZ3LRxpb6__0PomBTQ&r=QdU9ynK_Pna3a4TlNm0IqSkTvAoOvgSYGNrfxhJcJgM&m=T3QZsDRfa3TpWG7DGHtMNcv3iqmXNkIkSmCQix4FnHg&s=0PHfi814ZQuepoCf6vTkotZAAa5dVsO0OkDJFW5NEb0&e=
—
You are receiving this because you commented.
Reply to this email directly, view it on GitHub
https://urldefense.proofpoint.com/v2/url?u=https-3A__github.com_sitespeedio_sitespeed.io_issues_2938-23issuecomment-2D602267296&d=DwMFaQ&c=udBTRvFvXC5Dhqg7UHpJlPps3mZ3LRxpb6__0PomBTQ&r=QdU9ynK_Pna3a4TlNm0IqSkTvAoOvgSYGNrfxhJcJgM&m=T3QZsDRfa3TpWG7DGHtMNcv3iqmXNkIkSmCQix4FnHg&s=lEwCwgZMaVRXLgY06H2TJ-HTjiKvyuP_PyHO-83SOSM&e=,
or unsubscribe
https://urldefense.proofpoint.com/v2/url?u=https-3A__github.com_notifications_unsubscribe-2Dauth_ABZQFCJPL54VELJCMQ3LQVLRIZYDZANCNFSM4LQHHUXQ&d=DwMFaQ&c=udBTRvFvXC5Dhqg7UHpJlPps3mZ3LRxpb6__0PomBTQ&r=QdU9ynK_Pna3a4TlNm0IqSkTvAoOvgSYGNrfxhJcJgM&m=T3QZsDRfa3TpWG7DGHtMNcv3iqmXNkIkSmCQix4FnHg&s=Un6Us59qTNmvpfY0nRTLp_x3Uhyr3uZWheYvVeu_t7c&e=
.
softwareklinic
on 22 Mar 2020
Related issues
 thebennos
·
10Comments
thebennos
·
10Comments
 marceloboeira
·
10Comments
marceloboeira
·
10Comments
 gajus
·
9Comments
gajus
·
9Comments
 jangrewe
·
7Comments
jangrewe
·
7Comments
 mizbanpaytakht
·
8Comments
mizbanpaytakht
·
8Comments
Most helpful comment
Problem solved! Thank you! :smile:
What I did:
--graphite.namespace "sitespeed_io.port_$WEB_PORT". Then e.g.port_3000appears in the path drop-down.aliasByNode(..., 3, 4)toaliasByNode(..., 1, 3, 4)Then the leaderboard looks like this
