Sitespeed.io: --multi recording network (maybe even more..?) calls prior to measure.start
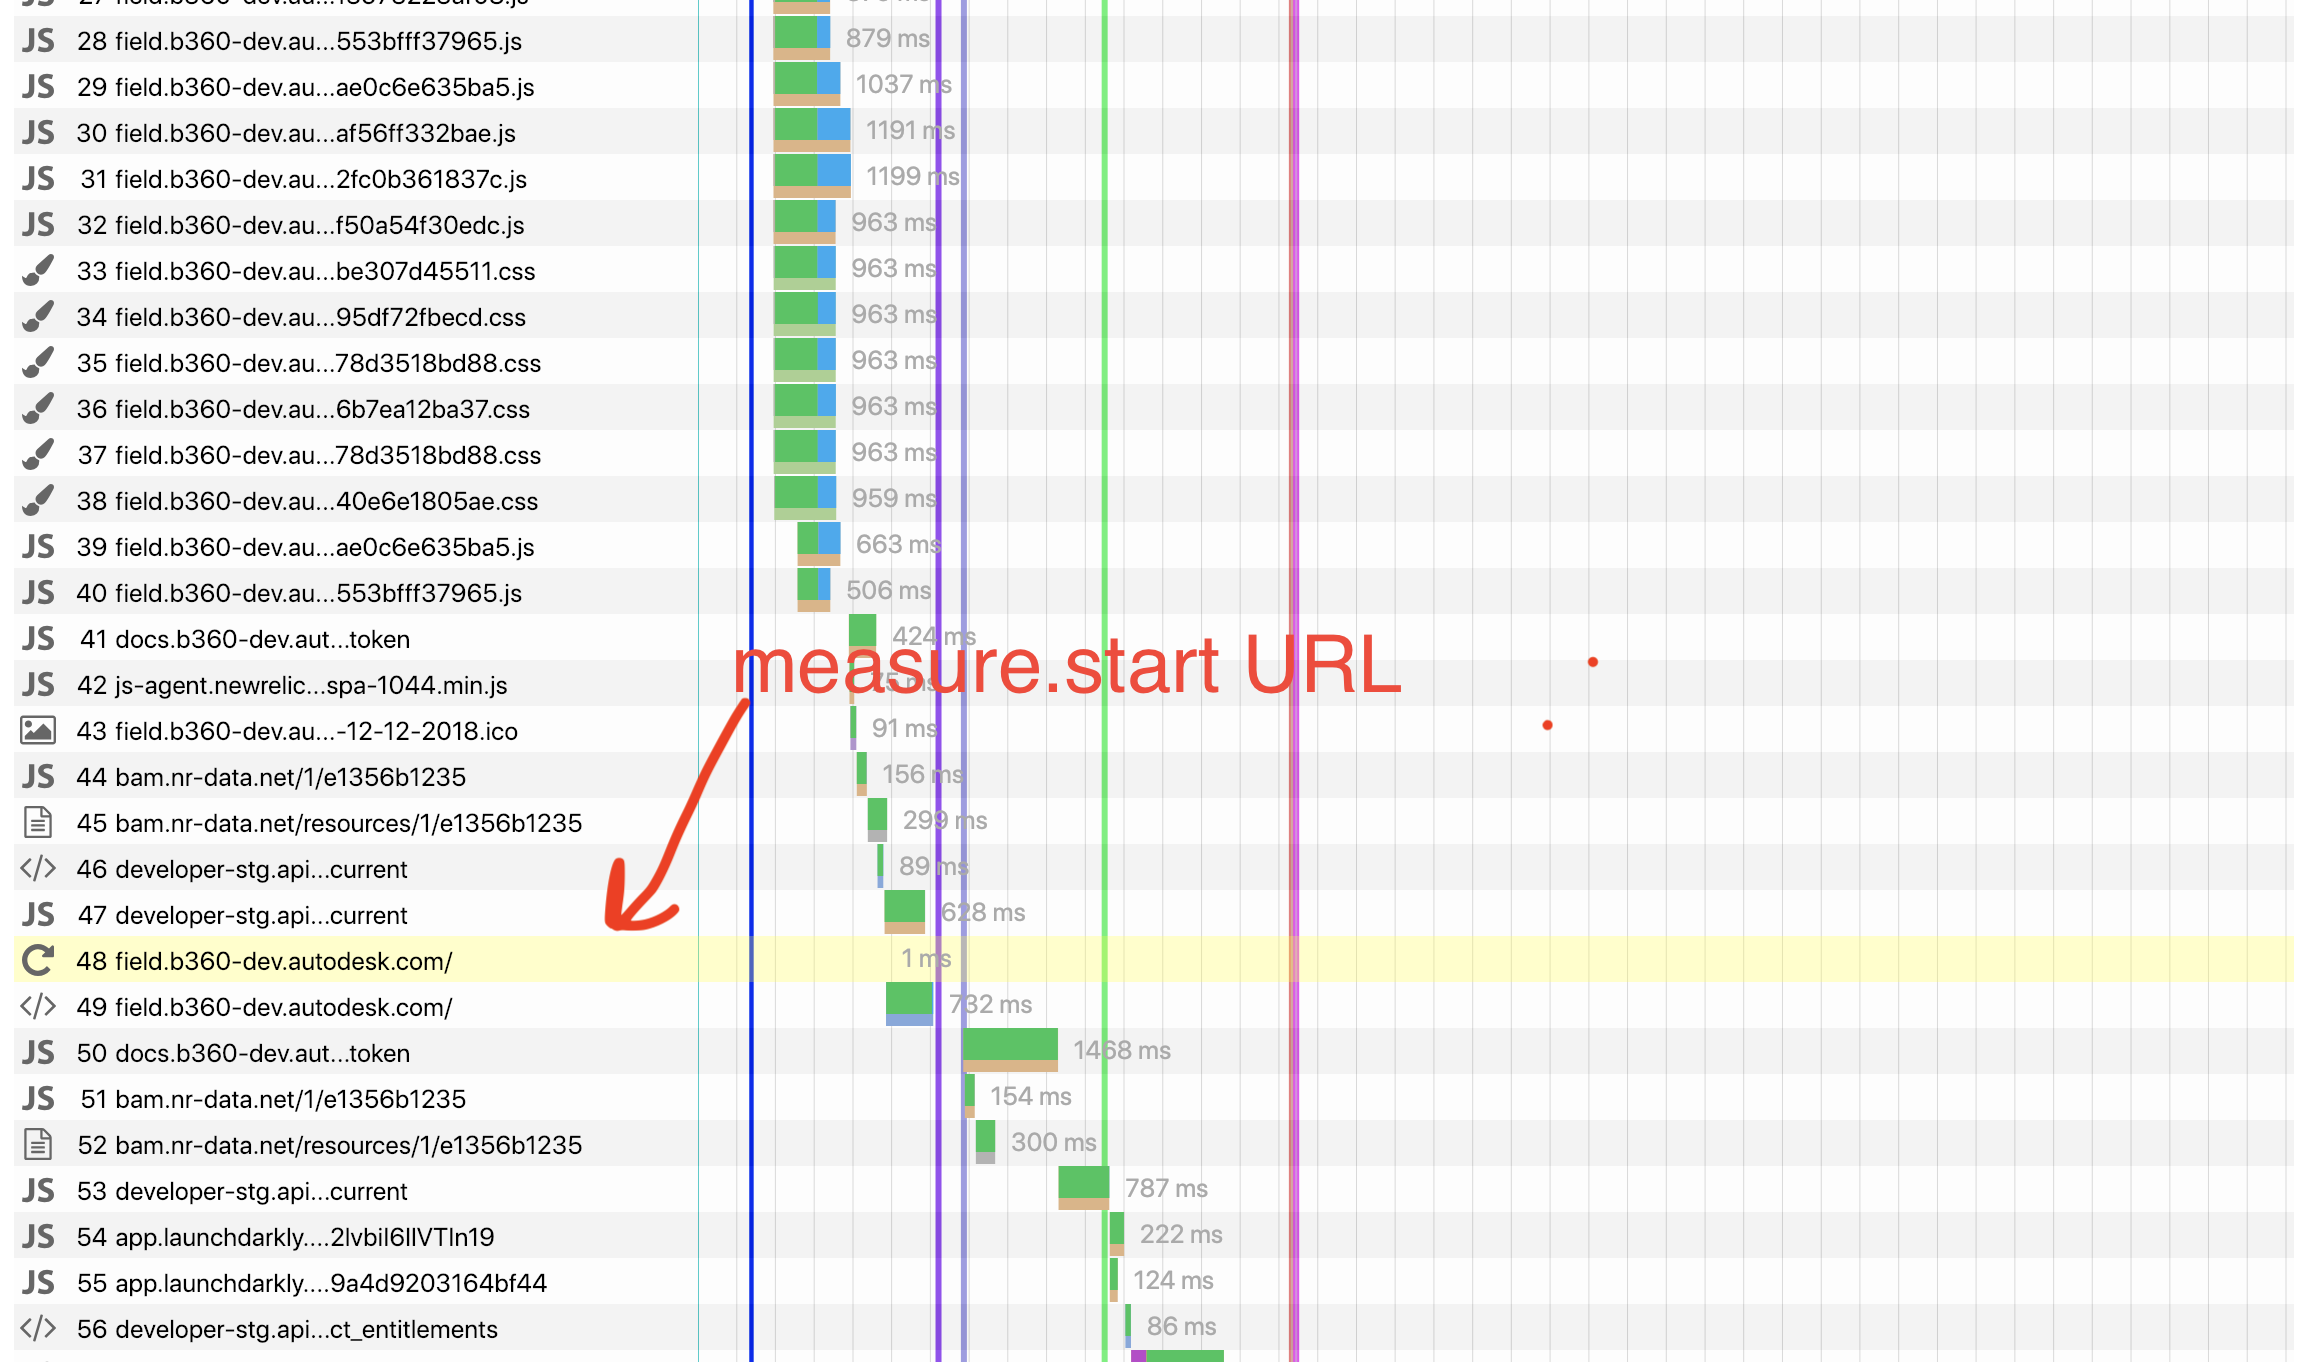
I've noticed that in the waterfall of my --multi script results, there are lines before the URL that is being measured in measure.start.
That could also mean that maybe other things are being recorded and maybe even the results take into account the steps before measure.start, which of course means wrong results.
Here is a waterfall example with the URL being measured highlighted:
And here is my script:
module.exports = async function(context, commands) {
  const login = 'https://hello.com';
  let redirectURL;
  let loadTimeout;

  // If we would like to test in no cache mode or not
  if (context.options.my.nocache) {
    redirectURL = login;
    loadTimeout = 1000;
    context.log.warn('Cache simulation: cache disabled - simulating first comer');
  } else {
    redirectURL = context.options.my.url;
    // We're doing a long timeout so the page will have chance to load all
    // the required items to simulate a page refresh
    loadTimeout = 6000;
    context.log.warn('Cache simulation: cache enabled - simulating page refresh');
  }

  let loginURL = `${login}/session?redirect=${encodeURIComponent(redirectURL)}`;

  // Navigate to login page
  await commands.navigate(loginURL);

  // Login
  await commands.click.byId('sign_in');
  await commands.wait.byId('loginframe', 2000);
  await commands.switch.toFrame('loginframe');

  await commands.addText.byId(context.options.my.userName, 'userName');
  await commands.click.byId('verify_user_btn');
  await commands.wait.byTime(1000);

  await commands.wait.byId('password', 5000);
  await commands.addText.byId(context.options.my.password, 'password');
  await commands.click.byId('btnSubmit');

  // Wait for login to be done depending on the need to reuse cache or not
  context.log.info('Done login step, waiting for redirect to finish');
  await commands.wait.byTime(loadTimeout);

  // Start the measuring of the performance of the tested URL
  return commands.measure.start(context.options.my.url);
};
More info
Version: 8.0.0
 kazazor
All 44 comments
Hi @kazazor this seems like a bug. Do you use Chrome? Do you get the same behavior in both browsers?
Best
Peter
 soulgalore
on 22 Jan 2019
soulgalore
on 22 Jan 2019
Looked at the code and this is how looks like: We empty the trace logs (that is used to create the HAR file), then start the video, then navigate.
So if you are using video and Chrome that could be it. Let me move so we clear the trace just before we navigate instead.
soulgalore
on 22 Jan 2019
Thanks for looking at it, glad I could help :)
Does that also influence the measurement results? Meaning visual % loading time is wrong? Or just the waterfall gets affected but the results are still correct?
And yes, I use Chrome and haven't tested Firefox yet.
kazazor
on 22 Jan 2019
Only the HAR.
I'll do a release later today with a fix but if you also can do a run with --browsertime.chrome.collectPerfLog trueonce and send the chromePerflog-1.json.gz to me, then I can try it out in https://github.com/sitespeedio/chrome-har that generates the HAR.
soulgalore
on 22 Jan 2019
And btw thanks for taking the time to write a good bug report + really like your example with the scripting!
soulgalore
on 22 Jan 2019
Still looking at the waterfall it be something more ...hmm, that page should have finished loading right? Did the video look ok?
soulgalore
on 22 Jan 2019
The video looked OK, but a bit hard to say since both the pages (the login and the redirect one) starts the same way.. So could have been that the first page loaded and then it moved to the second one which starts the same.
Which by the way got me thinking that I would really love it if the URL could be printed on the video when it changes so we could know things like that..
This is very useful IMO when you app switches URLs a lot (even from http to https upon redirect..). WIll help debug performance IMO.
WDYT? I can open a new issue for that.
This is not a full waterfall image, sorry if I didn't mention it. The page which I used in measure.start finished loading just fine.
I've sent you the chromePerflog-1.json.gz file via email.
kazazor
on 22 Jan 2019
Thanks for the log!
In your script, what about changing await commands.wait.byTime(loadTimeout); to wait on some really late element that appears on the page? I'm just thinking that the redirect/page load isn't finished? You could also try changing await commands.click.byId('btnSubmit'); to await commands.click.byIdAndWait('btnSubmit'); so that the normal page complete check runs before the next step?
soulgalore
on 22 Jan 2019
In your script, what about changing await commands.wait.byTime(loadTimeout); to wait on some really late element that appears on the page? I'm just thinking that the redirect/page load isn't finished? You could also try changing await commands.click.byId('btnSubmit'); to await commands.click.byIdAndWait('btnSubmit'); so that the normal page complete check runs before the next step?
I can see why that may be true for a lot of websites, but in my case when I do want to have a cache (loadTimeout === 6000) I only need about 2-4 seconds to load the things I wish to have in my cache that matters to me.. So only having 6000 ms for my cache to load makes sense in my case.
If I go with the approach of waitiing for some really late element / use byIdAndWait it will take me longer to actually start my testings (which in my case every seconds counts when I want to run 30+ iterations).
This is basically my way to use a script in nocache/cache mode when I cannot set the cookie to a different domain.
No cache mode:
I redirect the login to page X, wait for 1 second and then navigate and start to measure on page Y (that way I do not have cache of page Y).
Cache mode:
I redirect the login to page Y, waits for just 6 seconds (instead of more, I don't need more) and then start the measurement on page Y (basically like a page refresh of the user).
I'm open for changes if you see anything I can do :)
kazazor
on 22 Jan 2019
Yeah I think you should wait for the page to finish loading before you start loading the next one :D
soulgalore
on 22 Jan 2019
Maybe after we'll improve some performance since 30 runs takes me about 30 minutes to run currently ;)
For now, it's ok and I do not need to wait for the other page to load in order to achieve a true user experience (in our case, might not be right for others..).
We'll improve it and then we could wait longer in between :)
kazazor
on 22 Jan 2019
@soulgalore I can confirm that version 8.0.2 fixed the problem!
Thanks :)
kazazor
on 22 Jan 2019
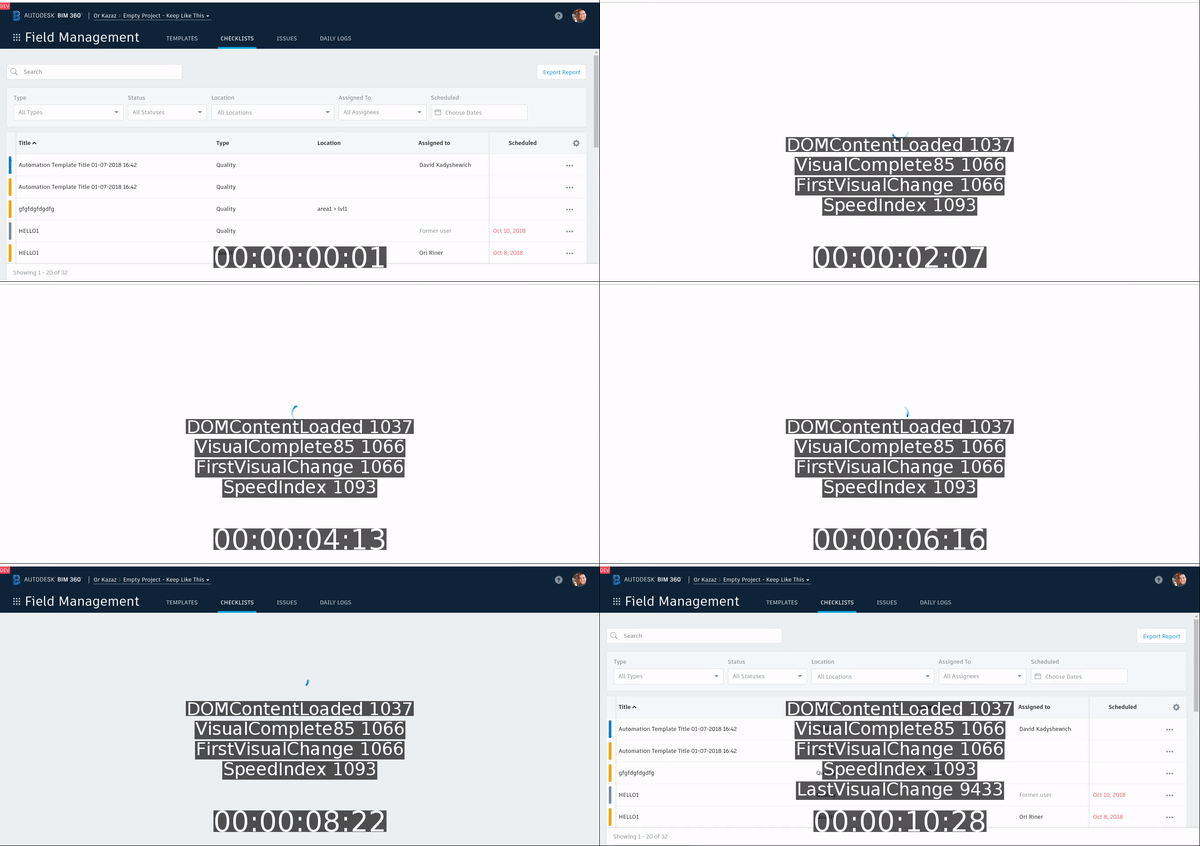
Sorry for closing that too fast. I do see now that the video is a bit wrong. It starts from the previously loaded page before the measure.start. Is that intended?
I converted the video to git so I could share it here.
You could see a full page before it goes white again.
kazazor
on 22 Jan 2019
Yeah but that's how Chrome works? It will not remove anything between page load, so if you visit multiple pages each video will start with the content of the page that you visited before that.
Depending on how you navigate, you can run JavaScript that removes the body, so that the screen is cleared with https://www.sitespeed.io/documentation/sitespeed.io/scripting/#jsrunjavascript - I'll add an example the coming days.
soulgalore
on 22 Jan 2019
Yep, makes sense.
So I'll close this issue now and wait for the js example to give it a go :)
kazazor
on 22 Jan 2019
@kazazor run document.body.innerHTML = "" bot if you click on a link you need to do it after that so ... maybe it doesn't work. I've only used it when I use measure to navigate.
soulgalore
on 22 Jan 2019
@soulgalore I think that maybe we need to reopen this problem.
I noticed something very strange with the data this situation produces.
I noticed that the video itself takes about 7 seconds to load, but in the same time I see:
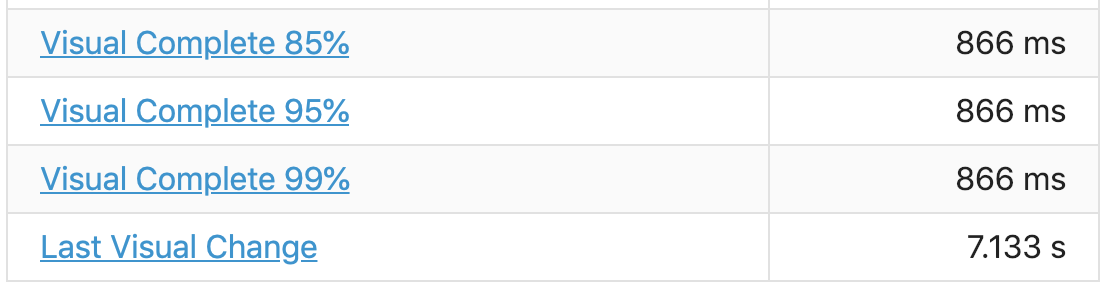
From looking at the video it seems that the 85,95 & 99 % are being taken from the moment the page that was loaded before changed to the blank page when it navigates to the new URL mentioned in the measure.start command.
That means that the data is being broken when I navigate between pages (which this case shows..).
I wish my website would take only 866 ms :D
kazazor
on 23 Jan 2019
Here is the updated script I use per your feedback:
module.exports = async function(commands, userName, password, loginURL, nocache = false) {
    // Navigate to login page
    await commands.navigate(loginURL);

    // Login
    await commands.click.byId('sign_in');
    await commands.wait.byId('loginframe', 5000);
    await commands.switch.toFrame('loginframe');

    await commands.wait.byId('userName', 10000);
    await commands.addText.byId(userName, 'userName');
    await commands.click.byId('verify_user_btn');
    await commands.wait.byTime(1000);

    await commands.wait.byId('password', 10000);
    await commands.addText.byId(password, 'password');

    if (nocache) {
      // If no cache is needed, don't wait for the page to load and move quickly to the next step
      await commands.click.byId('btnSubmit');
      await commands.wait.byTime(1000);
    } else {
      // Waits for normal page complete check to be over in order to
      // load cache in the browser's session
      await commands.click.byIdAndWait('btnSubmit');
    }
};
And after that finishes, I call immediately to:
logger.info('Done with login step');

// Start the measuring of the performance of the tested URL
return commands.measure.start(context.options.my.url);
Hey @kazazor
yeah but I think your hack of not waiting for the page load to finish is the thing that makes it break right? The other use case works for you?
Best
Peter
soulgalore
on 23 Jan 2019
The hack was never on the measured page. It was always on the page before the measurement started.
But even with that, please note I shared the new script which doesn't do it anymore and uses your advice by using await commands.click.byIdAndWait('btnSubmit'); before the measure.start command (nocache === false).
kazazor
on 23 Jan 2019
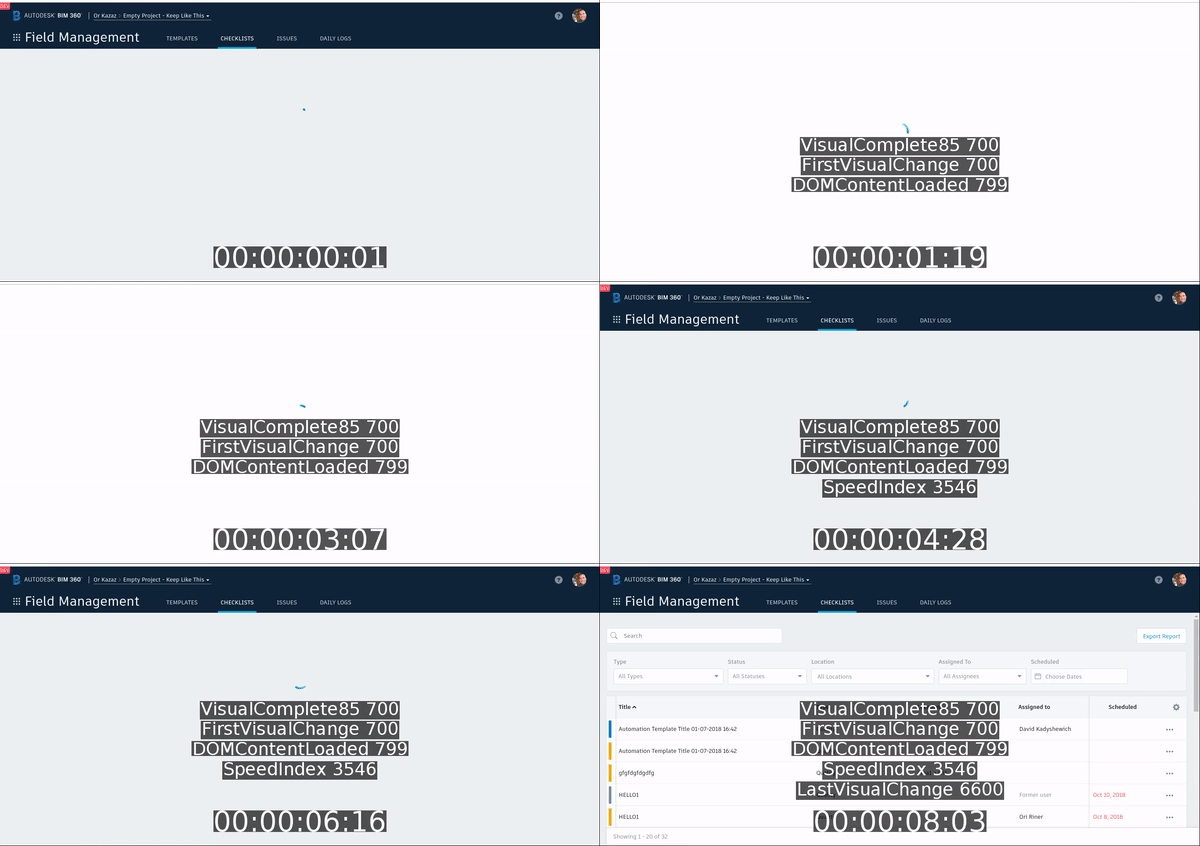
And here is the video for example:
kazazor
on 23 Jan 2019
Yeah I see, it looks strange, it doesn't look like 85% ready.
I'll check the code if there's a bug. I also need the original file (the file with orange frames before the start) so I can run it through Visual Metrics standalone and see what's going on. Keep the original file with --browsertime.videoParams.keepOriginalVideo.
Also if you go to the result page in the HTML and click "Metrics" tab and check the Visual Progress graph to the right, can you share that graph too, that is generated from metrics from Visual Metrics.
Thanks!
soulgalore
on 23 Jan 2019
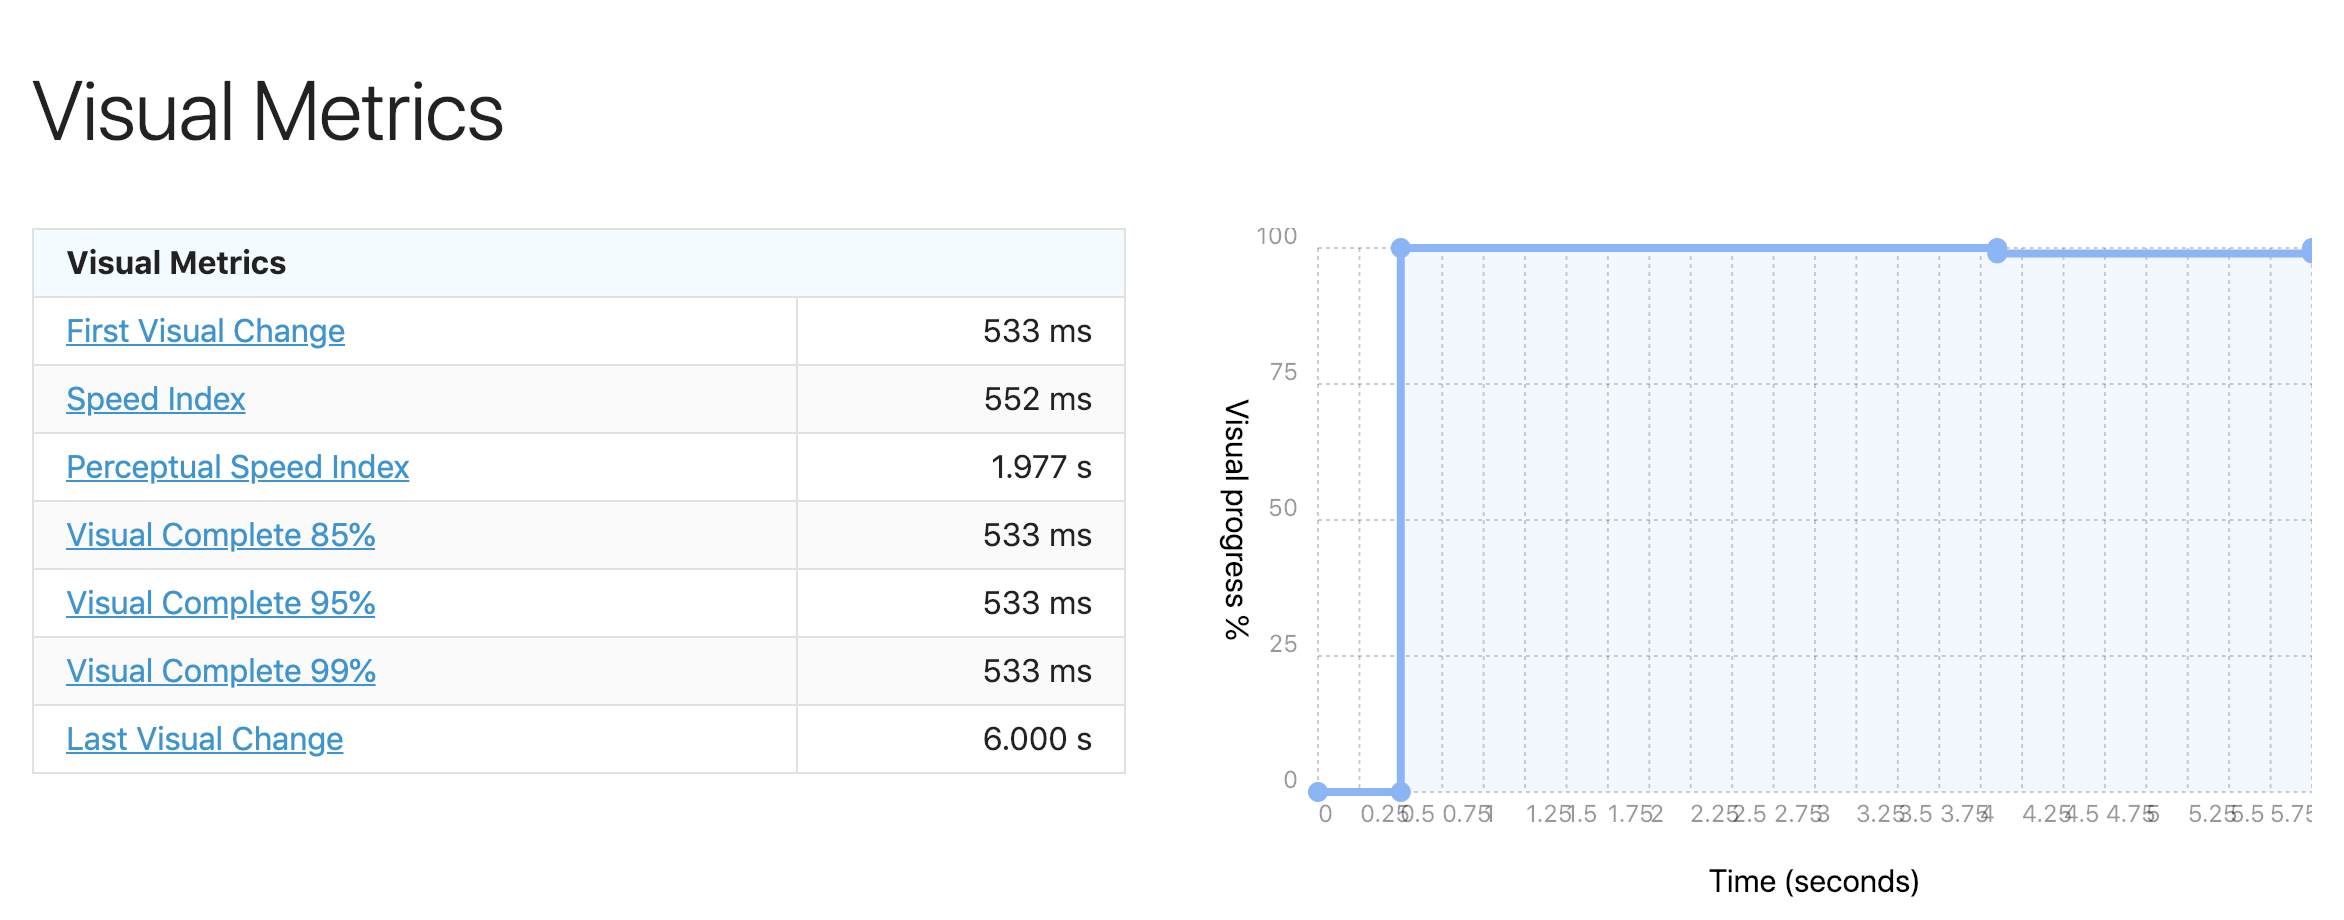
And the original video as GIF (also sent it to you via email is the case you need it and not GIF) :

Can you share a bit what's the orange frame and how that will help you debug the problem?
kazazor
on 23 Jan 2019
Thanks for sharing, I'll test it tonight.
The orange fram is used to know when navigation starts, you can read little about how it all works: https://www.sitespeed.io/documentation/sitespeed.io/video/#the-stack-easy-with-docker
soulgalore
on 23 Jan 2019
Ok one bug is that we pick the first time it reaches 85% but when I run it locally it actually looks like this:
0=0%, 500=99%, 900=99%, 1034=66%, 1234=66%, 1300=66%, 1367=66%, 1400=66%, 1434=66%, 1467=66%, 1500=66%, 1534=66%, 1567=66%, 1600=66%, 1634=66%, 1667=66%, 1700=66%, 1734=66%, 1767=66%, 1800=66%, 1834=66%, 1867=66%, 1900=66%, 1934=66%, 1967=66%, 2000=66%, 2034=66%, 2067=66%, 2100=66%, 2134=66%, 2167=66%, 2200=66%, 2234=66%, 2267=66%, 2300=66%, 2334=66%, 2367=66%, 2400=66%, 2434=66%, 2467=66%, 2500=66%, 2534=66%, 2567=66%, 2600=66%, 2634=66%, 2667=66%, 2700=66%, 2734=66%, 2767=66%, 2800=66%, 2834=66%, 2900=66%, 2967=66%, 3034=66%, 3100=66%, 3167=66%, 3234=66%, 3300=66%, 3334=66%, 3367=66%, 3400=66%, 3434=66%, 3467=66%, 3500=66%, 3534=66%, 3567=66%, 3600=66%, 3634=66%, 3667=66%, 3700=66%, 3734=66%, 3767=66%, 3800=66%, 3834=66%, 3867=66%, 3900=66%, 3934=66%, 3967=66%, 4000=66%, 4034=66%, 4100=66%, 4134=66%, 4167=66%, 4200=66%, 4234=66%, 4267=66%, 4300=66%, 4334=66%, 4367=66%, 4400=66%, 4434=66%, 4467=66%, 4500=66%, 4534=66%, 4567=88%, 4600=88%, 4634=88%, 4667=88%, 4700=88%, 4734=88%, 4767=88%, 4800=88%, 4834=88%, 4867=88%, 4900=88%, 4934=88%, 4967=88%, 5000=88%, 5034=88%, 5067=88%, 5100=88%, 5134=88%, 5167=88%, 5200=88%, 5234=88%, 5267=88%, 5300=88%, 5334=88%, 5367=88%, 5400=88%, 5434=88%, 5467=88%, 5500=88%, 5534=88%, 5567=88%, 5600=88%, 5634=88%, 5667=88%, 5700=88%, 5734=88%, 5800=88%, 5834=88%, 5867=88%, 5900=88%, 5934=88%, 5967=88%, 6000=88%, 6034=88%, 6067=88%, 6100=88%, 6134=88%, 6167=88%, 6200=88%, 6234=88%, 6267=88%, 6300=88%, 6334=88%, 6367=88%, 6400=88%, 6434=88%, 6467=88%, 6500=88%, 6534=88%, 6567=88%, 6600=100%
I'll fix that tonight. But that doesn't map the graph you sent, so maybe there's a bug there too.
soulgalore
on 23 Jan 2019
Actually it seems to be a bug in our version of Visual Metric could be that I've missed to upgrade to latest version, I'll have a look.
soulgalore
on 23 Jan 2019
I've updated Visual Metrics but I need to do some more testing before I release it. Thanks for sharing the video @kazazor without it I couldn't have understood the problem :)
soulgalore
on 23 Jan 2019
I've pushed a new version with the two fixes but since the change in Visual Metrics could potentially change metrics, I wanna run it on dashboard.sitespeed.io for some time. I'll ping this issue when I know that it's ok or need to do more fixes.
soulgalore
on 24 Jan 2019
Thanks @soulgalore ! I'll give it a go to the new version and wait for your confirmation regarding if it's stable or not.
kazazor
on 24 Jan 2019
@kazazor there's new version out now that you should use when you have time!
soulgalore
on 24 Jan 2019
Thanks @soulgalore , I just tried it.
Unfortunately, I see the problem remains the same in version 8.0.4:
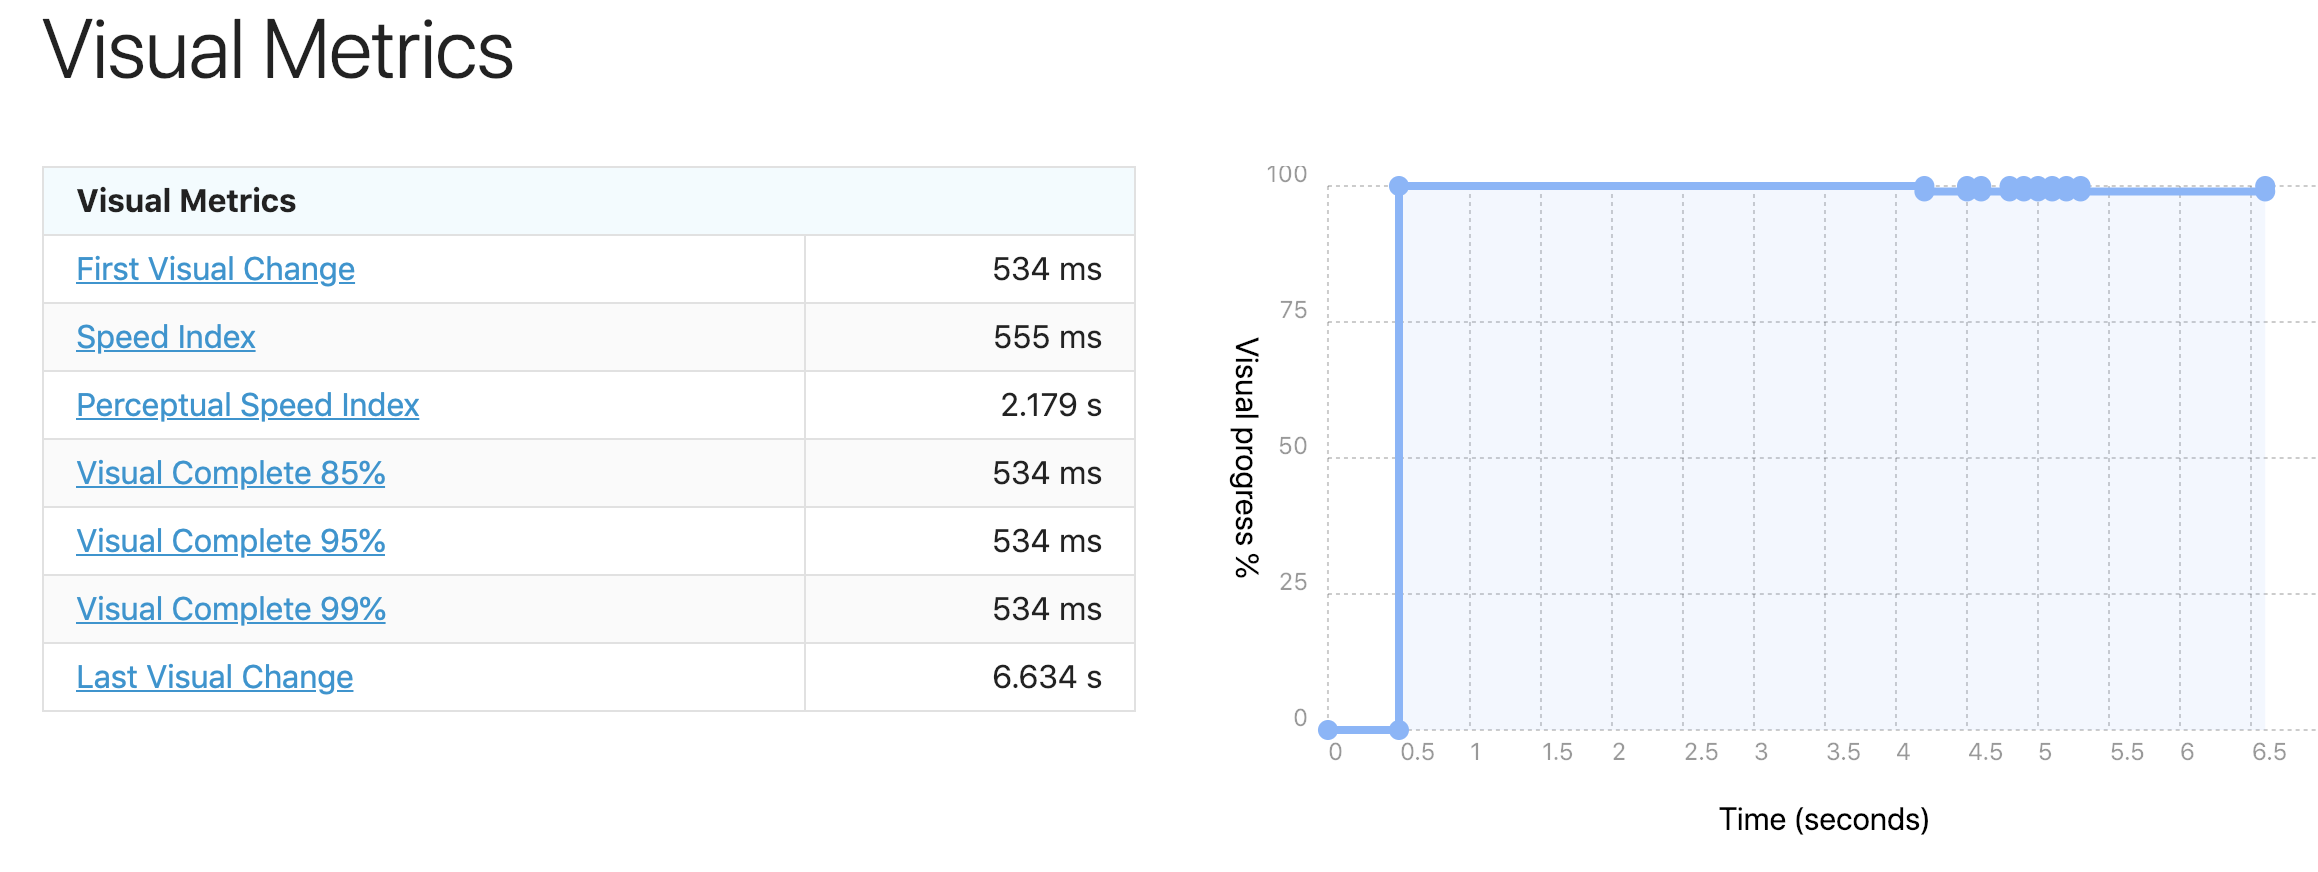
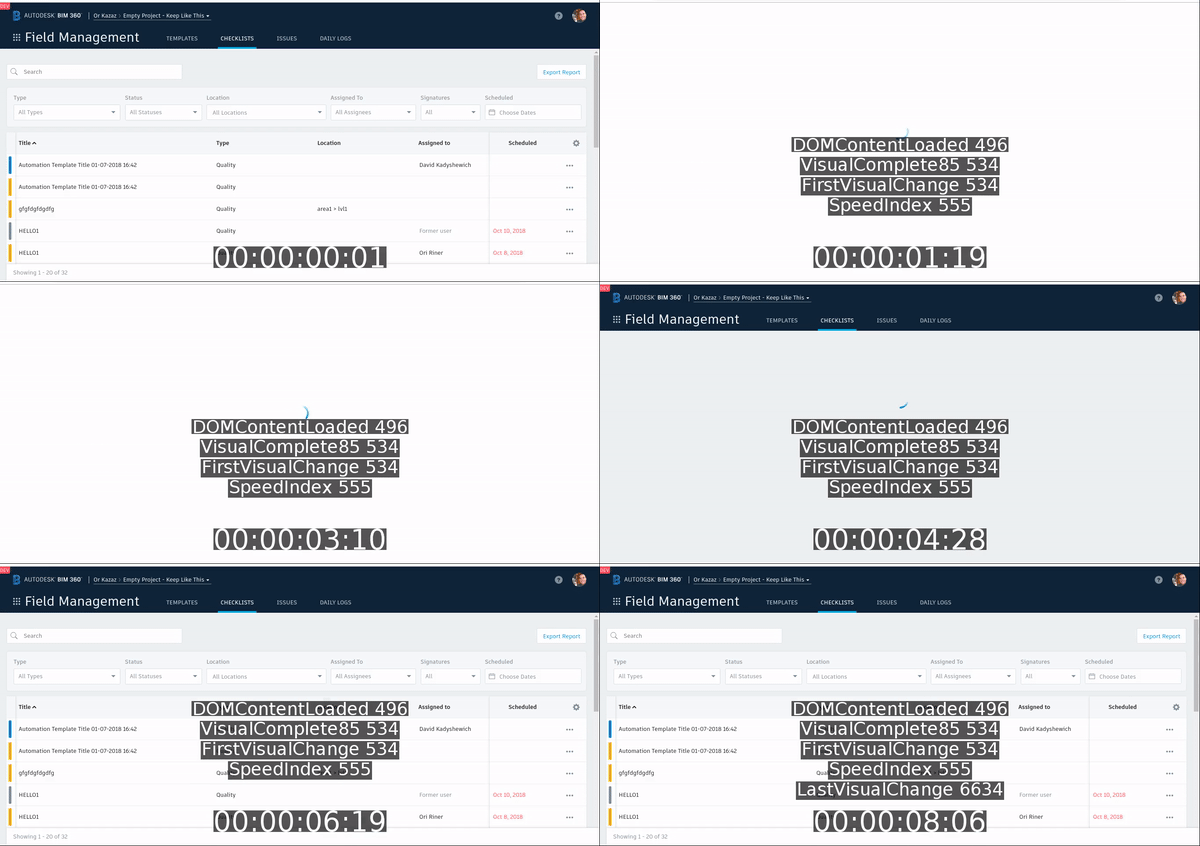
kazazor
on 24 Jan 2019
I don't know if it's related or not, but I started getting almost 90% of the times this error:
[2019-01-24 20:35:35] ERROR: Failed to wait BrowserError: Running page complete check
return (function(waitTime) {
  const timing = window.performance.timing;
  const p = window.performance;
  const resourceTimings = p.getEntriesByType('resource');
  if (resourceTimings.length > 0) {
    const lastEntry = resourceTimings.pop();
    const stop = p.now() - lastEntry.responseEnd > waitTime;
    if (stop) {
      // empty resource timings for the next run
      p.clearResourceTimings();
      return true;
    }
  }
  else return false;
})(arguments[arguments.length - 1]);
 took too long
[2019-01-24 20:35:35] ERROR: Could not load URLUrlLoadError: Failed to wait
[2019-01-24 20:35:35] ERROR: UrlLoadError: Failed to load http://field.b360.autodesk.com
    at SeleniumRunner.loadAndWait (/usr/src/app/node_modules/browsertime/lib/core/seleniumRunner.js:212:13)
[2019-01-24 20:35:35] ERROR: TypeError: Cannot read property 'replace' of null
    at /usr/src/app/node_modules/browsertime/lib/support/pathToFolder.js:40:37
    at Array.forEach (<anonymous>)
    at module.exports (/usr/src/app/node_modules/browsertime/lib/support/pathToFolder.js:39:18)
    at Collector.perIteration (/usr/src/app/node_modules/browsertime/lib/core/engine/collector.js:176:19)
    at Engine.runByScript (/usr/src/app/node_modules/browsertime/lib/core/engine/index.js:118:23)
    at process._tickCallback (internal/process/next_tick.js:68:7)
Here is the script:
    // Navigate to login page
    await commands.navigate(loginURL);

    // Login
    await commands.click.byId('sign_in');
    await commands.wait.byId('loginframe', 5000);
    await commands.switch.toFrame('loginframe');

    await commands.wait.byId('userName', 10000);
    await commands.addText.byId(userName, 'userName');
    await commands.click.byId('verify_user_btn');
    await commands.wait.byTime(1000);

    await commands.wait.byId('password', 10000);
    await commands.addText.byId(password, 'password');

    // Waits for normal page complete check to be over in order to
    // load cache in the browser's session
    await commands.click.byIdAndWait('btnSubmit');

   logger.info('Done with login step');

   // Start the measuring of the performance of the tested URL
   return commands.measure.start(context.options.my.url);
hmm it looks like the change didn't rolled out as it should, let me have a look.
For the page timeout: There's no change that should have anything to do with it. How long time does it take before it happens? There's a config for that --browsertime.timeouts.pageCompleteCheck (in ms) but that is 5 minutes so it looks like it doesn't work.
soulgalore
on 24 Jan 2019
I don't know if it's related or not, but I started getting almost 90% of the times this error:
I tested now, your page has changed. There a 2f step popup that comes up and then the script will not work.
soulgalore
on 25 Jan 2019
Also are you really sure you tested with the latest version? When I don't hit the 2f it seems to me that it works better than before:
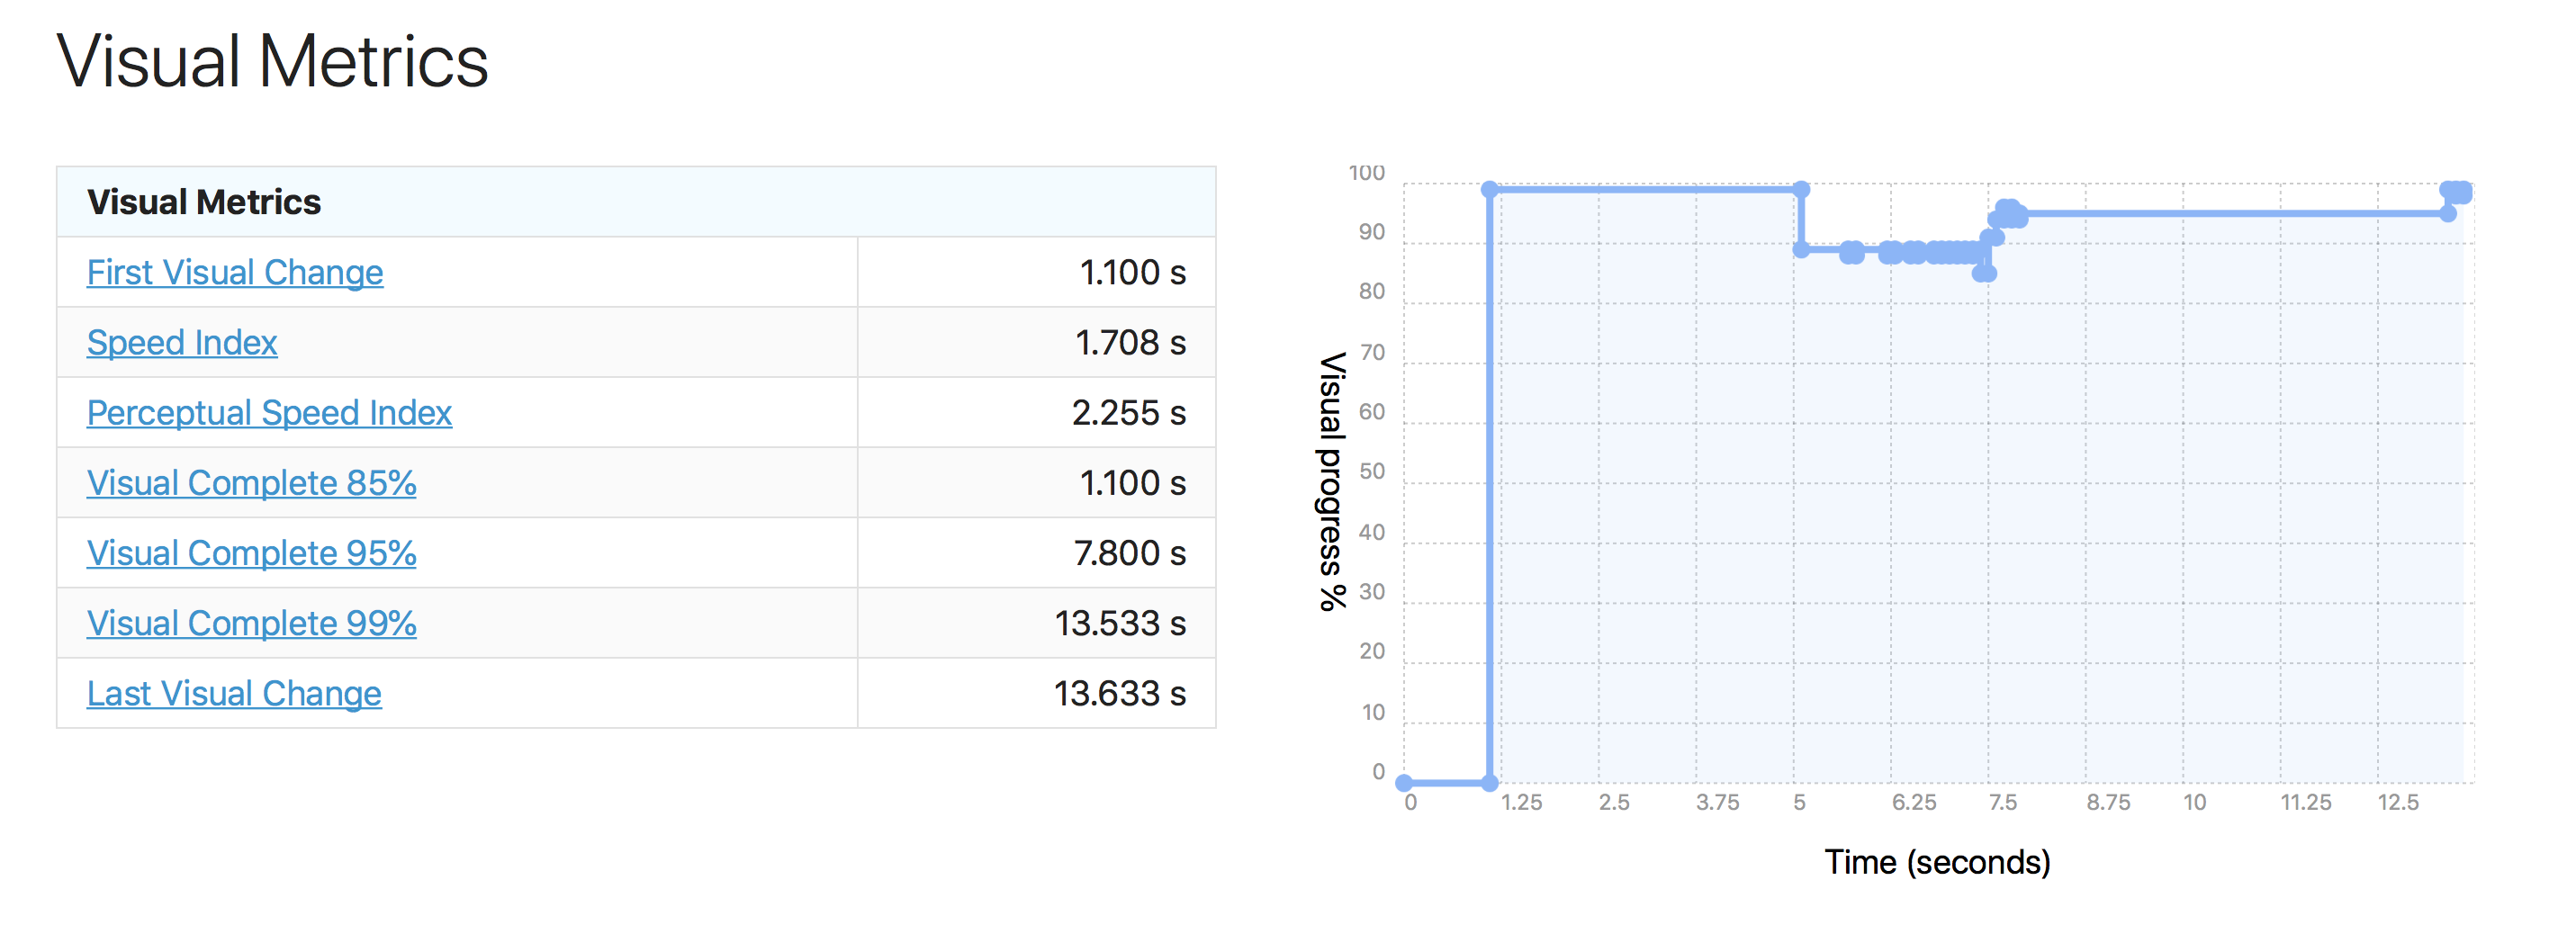
soulgalore
on 25 Jan 2019
Yep, I tested with 8.0.4
You're right that there was a pop up of the marketing team, I've disabled it now.
However, I still see the same problem:
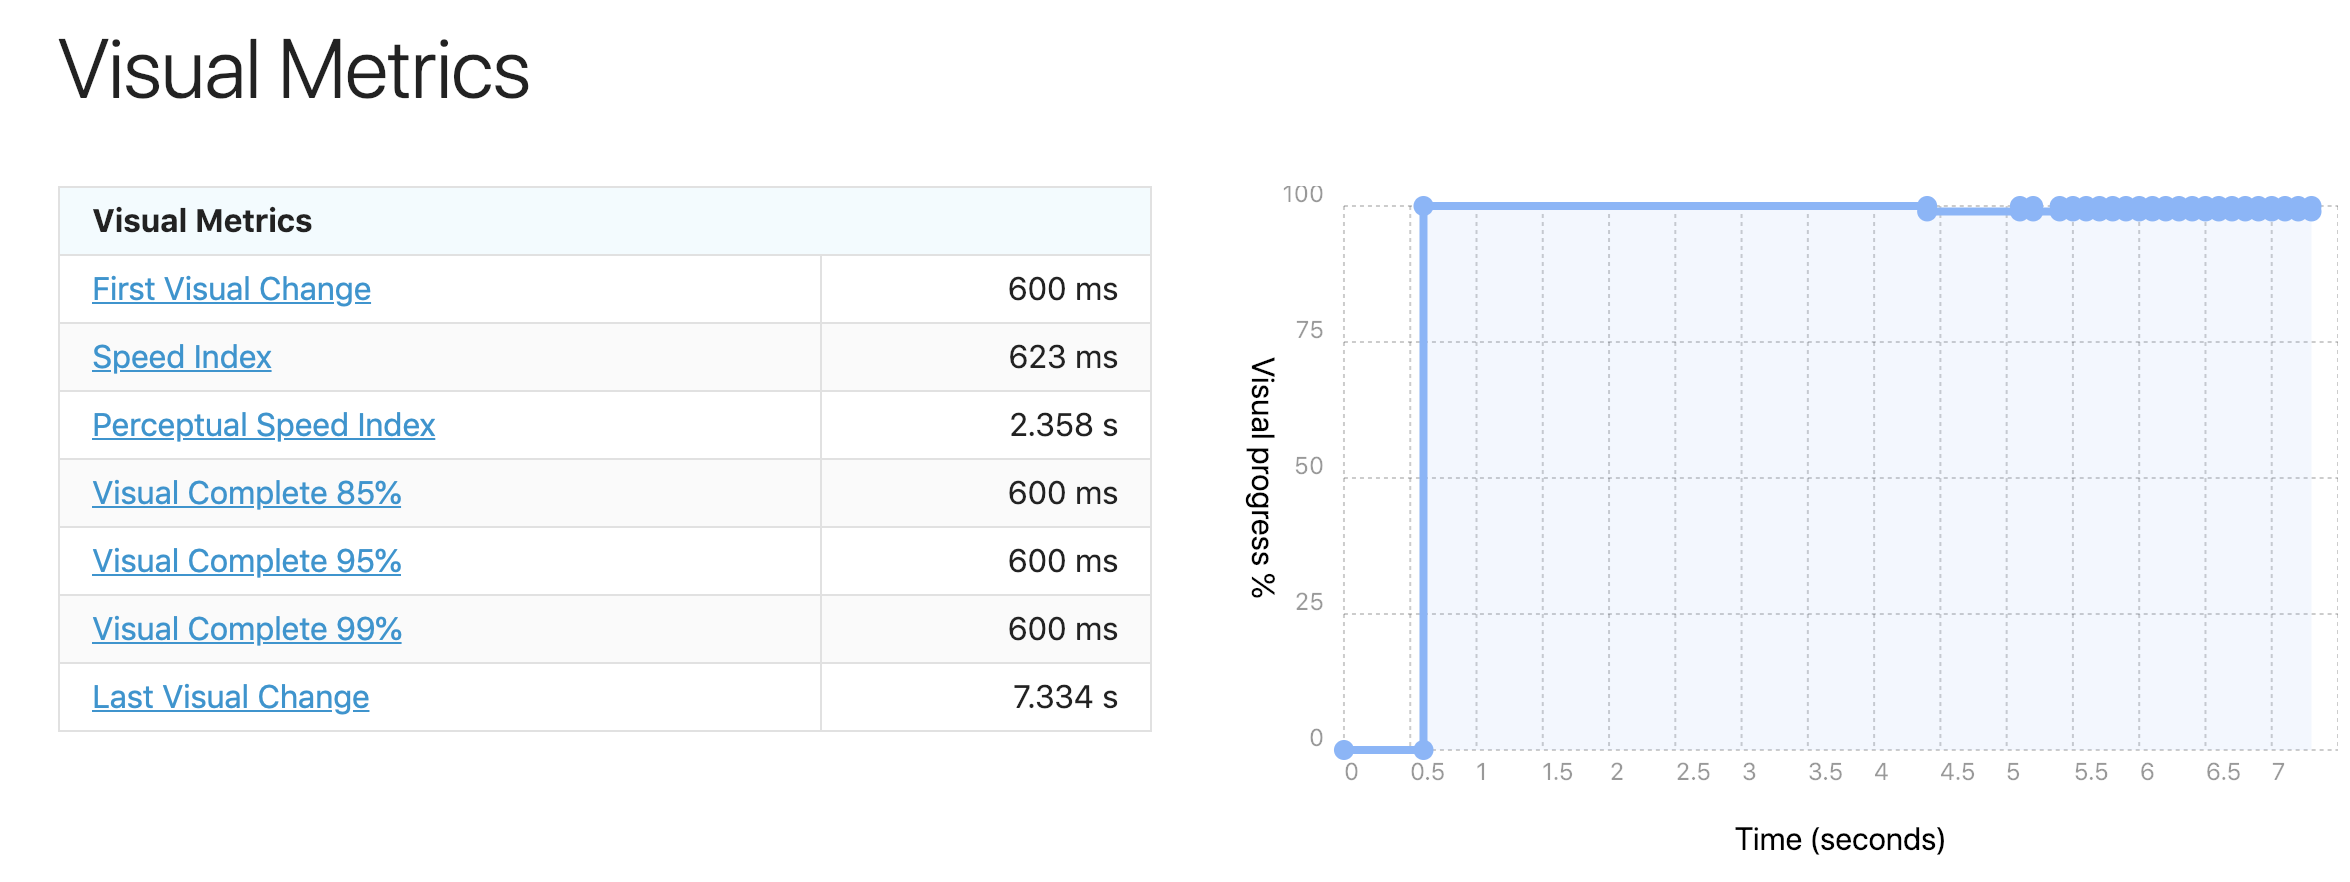
This was on our Dev env.
On our production env (which is identical) I can't get it to work, it always hits a timeout when waiting for the page complete check.
I checked there and there are no pop-ups or anything like that.. Just doesn't work.
How can I provide more information here? What can I contribute more?
kazazor
on 25 Jan 2019
First on your dev environment: Did you check your video? So the problem (at least for me) when I do 3 runs on your dev different things are displayed, sometimes I get "Something went wrong on our end, our development team has automatically been notified" or something like that and then the visual progress looks as your example, but that's right because first screen and the last is the same? I see this only on the video though so maybe the screenshot is taken at the wrong time.
When I don't get the error it looks like this:
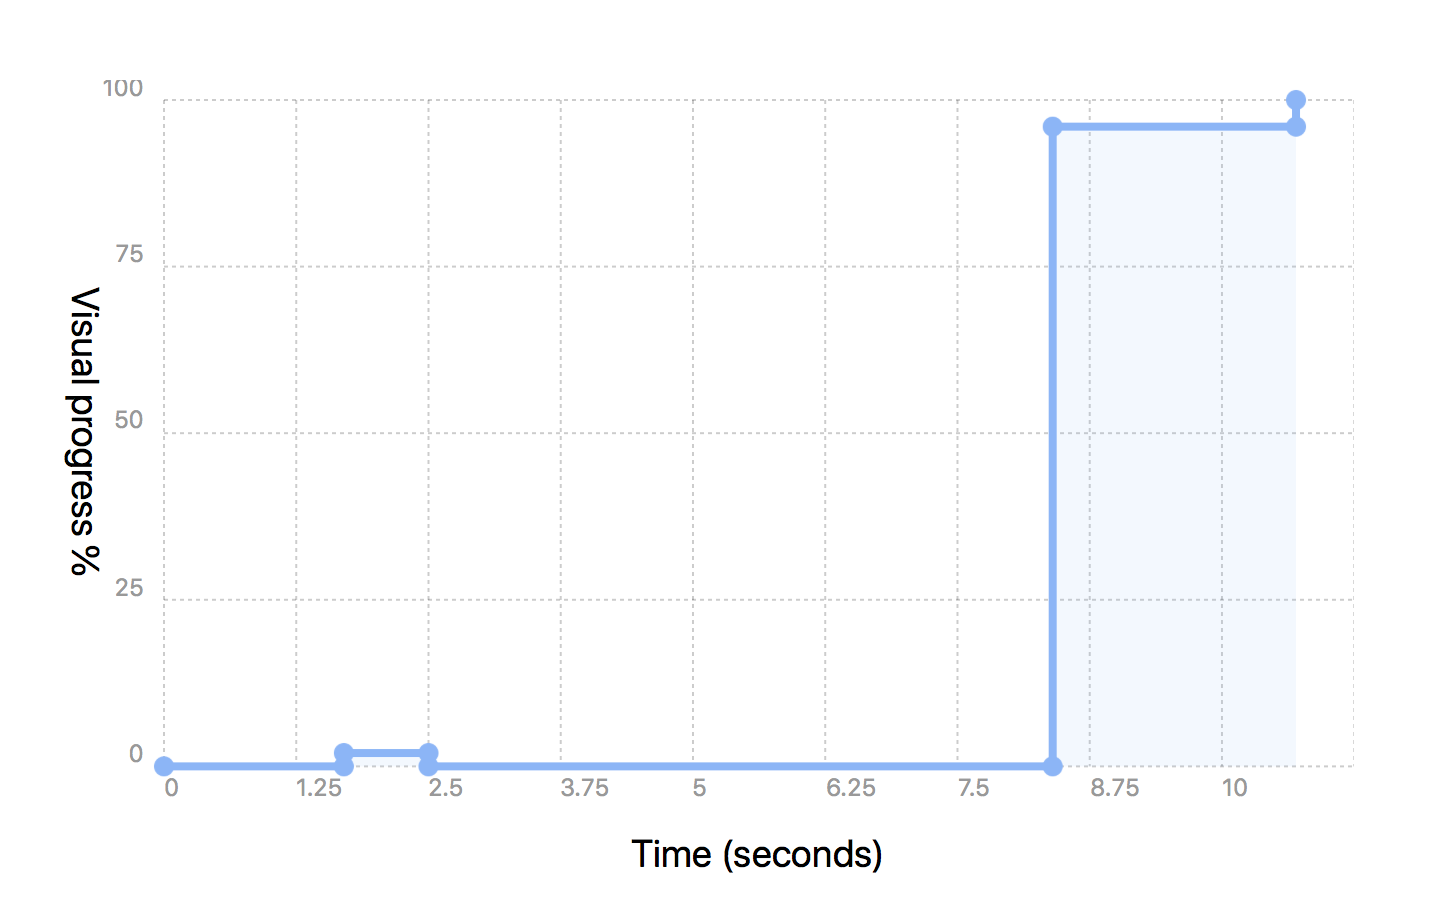
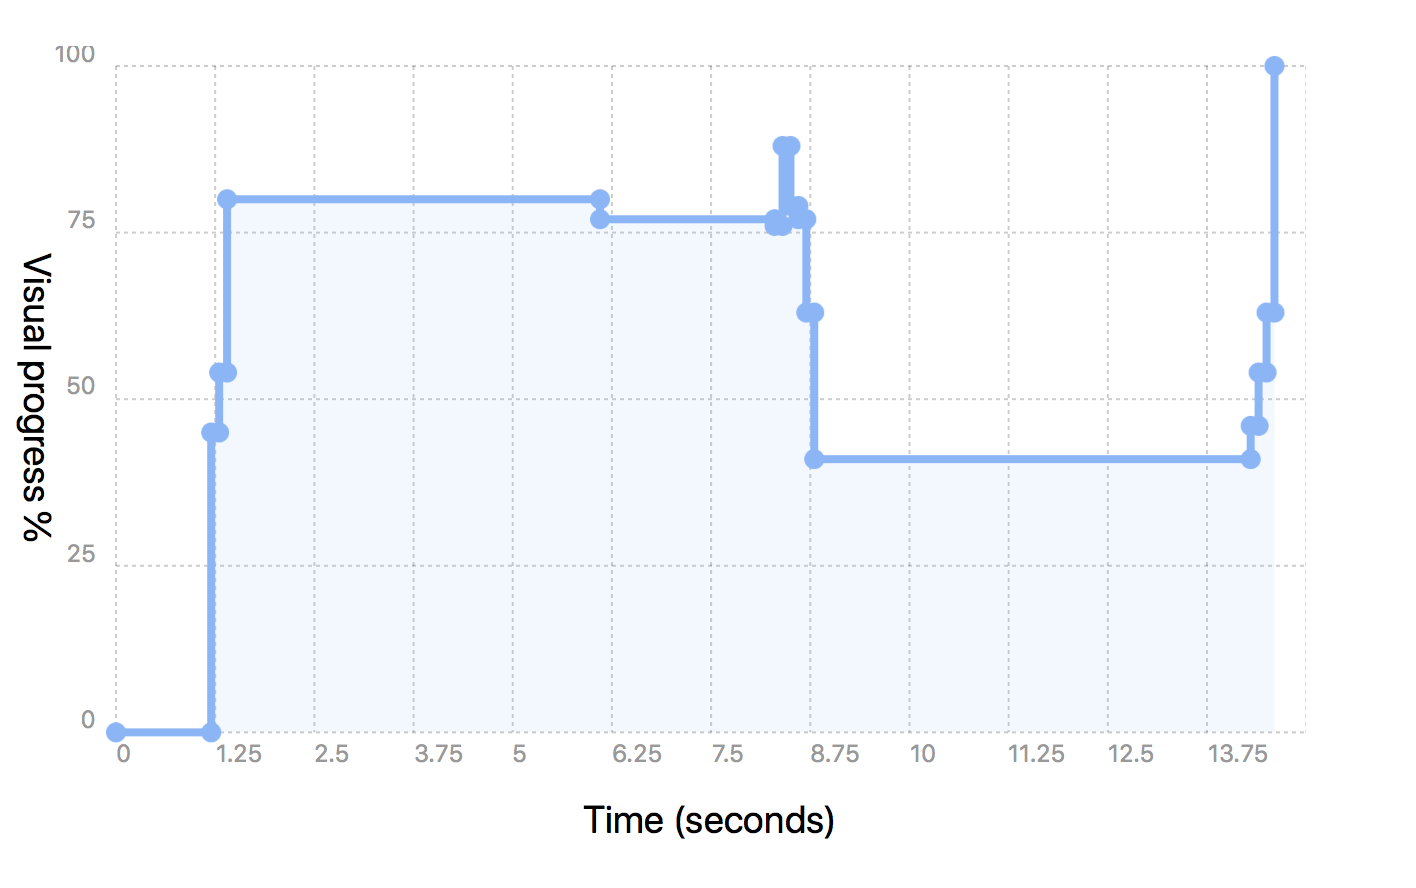
And when I do get the error it looks like this:
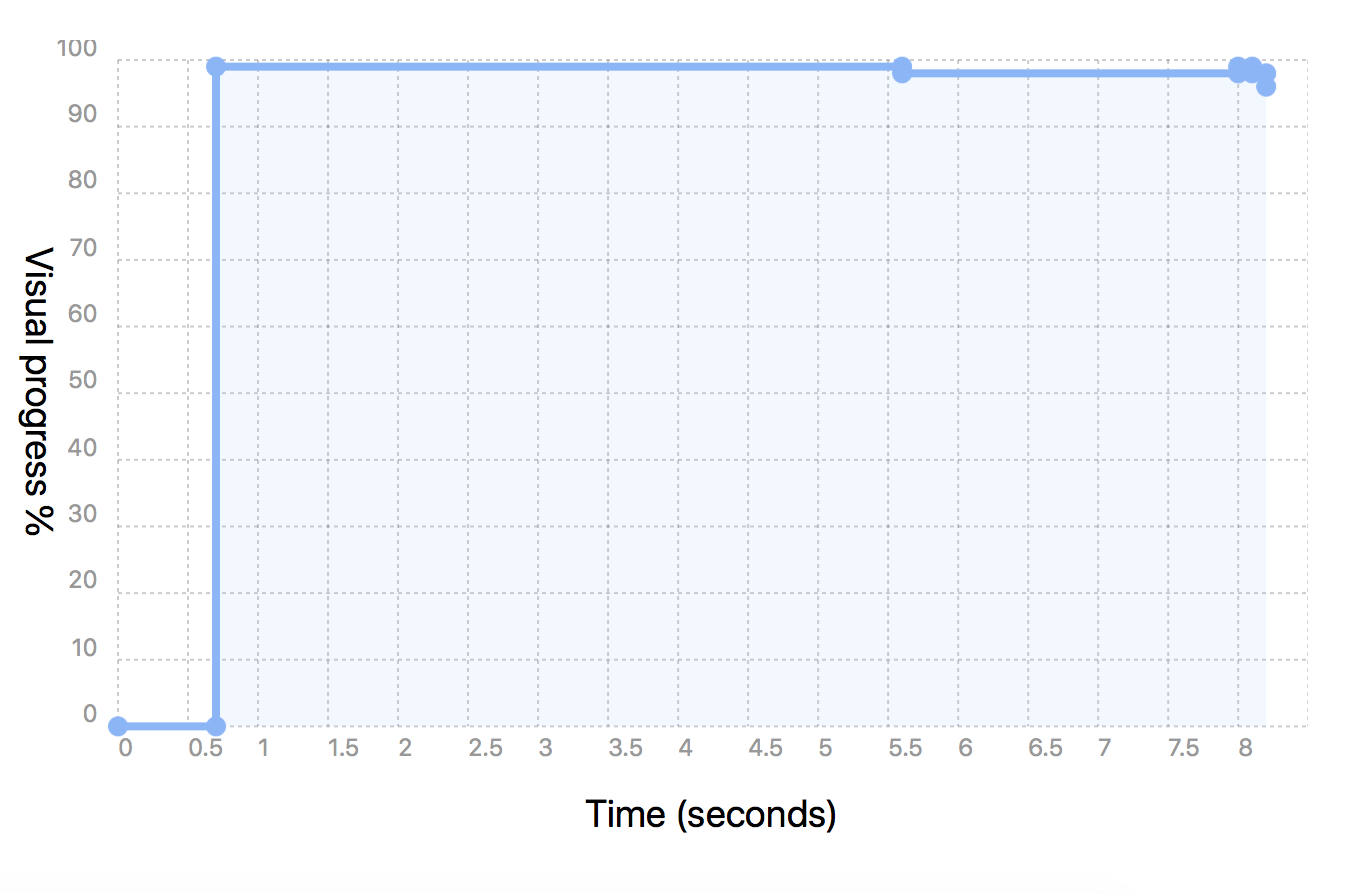
That's seems to match you bar, can you recheck your videos?
I checked there and there are no pop-ups or anything like that.. Just doesn't work.
Do you see exactly in which step it fails? I mean I guess click on a link and the page doesn't load?
soulgalore
on 25 Jan 2019
One more thing, I see one thing that we should change, and that is if the URL doesn't change (it should but who knows ...) there will be no navigation. The log there logs the same as if other things fail, so I'll change that first and if you got a trace log when you run on your prod, please share so I can check.
That was wrong, sorry.
Best
Peter
soulgalore
on 26 Jan 2019
OK so the dev vs prod problem was 100% my fault. Stupid mistake I'm afraid.
So that works.
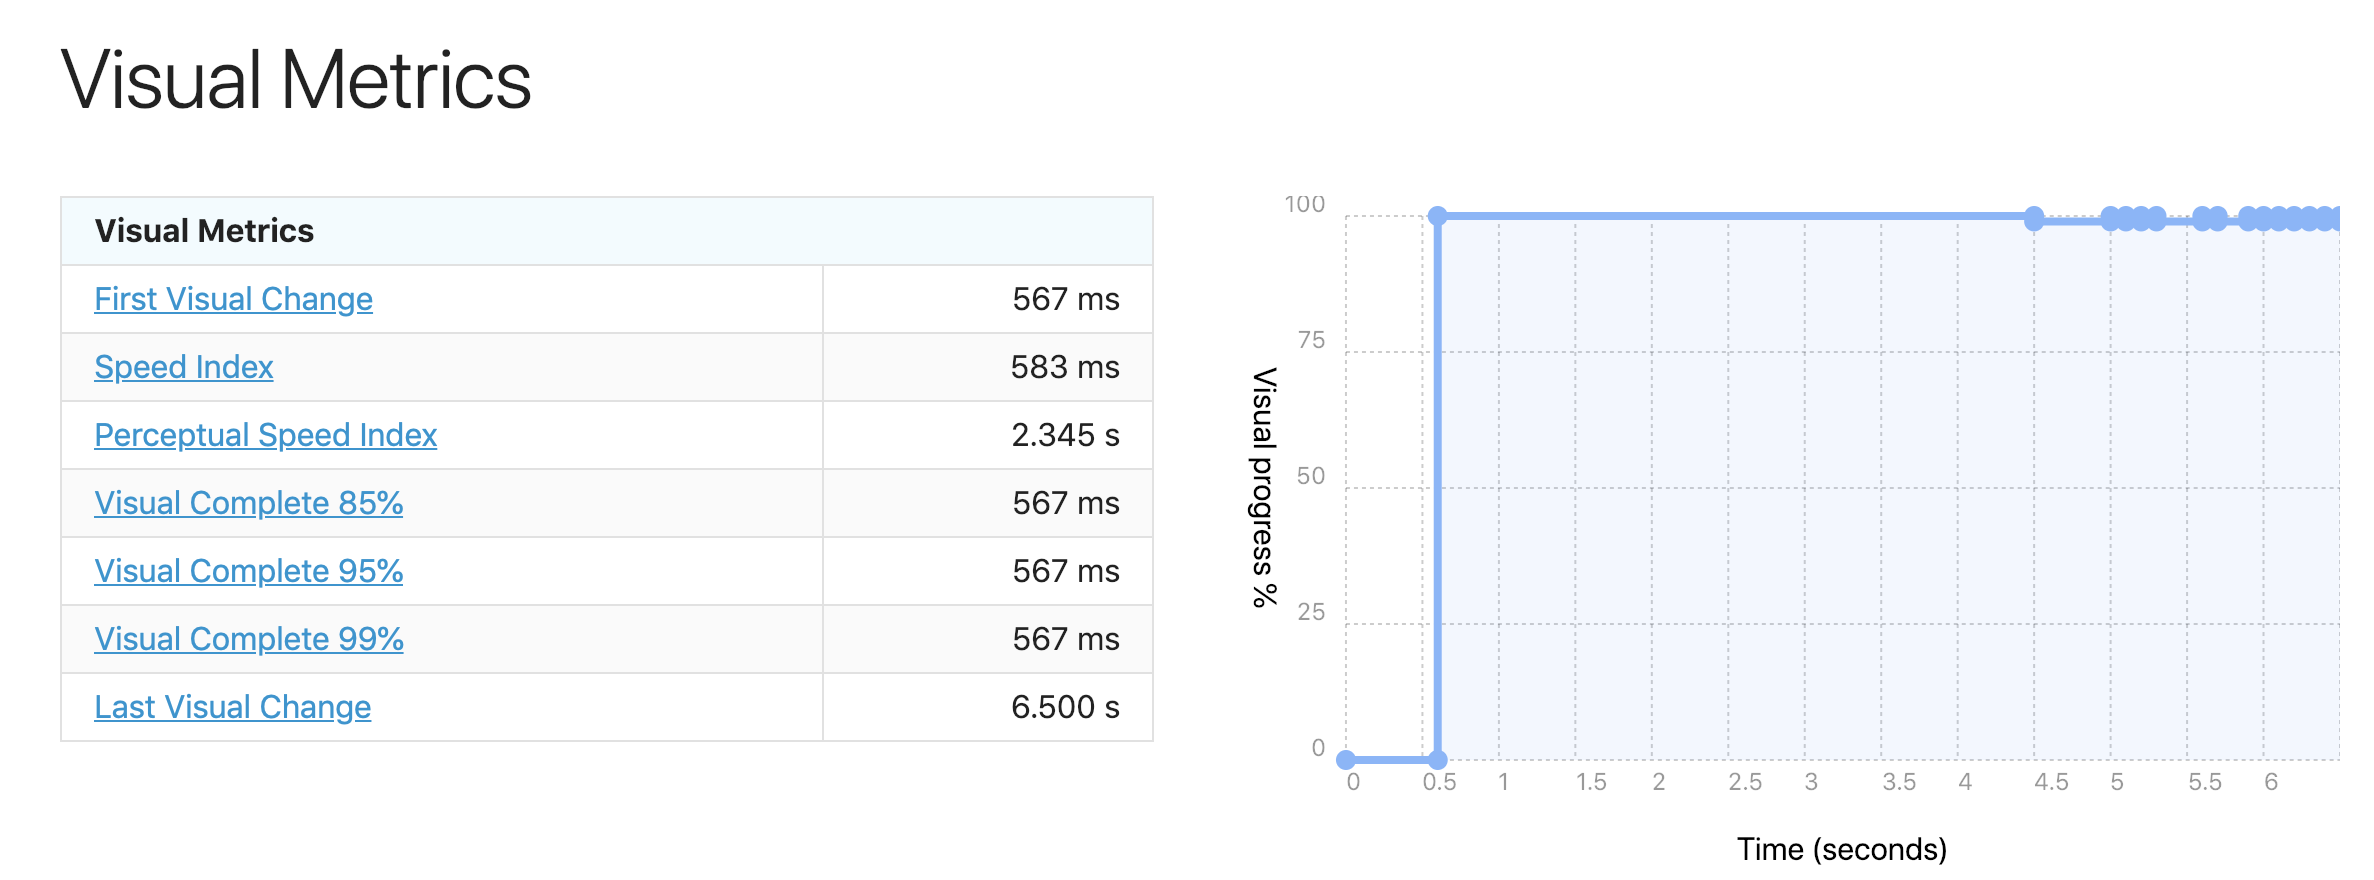
As for the measuring the data, here is the status of 1 iiteration when I do not get any error (using 8.0.4):
And here is the video:
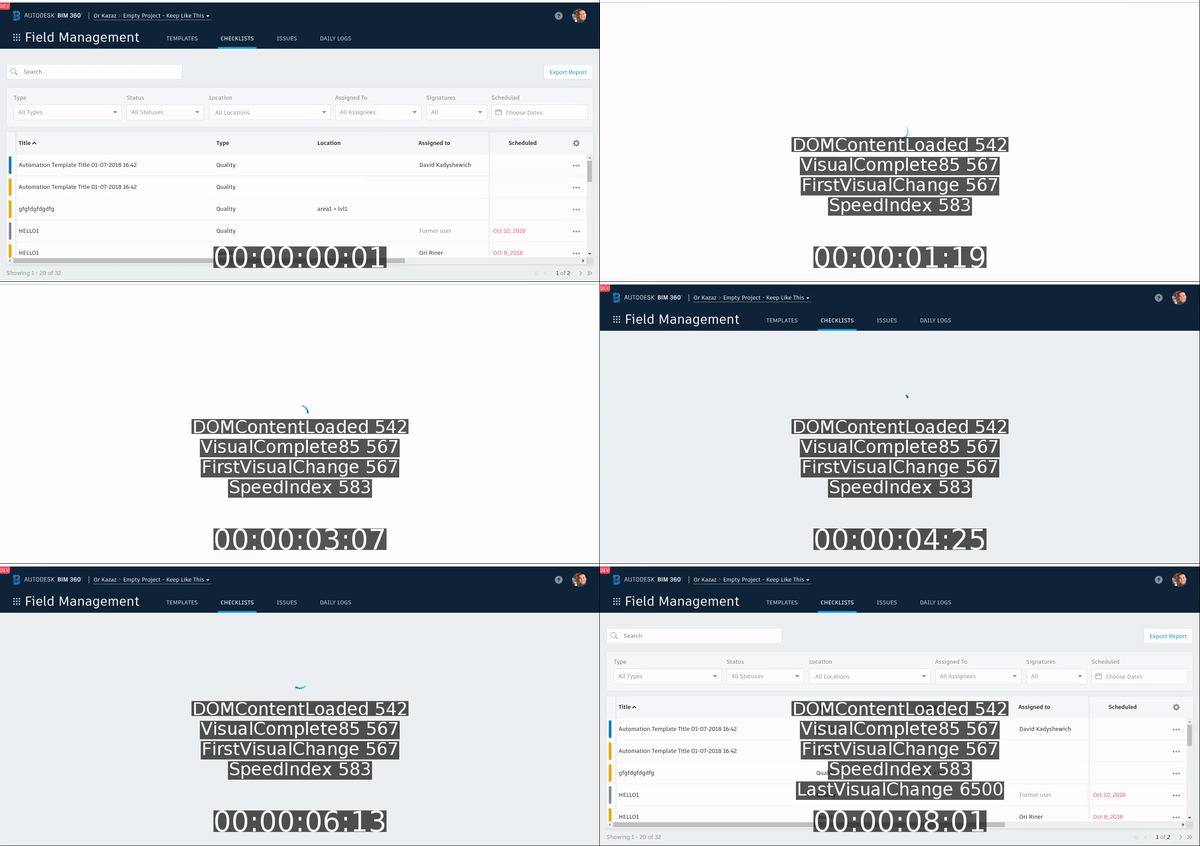
To me it still look slike the problem that the previous page is there and it starts comparing vs that..
P.S:
Just in case I ran the tests few times and go tthe same result..
kazazor
on 27 Jan 2019
Yeah but you are comparing the same page right so the visual progress is correct? At least it looks like that in the gif: the start of the video and the end of the video looks the same. Or how is it wrong? :)
If I understand correctly:
- you login the user
- the user gets redirected to page X
- you start to measure
- you go to page x
And the original problem is that the cookie doesn't work, since it isn't set on the domain. I'll have a look again if I can fix that in the extension.
Or is this another problem? :)
soulgalore
on 27 Jan 2019
This is not related to the cookie problem IMO :)
What I'm trying to do is measure a page which has been cached already, what we previously did by using --preURL option.
How would you recommend doing that properly with version 8.x.x which has the new scripting options?
The way I'm trying to do it is doing as you mentioned:
- Login by
commands.click.byIdAndWait('btnSubmit') - The users go to page X
- Because we used
byIdAndWaitit waits for the page check complete before continuing to the next command (so everything would be in the cache) - We
commands.measure.starton page X
I would expect here that the measuring will only start when the pages go blank, but as we see here it starts measuring before navigation was completed.
The problems I see
How to properly test cached sites?
Basically, we're trying to measure a user page refresh on the same page.
The way I'm thinking of doing it now is between steps 3 & 4 I should add another navigation to a nutural page and only then commands.measure.start. This page:
http://blank.org/
3. wait for page X to be cached
4. await commands.navigate('http://blank.org/');
5. commands.measure.start no page X
I guess that will work, but feels like a hack to me.
WDYT?
The measurements may be off
Even in the scenario I'm doing here, with the fix you added in 8.0.4 it should have picked the last measurements on the page and not the first. What we see from the data I shared is that 99% is done in 567ms. That means it looks at the first 99% complete (before the page refresh) and not the last (after the refresh ended).
I believe this is what you tried fixing in 8.0.4 but I do not see it working.
So regardless on the proper way to test cached pages and getting all of the measurements correctly, seems to me like the bug still exists.
By the way, the fix you did was supposed to take the last measurements that's true, but I think that was true for everything Except first visual change that always is something like 30ms.
The approach I mentioned above with using a blank page in between would also fix that, but again feels like a hack to me...
kazazor
on 28 Jan 2019
By the way, just tried the option of adding await commands.navigate('http://blank.org/'); in between and it works perfectly and measures things as expected.
I still wonder if that is the way to go (and still there may be a bug in the tools as I mentioned).
kazazor
on 28 Jan 2019
I think what you are describing is https://github.com/sitespeedio/sitespeed.io/issues/2259#issuecomment-456590267 ?
In --preURL we used to remove the HTML before navigation (the screen becomes white).
Chrome keeps the layout of the "old" page when it starts to load the new page. You can fix that by either remove the HTML/hide the body. In the next Browsertime release I can add a couple of help commands for that, to make it simpler.
soulgalore
on 30 Jan 2019
I think that would be good to add help commands to do that. I believe that even people do not know that, this is probably a VERY common use case.
For now, I'll use my await commands.navigate('http://blank.org/'); solution since it works perfectly. When these helper commands will be added I'll switch to that since the current solution adds about 7 seconds to each test iteration, and that's a lot.
I'll close this issue now since the title of it has been resolved.
I still believe a potential bug exists there which I shared with the results I saw, but this is out of the scope of this issue.
kazazor
on 31 Jan 2019
Related issues
 gfoxCartrawler
·
4Comments
gfoxCartrawler
·
4Comments
 LuisOsv
·
8Comments
LuisOsv
·
8Comments
 Nuoky
·
6Comments
soulgalore
·
6Comments
Nuoky
·
6Comments
soulgalore
·
6Comments
 marceloboeira
·
10Comments
marceloboeira
·
10Comments