Site-kit-wp: Implement `UserCountGraph` component for new All Traffic widget
After scaffolding the UserCountGraph component in #2392, it should now actually be implemented.
_Do not alter or remove anything below. The following sections will be managed by moderators only._
Acceptance criteria
- The
UserCountGraphcomponent for the AnalyticsDashboardAllTrafficWidgetV2should be fully implemented:
- It should encompass the full graph UI in the bottom left corner of the widget (see Figma file), including the filled area below and the curved UI (see e.g. https://developers.google.com/chart/interactive/docs/gallery/linechart#curving-the-lines).
- It should display data from an Analytics report for the metric
ga:users, the dimensionga:date, dates based on the current date range, and optionally the current entity URL, if there is one. - If both the
dimensionNameanddimensionValueprops are present, it should also consider those for querying the report, asdimensionFilters. - Background: If both props are present, the graph shows user counts over time for all users that satisfy the filter. Otherwise, the graph shows total user counts over time, not filtered by any dimension.
- The existing Storybook story for
DashboardAllTrafficWidgetV2should have its setup updated, to populate the registry with corresponding test report data, so that the UI rendered byUserCountGraphis visible there.
Implementation Brief
- Update the
GoogleChartcomponent:
- Update chart instantiation functionality to create the
AreaChartchart when thechartTypeproperty equals toarea.
- Update chart instantiation functionality to create the
- Edit the
UserCountGraphcomponent:
- Add new
useSelecthooks which do the following: - Pulls
startDate/endDatedates from thecore/userdatastore using thegetDateRangeDatesselector; - Pulls
urlfrom thecore/sitedatastore using thegetCurrentEntityURLselector; - Pulls report data from the
module/analyticsdatastore using thegetReportselector withga:usersmetrics, selected dimension name and value (if it's not empty),startDate/endDatedates andurlreceived from the aforementioned selectors; - Implement the required markup and styles to match the UI defined in the provided Figma file.
- Use the
GoogleChartcomponent to display the chart. CheckAnalyticsDashboardWidgetSiteStatsas an example to see how we use this component and the AreaChart documentation for more details on how to configure it.
- Add new
- Update the storybook setup for the
DashboardAllTrafficWidgetV2component to properly configure theUserCountGraphcomponent.
Test Coverage
- Not needed.
Visual Regression Changes
- The new chart should appear on the left side of the widget.
QA Brief
- Set up the plugin on your site;
- Activate and connect the Analytics module;
- Go to the dashboard page and make sure you see the new All Traffic widget;
- Make sure that the chart with the total number of users is shown and changes when you change the active tab in the widget;
- Make sure that the chart also changes when you change the current period.
Changelog entry
- Implement
UserCountGraphcomponent for new Analytics All Traffic widget.
 felixarntz
All 6 comments
I'm not sure the IB here is specific enough, because from what I've seen in the Google Charts docs for LineChart, there's no way to have the area below the line filled in, as in the mocks:
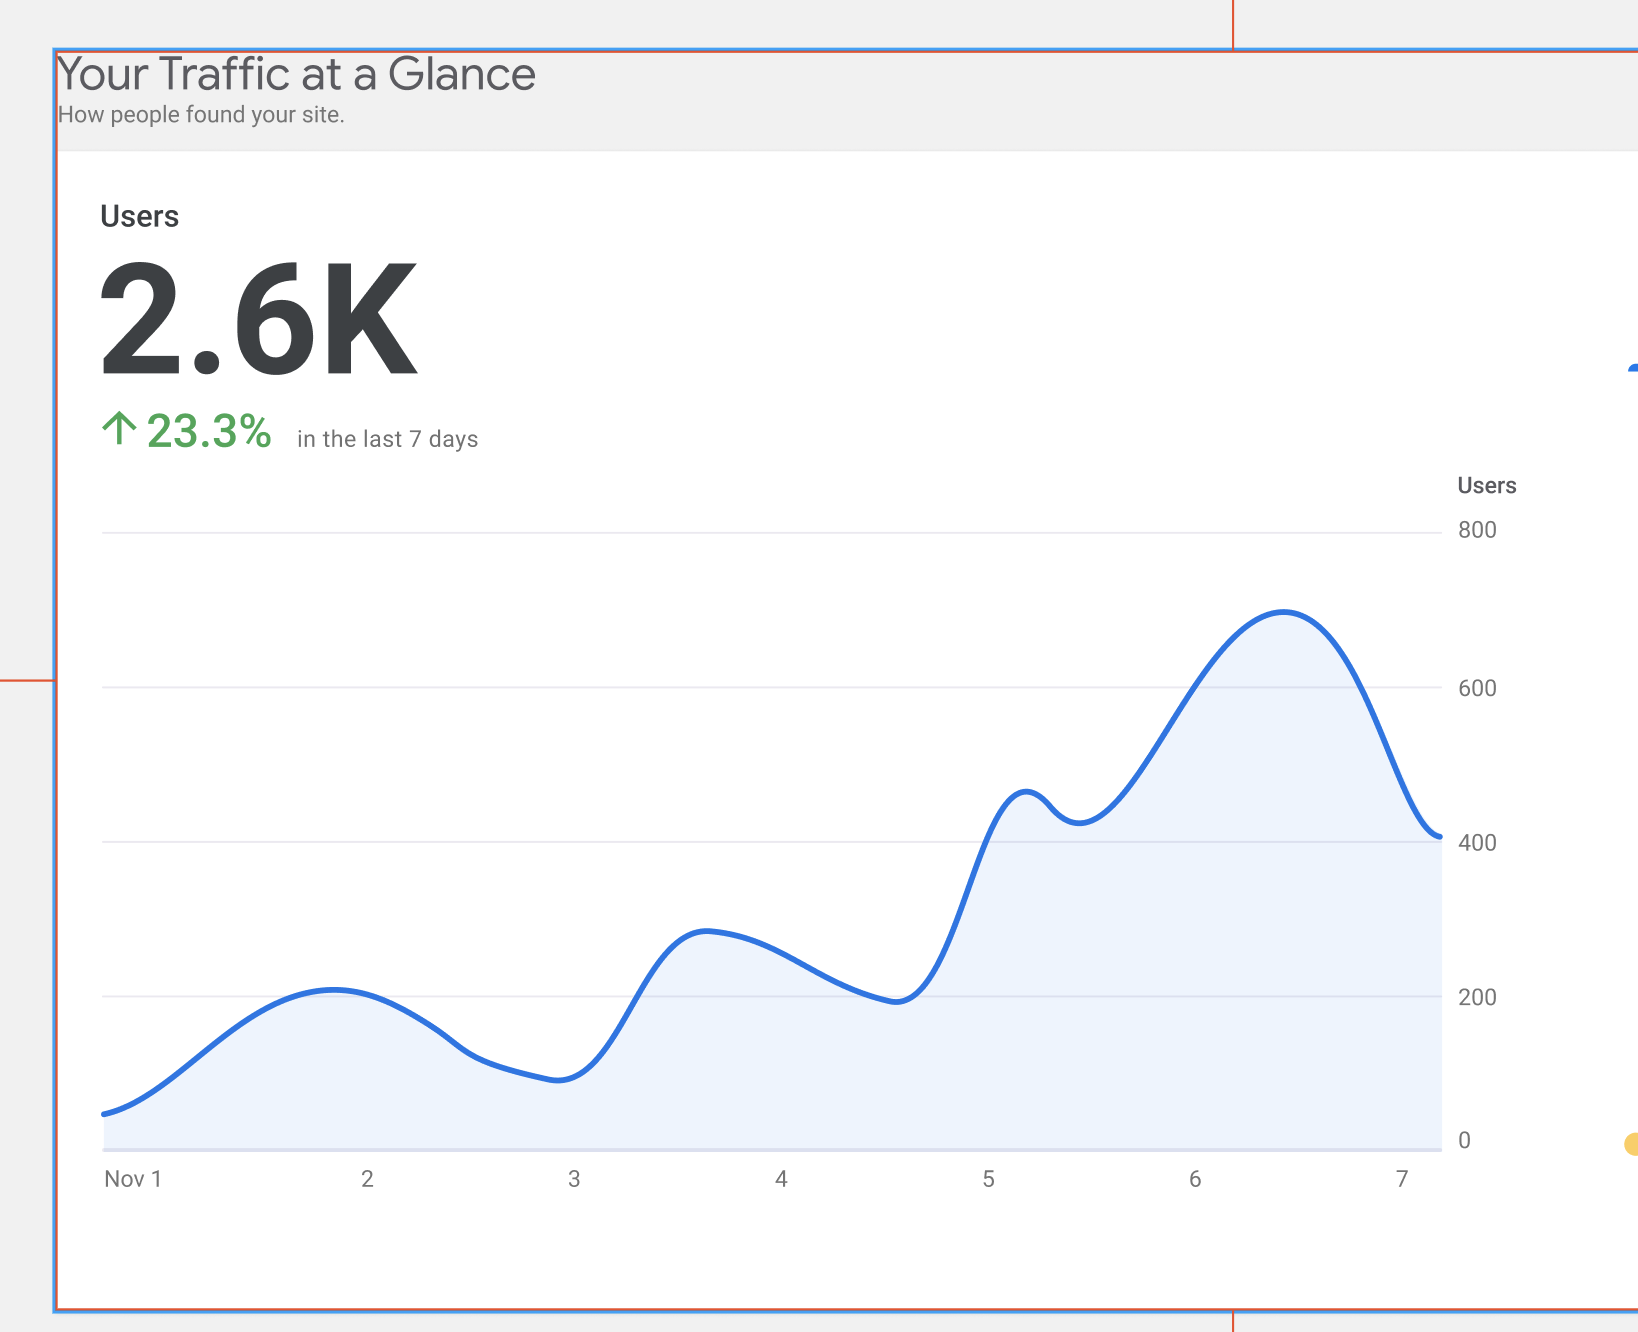
In order to have the area under the line filled in we'd need to use a separate chart, the AreaChart. We should still be able to use curveType to achieve the curve effect I think.
Because we'd need to use a new kind of chart and it'd be fairly different from existing ones, I think this might need a bigger estimate as well, but I think for this one we should be a bit more particular about the IB. The general sense of the IB is good, but I think needs more specificity on how they chart will be made.
 tofumatt
on 21 Dec 2020
tofumatt
on 21 Dec 2020
Good catch, @tofumatt! I didn't notice it at the beginning, thank you! I have updated the IB to outline that we need to add a new chart type to make it work.
 eugene-manuilov
on 22 Dec 2020
eugene-manuilov
on 22 Dec 2020
IB ✅
tofumatt
on 22 Dec 2020
No need for you both to review, but I thought I'd assign it to both as I know this is high-priority 😄
tofumatt
on 13 Jan 2021
QA Update: Pass ✅
The new All Traffic widget appears on SK Dashboard - Screenshot
The chart with the total number of users is shown and changes when you change the active tab in the widget.
- The chart also changes when you change the current period.
@tofumatt this passed the QAB but have a few observations that I wondered if we could look at (I can create new tickets) 1) Sometimes, the users, pie chart and graphs load slow (feels like 5-10 seconds) when you have selected a slice and a date period. I guess this could be a limitation with the API, but, thought I would highlight. 2) On mobile you do not always see the data in the right axis, not a huge issue since I doubt many will use mobile in the dashboard, but thought I'd flag it. - Screenshot
 wpdarren
on 15 Jan 2021
wpdarren
on 15 Jan 2021
Sometimes, the users, pie chart and graphs load slow (feels like 5-10 seconds) when you have selected a slice and a date period. I guess this could be a limitation with the API, but, thought I would highlight.
Yeah, that's just a slow API request. I noticed it too; maybe that particular request is slow. But I think it's "expected" behaviour for now.
On mobile you do not always see the data in the right axis, not a huge issue since I doubt many will use mobile in the dashboard, but thought I'd flag it.
Yes, I caught that too. The Figma mocks don't have explicit mobile mocks and several of these components could use further mobile optimisations. Can you open a follow-up issue to improve the whole widget area on mobile viewports referencing that right axis issue in particular? 🙂
I think this belongs in Approval for now though, yeah 👍🏻
tofumatt
on 15 Jan 2021
Related issues
 aaemnnosttv
·
3Comments
tofumatt
·
5Comments
aaemnnosttv
·
5Comments
aaemnnosttv
·
4Comments
aaemnnosttv
·
3Comments
tofumatt
·
5Comments
aaemnnosttv
·
5Comments
aaemnnosttv
·
4Comments
 quangbahoa
·
5Comments
quangbahoa
·
5Comments