Site-kit-wp: Dates compared for last 90 days in Analytics audience overview chart off by 1
Bug Description
In the Analytics Audience Overview chart, one plot is for the most recent period for the currently selected date range, and another plot is added for the previous period. Additionally, the previous period is shifted so that the week days align between the periods when compared.
Example with last 28 days
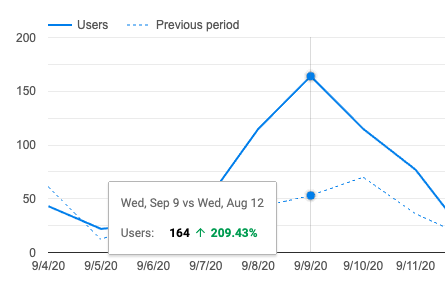
The same date with last 90 days
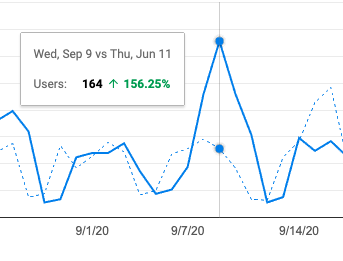
Note the days of the week are not aligned (Wed vs Thu instead of Wed vs Wed) with the 90 day date range where they are with 7, 14, and 28 day periods. Of course, those are all even multiples of 7 days, but in #1280 we updated this so that weekdays should align regardless of the period.
Steps to reproduce
- Set up Analytics using a site that has at least 90 days of data
- Go to Analytics dashboard in Site Kit
- See week days are aligned on default 28 day range view
- Switch date range to last 90 days
- See week days are not aligned
_Do not alter or remove anything below. The following sections will be managed by moderators only._
Acceptance criteria
- Server-side
dateRange-parsing logic should be fixed so that aligning per weekday (specifically to be tested withlast-90-days) works as expected. - Each plot in the graph on the Analytics module page should be for two dates which have the same weekday also for 90 days.
Implementation Brief
Test Coverage
Visual Regression Changes
QA Brief
Changelog entry
 aaemnnosttv
All 8 comments
@felixarntz This seems to only affect the server-side parsing as the newer client-based logic correctly identifies the starting compare date as Sat Apr 4th instead of Sun 5th for the same start date.

The same behavior is observable in the current release so it isn't related to recent changes on the client.
aaemnnosttv
on 2 Oct 2020
The underlying issue here is that the chart currently uses an approach that doesn't use day alignment, even though we did adjust to use day alignment for the percent comparison change calculations.
The chart relies on data from this query: https://github.com/google/site-kit-wp/blob/168e6f45de73c831294c43dc59f392700b408d68/assets/js/modules/analytics/util/index.js#L396-L429
This data includes up to the last 180 (90 days x 2) of data. Then, in extractAnalyticsDashboardData we split the data into the two blocks of time we need:
The date ranges in the chart should always start on the (closest) same day of the week - for 90 days the previous date range needs to shift back one day).
We can either use multiDateRange in this data request (and adjust the splitting logic), or request 183 days of data, and shift the start day to align to the closes matching weekday (moving forward or backward up to three days), as we do in the multiDateRange date range calculations.
 adamsilverstein
on 14 Oct 2020
adamsilverstein
on 14 Oct 2020
@aaemnnosttv & @tofumatt I did a little investigating since I worked on the original changes in https://github.com/google/site-kit-wp/issues/1280. Findings above ^^.
adamsilverstein
on 14 Oct 2020
@adamsilverstein I think using multiDateRange makes more sense, particularly because some dates may overlap between the two ranges so it definitely fits better into a "separate ranges" paradigm. This is also how it's already designed to work with the JS-based parsing as well, which passes compareStartDate and compareEndDate: https://github.com/google/site-kit-wp/blob/099cac9a45e52cb90bc4473a68f37eb7f6f45666/includes/Modules/Analytics.php#L972-L984
aaemnnosttv
on 14 Oct 2020
I'm sorry, but I had a look through the PHP code here in the past and the JS code, including how the ranges are split, the requests mades, etc.
I think I'm totally lost on how, exactly, this stuff all connects together.
At first what seems obviously to me was to change the start date in the query to match the end date so things would align. I tried changing some of the JS as well as suggested here but I think I might be missing a step or a clear understanding on how the data path here works.
I'm going to unassign myself from this one as I'm not clear on the path of the data here and it seems @aaemnnosttv has a better sense of it, so as to not block the issue I'm moving the assignment. If I'm missing something simple please let me know and re-assign it to me. 😅
 tofumatt
on 16 Oct 2020
tofumatt
on 16 Oct 2020
@adamsilverstein @felixarntz looking into an IB for this, I don't think this is fixable as-is without substantial changes.
My understanding of the problem is that we need to change how the report request is made to be a true multi-date range request, rather than the range math and splitting that we do with compareDateRanges which is a bit of a hack based on our previous understanding of how the API worked. However, changing this in the current data request (siteAnalyticsReportDataDefaults) would break the utilities we have for parsing the results (extractAnalyticsDashboardData and extractAnalyticsDashboardSparklineData) which are tightly coupled to the format of the response.
Given that this is just a 1 day difference in a single date range, I would say it's not worth the effort or risk to address now as it should be handled as we refactor our components. As soon as we move to _using_ the date range parsing/handling on the client (which is limited to the refactored components now) then we'll be forced to deal with this because the response will change. It doesn't seem like a good idea to push this right now while maintaining the legacy components, so I suggest we keep this as a known issue, but put it on the back burner until the Analytics components are migrated and we both need to make this change, and legacy components will be gone.
aaemnnosttv
on 16 Oct 2020
Given that this is just a 1 day difference in a single date range, I would say it's not worth the effort or risk to address now as it should be handled as we refactor our components
Sounds reasonable, especially given that this only affects the chart - the numbers and percent changes are accurate already.
adamsilverstein
on 19 Oct 2020
Moving back to AC for revision.
aaemnnosttv
on 21 Oct 2020
Related issues
aaemnnosttv
·
4Comments
 theeducatedbarfly
·
4Comments
theeducatedbarfly
·
4Comments
 marrrmarrr
·
5Comments
marrrmarrr
·
5Comments
 tunakode
·
4Comments
aaemnnosttv
·
3Comments
tunakode
·
4Comments
aaemnnosttv
·
3Comments