Site-kit-wp: Change percentages should match service UI.
Bug Description
The "Change" percent displayed in Site Kit in the Analytics detail page does not match what is shown in the Analytics product UI. The time periods are correct, the calculations seem off.
- First discovered when working on https://github.com/google/site-kit-wp/issues/1202.
A related issue where these numbers may be swapped on the Search Console details page: https://github.com/google/site-kit-wp/issues/870
Steps to reproduce
- Go to the Analytics detail page on a site with moderate traffic.
- Check reports for 28 days and 90 days.
- Compare the percent change shown for Users, Sessions, Bounce Rate and Session Duration against the numbers shown in the Analytics UI.
- Note the numbers do not match.
Screenshots
90 day view for my personal site:
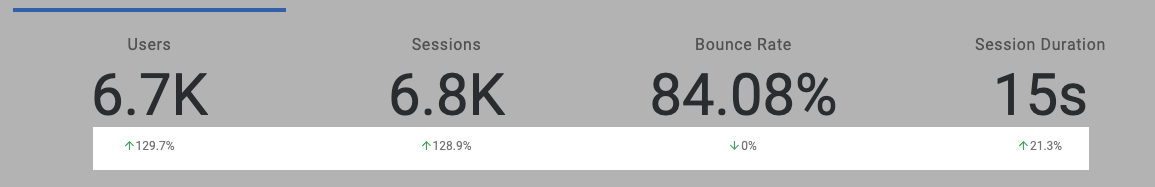
Users, Sessions, Bounce Rate and Session: 129.7, 128.9, 0 (green), 21.3
same 90 days in Analytics UI:
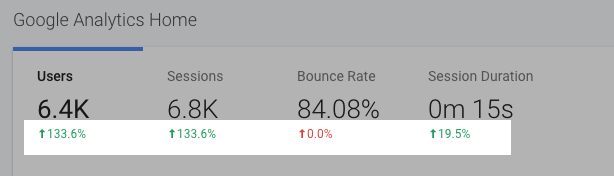
Users, Sessions, Bounce Rate and Session: 133.6, 133.6, 0 (red), 19.5
Additional Context
_Do not alter or remove anything below. The following sections will be managed by moderators only._
Acceptance criteria
- The change percentages shown for Analytics data for a 90 day period comparison should match the percentages in Analytics UI (except Users, see #1681).
Implementation Brief
- In
includes/Core/Modules/Module.php:parse_date_rangeadd a newday_alignparameter that defaults to false. when true, the previous period's time range will be adjusted to match the closest period with the same days of the week (ie starting on the same day of the week). - Compare the current period's end (yesterday) day of the week to the calculated end of the previous date range. When they don't match, adjust the date...
$previous_day_of_week = date( 'w', strtotime( $date_end ) );
$yesterday_day_of_week = date( 'w', strtotime( 'yesterday' ) );
if ( $day_align && $previous_day_of_week !== $yesterday_day_of_week ) { ...
- To adjust the date, offset the period to move it to the closest period with matching days. If the previous period is earlier in the week and less than 4 days away, move the period forward. If the previous period is later in the week and more than 4 days away, move the period forward. Otherwise, move the period backwards. Move the period by the difference in the days of the week between the two periods.
// Adjust the date to closest period that matches the same days of the week.
if (
    // Previous day of the week earlier and less than 4 days away: move forward.
    (
        $previous_day_of_week < $yesterday_day_of_week &&
        $yesterday_day_of_week - $previous_day_of_week < 4
    ) ||
    // Previous day of the week later and more than 4 days away: move forward.
    (
        $previous_day_of_week > $yesterday_day_of_week &&
        $previous_day_of_week - $yesterday_day_of_week > 4
    )
) {
        // Move the past date forward to the same day of the week.
        $date_end = gmdate( 'Y-m-d', strtotime( '+' . absint( $yesterday_day_of_week - $previous_day_of_week ) . "days", strtotime( $date_end ) ) );
        $date_start = gmdate( 'Y-m-d', strtotime( '+' . absint( $yesterday_day_of_week - $previous_day_of_week ) . "days", strtotime( $date_start ) ) );
    } else {
        // Move the past date backwards to the same day of the week.
        $date_end = gmdate( 'Y-m-d', strtotime( '-' . absint( $yesterday_dayofweek - $previous_day_of_week ) . "days", strtotime( $date_end ) ) );
        $date_start = gmdate( 'Y-m-d', strtotime( '-' . absint( $yesterday_dayofweek - $previous_day_of_week ) . "days", strtotime( $date_start ) ) );
    }
}
- Only Analytics uses this alignment (as far as we know). In
includes/Modules/Analytics.phpin the'GET:report'case, pass $day_align as true:
// Add the previous period date range, aligned to the day of the week.
if ( ! empty( $data['multiDateRange'] ) ) {
    $date_ranges[] = $this->parse_date_range( $date_range, 1, 1, true, true );
}
Note this will fix all change percentages _except_ for the users datapoint.
QA Brief
- The values displayed for Analytics Users, Sessions, Bounce rate etc. should match the value in the Analytics frontend for a 90 day period.
- For the other available date ranges this was already the case prior to this issue.
Changelog entry
- Fix inconsistency where Analytics numbers displayed for the last 90 days were slightly off from the values in the Analytics frontend.
 adamsilverstein
All 30 comments
IB ✅
 felixarntz
on 10 Apr 2020
felixarntz
on 10 Apr 2020
In my working PR, I have added/updated tests for the functions that ultimately handle the output of the percentage and they are behaving correctly.
As such, I believe that this is a data issue that may be similar to #1202. When I compare the data in Site Kit with the UI, the only percentage that is incorrect is for Users:
The values being passed for the previous month and last month, 310 and 370 respectively, correctly produce a percent change of 19.4%.
However, unless I am mistaken, the value for last month should be 325, not 370 and which would also mean that 310 is incorrect as well.
 ryanwelcher
on 13 Apr 2020
ryanwelcher
on 13 Apr 2020
@ryanwelcher I think the percentage for "Users" is indeed related to #1202 not covering that part - see https://github.com/google/site-kit-wp/pull/1277/files#diff-e44d069f62420f6d21b8b9f50383e354L68 where the percentage still comes from the old API request. @adamsilverstein Could you open a PR against this issue here that ensures the percentage is calculated from your new ga:users API call as well?
Regarding the other percentages, which are also off though, that must be caused by something else. Maybe the date range we're querying for to compare is slightly off from what Analytics internally queries?
felixarntz
on 13 Apr 2020
@ryanwelcher Thanks for looking into this. As you discovered, the issue here is with the data we are getting rather than the calculation itself.
Do you see the same percentage changes for all fields when you increase the time period to 28 or 90 days? The issue with the queries is more apparent then. I think I was seeing other changes listed incorrectly as well.
In #1202 I discovered that the query we use here which we pass the date dimension (to retrieve the daily chart data) _aggregates calculations into daily totals_.
I expect that we need to adjust the query I added there to use the feature that queries the previous range as well (plus add any other metrics that are off) so we can do the percent calculation on the correct numbers. I will work on this more to see if I can get the correct data.
Regarding the other percentages, which are also off though, that must be caused by something else. Maybe the date range we're querying for to compare is slightly off from what Analytics internally queries?
I've checked the date ranges repeatedly and am pretty confident we use the correct date spans. I suspect the date dimension may be the source of the issue (because it changes the way analytics calculates these changes).
adamsilverstein
on 14 Apr 2020
@adamsilverstein @felixarntz I just did a comparison of the ranges in Site Kit locally vs Analytics Dashboard. Taking into account that the percentage for Users is already known as incorrect, the only other range that was incorrect was 90 days.
7-Days

14-days

28-days

90-days
This seems to point to an issue with the date range. I'll dig into it further on my end.
ryanwelcher
on 15 Apr 2020
This seems to point to an issue with the date range. I'll dig into it further on my end.
@ryanwelcher Probably worth checking the dates again, it is possible something is off, although I have looked at them carefully several times.
I suspect you will find the issue has to do with how the numbers are returned from our query due to the date dimension in our query. We probably need to add a similar query that doesn't include this dimension or expand the query I added to fix the user count. Also: in analytics, you should be able to drill down to see what numbers are used to calculate the percent change.
I found the query explorer invaluable in troubleshooting the user count issue: https://ga-dev-tools.appspot.com/query-explorer/ - here you can try the constructed query directly, with and without the date dimension to see how the totals are reported and compare them.
adamsilverstein
on 15 Apr 2020
I was able to confirm that the dates being requested match the data being returned and displayed. There now seems to be a discrepancy between the Analytics UI Home and Audience overview screens.
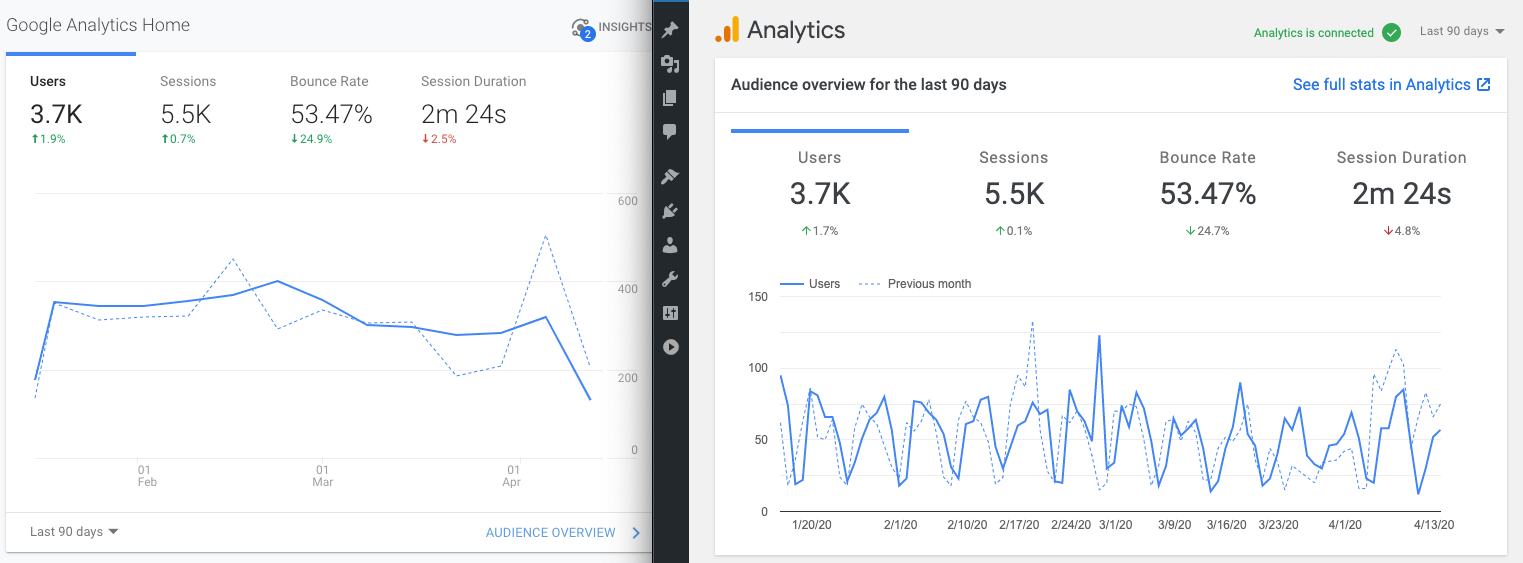
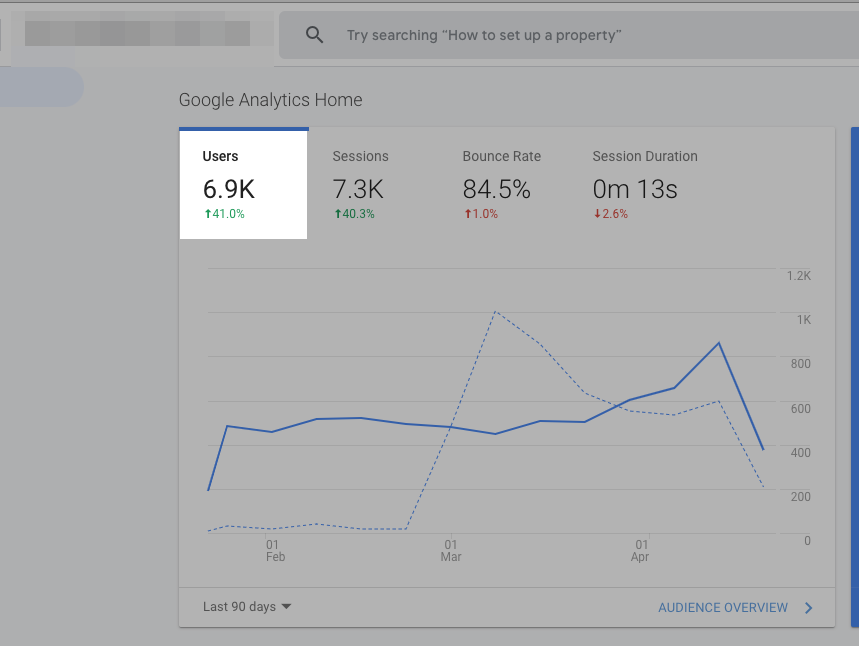
For example, the screenshot below shows data from the last 90 days:

Compare to the Analytics Home view, the percent changes are incorrect:

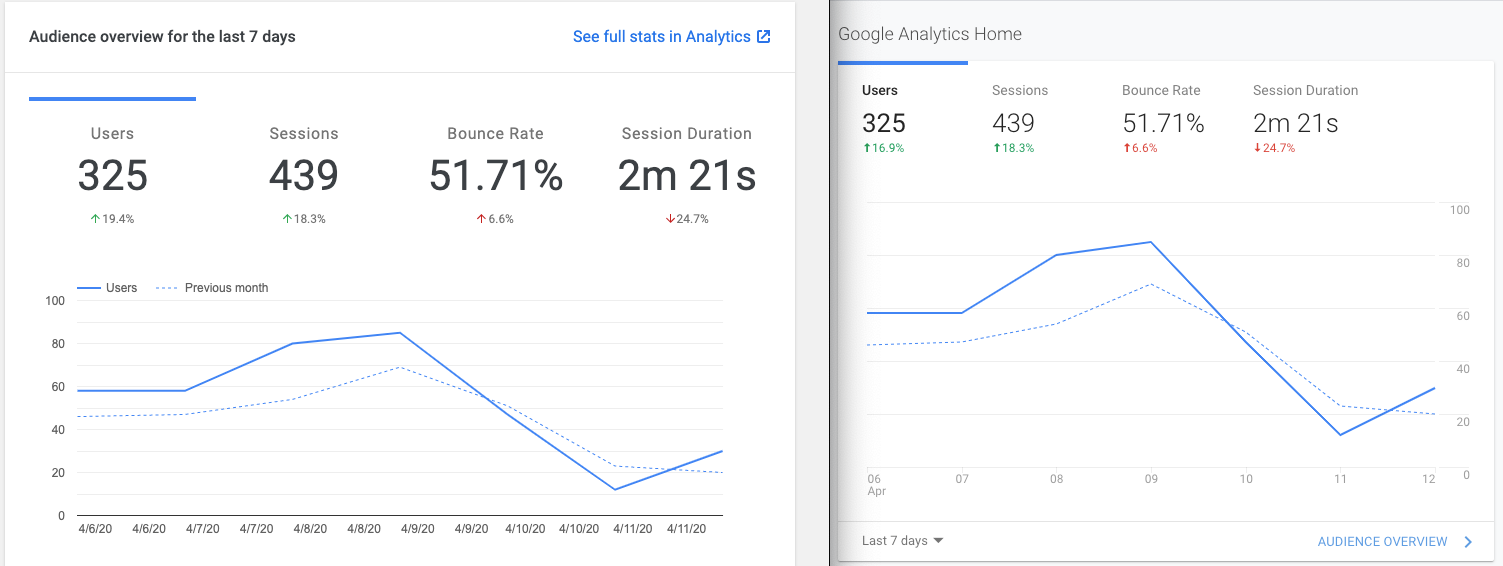
However, when comparing the same date ranges we request using the Audience Overview page, we can see that the percent changes match ( after some rounding ) Site Kit:
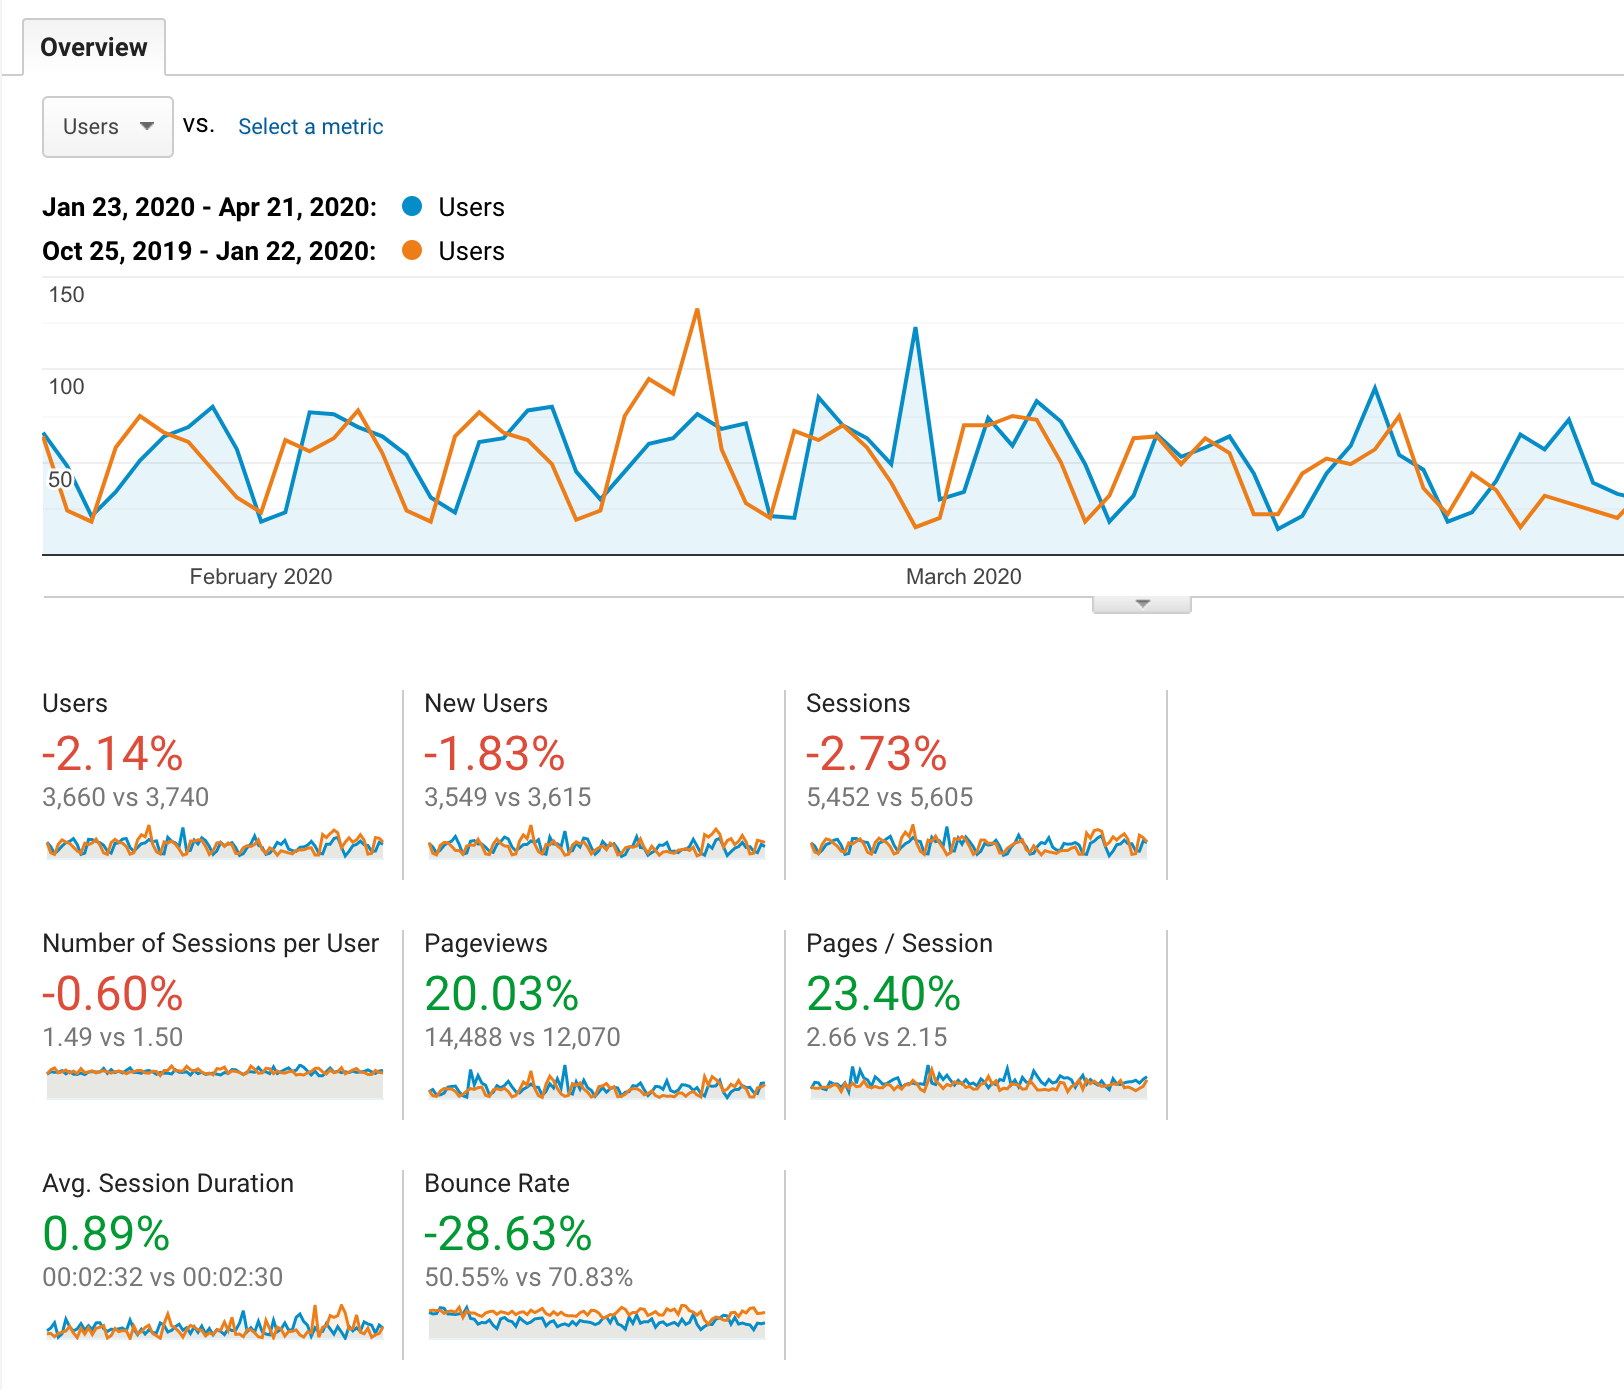
ryanwelcher
on 22 Apr 2020
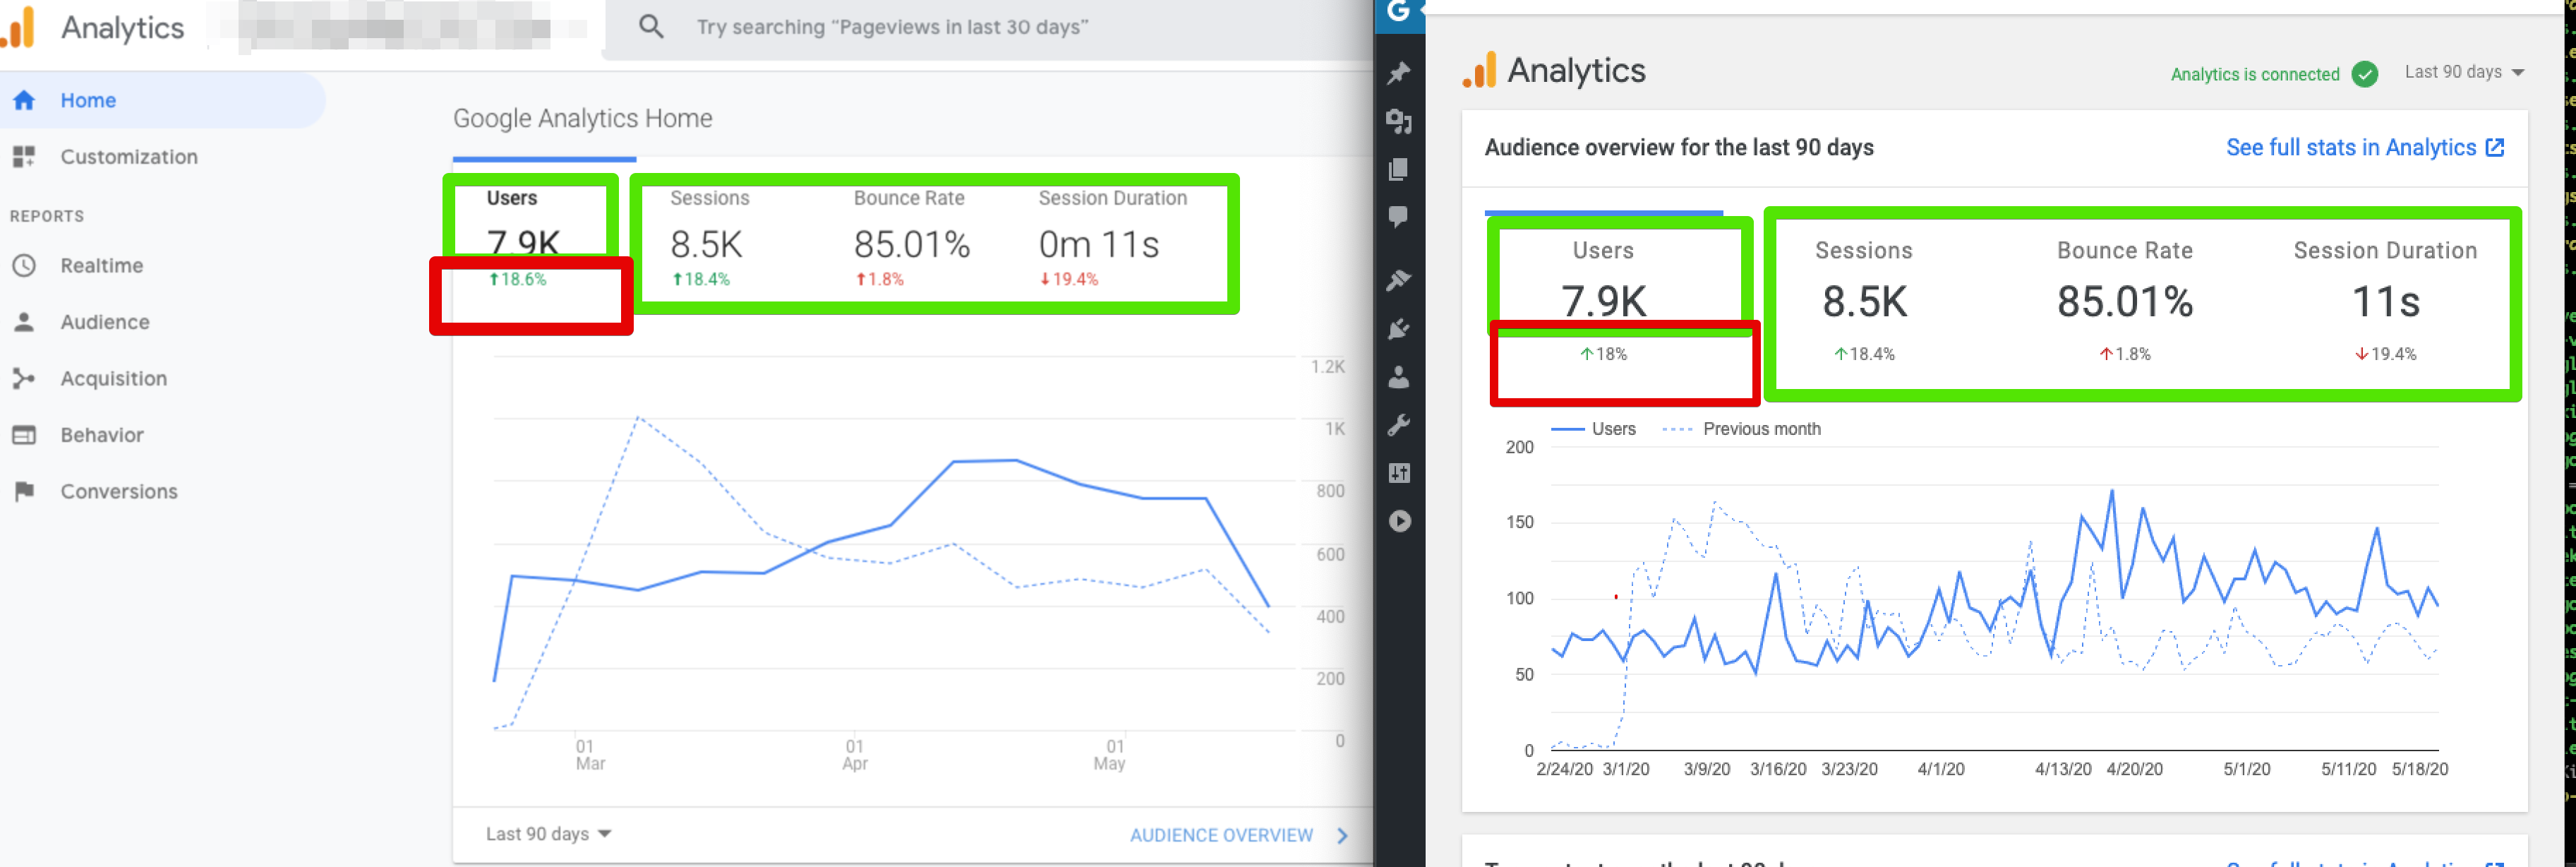
Very interesting. I confirmed the same for my site. The user percent change number in Site Kit matches what I see on the detail report, but the Analytics Dashboard shows a different number. I am starting to suspect _the number showing in Analytics is incorrect_ or using some hidden calculation approach. Perhaps reaching out to the Analytics team is appropriate at this point to verify how this number is being calculated.
Site Kit reports 39.6% change:

Analytics Audience Overview report shows 39.05%:

While the Analytics Dashboard shows 41%:
@ryanwelcher were you ever able to replicate a query or calculation that matches the number reported on the Dashboard page?
adamsilverstein
on 22 Apr 2020
This issue is now blocked because further exploration is necessary on how Analytics is determining these numbers. I have merged the existing PR because it included useful test coverage, but I'll move this back to ACs, to be defined once we know what is happening here.
felixarntz
on 24 Apr 2020
A quick note that I have been working to track down this issue by opening a ticket with Analytics support. I will update here when we get more information.
adamsilverstein
on 12 May 2020
One more update: Working on the IB I found that with the date modified I can reproduce every number exactly in my 90 day report except user percent change:
Still trying to determine the correct date/query/calculation used for this number, I've tried several variations.
Worth noting the date ranges shown in analytics suggest an aggregation by nth week (week of the year). In this short screencast you can see each data point is a week of data and the first and final weeks are partial weeks.

adamsilverstein
on 11 Jun 2020
I have an update about the data discrepancy we are seeing here:
An apparent bug in the Analytics dashboard causes inaccurate date ranges used on the Analytics home page for the 90 day report. In particular, there is a one day gap between compared date ranges.
For example:
On May 15th I ran the 90 day report and by hovering over the chart I can see the start and end date of the reporting period.
The 90 day period compares:
Feb15-May14 (yesterday->90 days ago)
Nov 16-Feb 13 (92 days ago ->182 days ago?) - note Feb 14th is missing
When I use these date ranges for the 90 day period, the percent changes match - other than the user datapoint, which I am guessing is due to aggregation, like we saw with the total. Testing that and then I will add a new IB for this issue.
adamsilverstein
on 11 Jun 2020
@felixarntz / @ryanwelcher I updated the IB with instructions to fix the change percentages for 90 day reports. This fixes everything except the user change percentage which I am still investigating (awaiting help from support).
Maybe we can act on the existing IB, then re-open the issue to figure out the last data point?
adamsilverstein
on 11 Jun 2020
@adamsilverstein
Change:
$date_ranges[] = $this->parse_date_range( $date_range, 1, 1, true );
To:$date_ranges[] = $this->parse_date_range( $date_range, 1, 'last-90-days'
Hmm, this doesn't look right - the third parameter should be an $offset, not an actual date range. Can you look at adjusting that?
Other than that, sounds good, let's address the user-specific percentage separately, that should be a similar fix like how we adjusted the absolute number for the user count before. Can you open an issue for that to follow up?
felixarntz
on 15 Jun 2020
Corrected IB, left off part of the code before.
Will create a follow up issue as well.
adamsilverstein
on 15 Jun 2020
@felixarntz @adamsilverstein @ryanwelcher
In
Analytics.php:create_data_requestin the handler forGET:report, when a 90 day report is request, offset the date calculation by one day.
Maybe we should override Module::parse_date_range in the Analytics class to account for this special case instead rather than in a specific datapoint or does the inconsistency only affect the report requests/API?
Add Jest tests for
calculateOverviewDataandchangeToPercentconfirming that percentages as being generated correctly.
Is that not what these are for?
assets/js/modules/analytics/util/calculateOverviewData.test.jsassets/js/util/test/changeToPercent.js
Edit - Also, please add an estimate 🙂
 aaemnnosttv
on 16 Jun 2020
aaemnnosttv
on 16 Jun 2020
Maybe we should override Module::parse_date_range in the Analytics class to account for this special case instead rather than in a specific datapoint or does the inconsistency only affect the report requests/API?
Right, that was my intention in stating the code change should be in Analytics.php:create_data_request - did you mean somewhere else?
Add Jest tests for calculateOverviewData and changeToPercent confirming that percentages as being generated correctly.
Thank you for pointing to those tests. (I'm not sure who added that part of the IB) I guess if the code change affects those tests we will need to adjust them to suit?
Adding an estimate for the date range code change and potentially updating the tests.
adamsilverstein
on 16 Jun 2020
@felixarntz I created a follow up Issue for the user percent change and added a few screenshots with my fixes here showing all numbers correct except user percent change: https://github.com/google/site-kit-wp/issues/1681
adamsilverstein
on 16 Jun 2020
@adamsilverstein Sounds good. Regarding the approach in the IB, two follow-up questions:
- It seems weird to only do this for 90 days - do we not have that same gap for 14 days etc? The parsing logic should be the same for all of them, so why is it different for 90 days?
- Does this only apply to Analytics? What about 90 days of data for e.g. Search Console, AdSense etc.?
felixarntz
on 16 Jun 2020
It seems weird to only do this for 90 days - do we not have that same gap for 14 days etc? The parsing logic should be the same for all of them, so why is it different for 90 days?
It is weird! Only 90 day reports are affected. This is essentially a bug in the Analytics homepage - which I can file separately. The reporting dates used when you select 90 days includes the gap. other periods do not. How do I know this? By verifying that the numbers reported by site kit exactly match those in Analytics.
I'll add a line to the IB to specify that the code should be documented and reference this issue.
Does this only apply to Analytics? What about 90 days of data for e.g. Search Console, AdSense etc.?
This fix is specifically for Analytics (so our data matches the service UI). I have not seen this issue with other services.
adamsilverstein
on 29 Jun 2020
@adamsilverstein should we really be re-implementing a bug on the service just for consistency with one date range? As soon as the bug is fixed on the service, Site Kit would be inconsistent again 😄 We would then fix that in the next release but it seems like something we might be better off leaving alone.
aaemnnosttv
on 29 Jun 2020
As soon as the bug is fixed on the service
I honestly doubt this bug will get fixed although I do plan to file a ticket. If they do, we can revert the change.
should we really be re-implementing a bug on the service just for consistency with one date range
Yes, I feel like it is worth it because otherwise we will be dealing with a steady stream of bug reports when users find their data in Site Kit doesn't match their data in Analytics.
I updated the IB to indicate that an inline comment should be included to explain the change and reference this issue.
adamsilverstein
on 30 Jun 2020
Removing this from the current sprint since we need to make a decision first. If this can be fixed on Analytics side in a timely manner, we can close. If not, we should introduce this bug too, as weird as it seems :)
felixarntz
on 1 Jul 2020
@felixarntz @aaemnnosttv: confirming I do some updates from the Analytics team side, they are currently looking into this issue and have confirmed they may have a bug. Let's keep this ticket on hold for now until we have a better sense for the time to resolution.
adamsilverstein
on 8 Jul 2020
Looks like the Analytics team has pushed a potential fix, awaiting confirmation/time to deploy to production the we can re-test to verify this fixes the issue we see.
adamsilverstein
on 13 Jul 2020
The fix in question did not resolve the issue we are seeing. I have updated the internal ticket and will update here on progress.
adamsilverstein
on 20 Jul 2020
Removing this from Sprint 28, since it's still undefined.
felixarntz
on 20 Jul 2020
I have discovered the underlying issue with our Analytics percent change numbers being off... Turns out the past period used for comparison is always aligned on the same days of the week as the current period
So if the current period starts on a monday, the past period also starts on a monday
This makes some sense, especially when you look at a day by day comparison, because traffic patters will vary by day of the week, eg weekends might be busier times. By aligning on days of the week, this difference is reduced.
For 7 or 28 day reports, this works out that the previous period ends exactly before the current period - because 7 and 28 are whole peek periods (number of days is evenly divisible by 7).
When we try 90 days (or 30 in the Analytics UI), the previous period is "offset" to match the start day of the week; depending on the alignment this could mean moving the period forward, or backward by up to 3 days
I will add an IB for this change as well as the other user data changes you specified.
adamsilverstein
on 22 Jul 2020
@adamsilverstein IB ✅ , just one thing, let's name the parameter $weekday_align as it's a bit more precise.
felixarntz
on 23 Jul 2020
Tested as a part of this ticket: https://github.com/google/site-kit-wp/issues/1681
Passed QA ✅
 cole10up
on 13 Aug 2020
cole10up
on 13 Aug 2020
Related issues
 tofumatt
·
5Comments
aaemnnosttv
·
5Comments
tofumatt
·
5Comments
aaemnnosttv
·
5Comments
 quindo
·
5Comments
felixarntz
·
4Comments
felixarntz
·
4Comments
quindo
·
5Comments
felixarntz
·
4Comments
felixarntz
·
4Comments