Sidekiq: Queue latency showing wrong values
Ruby version: 2.6.5
Rails version: 6.0.3.4
Sidekiq / Pro / Enterprise version(s): 6.1.2/5.2.0/2.2.0
Redis: 5.0.5
Initializer:
Sidekiq::Pro.dogstatsd = -> { StatsD::Monitoring.instance("sidekiq") }
Sidekiq.configure_server do |config|
  redis_attributes = { url: Redis::ConnectionPool.sidekiq_connection_url, driver: "hiredis" }

  config.redis = redis_attributes

  config.super_fetch! # https://github.com/mperham/sidekiq/wiki/Pro-Reliability-Server
  config.reliable_scheduler! # https://github.com/mperham/sidekiq/wiki/Reliability#scheduler

  config.log_formatter = Sidekiq::Logger::Formatters::JSON.new

  config.retain_history(10) do |s| # history is captured every 10 seconds
    s.batch do |b|
      %w(critical low mailers medium reports).each do |qname| # default queue latency is already captured
        q = Sidekiq::Queue.new(qname)
        b.gauge("sidekiq.queue.latency", q.latency, tags: ["queue:#{qname}"])
      end
    end
  end
Hey Mike,
I've been testing sidekiq metrics with Statsd/Newrelic and looks like it work almost perfectly. I've done many tests locally and the data is correctly sent to newrelic. Production/Staging also send data as expected.
Example of a queue where latency is high (one or more minutes)
TIMESTAMP | SIDEKIQ.SIDEKIQ.QUEUE.LATENCY | QUEUE
December 21, 2020 13:10:00 | {"type":"gauge","count":2,"sum":163.5219344,"min":81.7609672,"max":81.7609672,"latest":81.7609672} | low
There's only one issue I've found.
Sometimes latency is reported as zero on production/staging, usually when it's supposed to be a higher number (few seconds).
Debugging locally didn't help a lot, but I was able to find some weird numbers when running a lot of jobs with errors:
Checking latency manually on rails console with different values.
=> 1564.9766800403595
irb(main):207:0> Sidekiq::Queue.new("low").latency
=> 1565.5197169780731
irb(main):208:0> Sidekiq::Queue.new("low").latency
=> 0.15608349809e4
irb(main):209:0> Sidekiq::Queue.new("low").latency
=> 0.15613699239e4
irb(main):210:0> Sidekiq::Queue.new("low").latency
=> 0.15618994289e4
irb(main):211:0> Sidekiq::Queue.new("low").latency
=> 0.15560977541e4
irb(main):212:0> Sidekiq::Queue.new("low").latency
=> 0.15567279791e4
irb(main):213:0> Sidekiq::Queue.new("low").latency
=> 0.15574004711e4
irb(main):214:0> Sidekiq::Queue.new("low").latency
=> 1549.4603247642517
irb(main):215:0> Sidekiq::Queue.new("low").latency
=> 0.15460637132e4

irb(main):224:0> entry = Sidekiq.redis { |conn|
        conn.lrange(@rname, -1, -1)
      }.first
=> "{\"retry\":true,\"queue\":\"low\",\"backtrace\":true,\"class\":\"MyJob\",\"args\":[],\"jid\":\"9f051904aaf3d828779fcc75\",\"created_at\":1608568559.536787,\"enqueued_at\":\"1608568955.8690119\",\"error_message\":\"wrong number of arguments (given 0, expected 1)\",\"error_class\":\"ArgumentError\",\"failed_at\":1608568933.468019,\"retry_count\":4,\"error_backtrace\":\"removed\\n\",\"retried_at\":1608571474.982704}"

(at some point I remember seeing "enqueued_at" with values similar to " 0.15574004711e4", but I've lost the evidence.

## "enqueued_at" is a quoted string here, not a number.

irb(main):227:0> job = Sidekiq.load_json(entry)
=> {"retry"=>true, "queue"=>"low", "backtrace"=>true, "class"=>"MyJob", "args"=>[], "jid"=>"1d19b1d2a576b3383feb1a17", "created_at"=>1608568557.968181, "enqueued_at"=>"1608568948.7720928", "error_message"=>"wrong number of arguments (given 0, expected 1)", "error_class"=>"ArgumentError", "failed_at"=>1608568920.47653, "retry_count"=>4, "error_backtrace"=>"removed", "retried_at"=>1608571473.045738}
irb(main):234:0> now = Time.now.to_f
      thence = job["enqueued_at"] || now
      now - thence
=> 1608572684.1363788
=> "1608568948.7720928"
Traceback (most recent call last):
        2: from (irb):236
        1: from (irb):236:in `-'
TypeError (String can't be coerced into Float)

(This error happened after I manually stopped sidekiqswarm)
Jobs execution log:
2020-12-21T17:39:08.039Z pid=97335 tid=ounuatdo3 INFO: Booting Sidekiq 6.1.2 with redis options {:url=>"redis://localhost:6379/", :driver=>"hiredis"}
{"ts":"2020-12-21T17:39:08.046Z","pid":97335,"tid":"ounuatdo3","lvl":"INFO","msg":"Booting Sidekiq 6.1.2 with redis options {:url=>\"redis://localhost:6379/\", :driver=>\"hiredis\"}"}
{"ts":"2020-12-21T17:39:09.560Z","pid":97335,"tid":"ounuatdo3","lvl":"INFO","msg":"Booted Rails 6.0.3.4 application in development environment"}
{"ts":"2020-12-21T17:39:09.561Z","pid":97335,"tid":"ounuatdo3","lvl":"INFO","msg":"Running in ruby 2.6.5p114 (2019-10-01 revision 67812) [x86_64-darwin19]"}
{"ts":"2020-12-21T17:39:09.561Z","pid":97335,"tid":"ounuatdo3","lvl":"INFO","msg":"Sidekiq Pro 5.2.0 / Sidekiq Enterprise 2.2.0, commercially licensed."}
{"ts":"2020-12-21T17:39:09.565Z","pid":97335,"tid":"ounuatdo3","lvl":"INFO","msg":"Starting processing, hit Ctrl-C to stop"}
{"ts":"2020-12-21T17:39:09.570Z","pid":97335,"tid":"ounw5nik7","lvl":"INFO","msg":"SuperFetch activated"}
{"ts":"2020-12-21T17:39:09.614Z","pid":97335,"tid":"ounw5nhyb","lvl":"INFO","msg":"Managing 44 periodic jobs"}
{"ts":"2020-12-21T17:39:09.618Z","pid":97335,"tid":"ounw5nhyb","lvl":"INFO","msg":"Sending processing metrics to #<Sidekiq::Pro::Metrics::Dogstatsd:0x00007f87332346e8 @statsd=#<ConnectionPool:0x00007f8733234698 @size=12, @timeout=5, @available=#<ConnectionPool::TimedStack:0x00007f8733234620 @create_block=#<Proc:0x00007f8733234710@/app/config/initializers/sidekiq/sidekiq.rb:64 (lambda)>, @created=0, @que=[], @max=12, @mutex=#<Thread::Mutex:0x00007f87332345a8>, @resource=#<Thread::ConditionVariable:0x00007f8733234580>, @shutdown_block=nil>, @key=:\"pool-70109327631120\", @key_count=:\"pool-70109327631120-count\">>"}
{"ts":"2020-12-21T17:39:09.625Z","pid":97335,"tid":"ounw5nhyb","lvl":"INFO","msg":"Gained leadership of the cluster"}
{"ts":"2020-12-21T17:31:16.534Z","pid":93828,"tid":"owvqwgons","lvl":"INFO","msg":"fail","ctx":{"class":"MyJob","jid":"5ec73091fb56aa6f096571e6","elapsed":"0.01"}}
{"ts":"2020-12-21T17:31:16.535Z","pid":93828,"tid":"owvqwgons","lvl":"WARN","msg":"{\"context\":\"Job raised exception\",\"job\":{\"retry\":true,\"queue\":\"low\",\"backtrace\":true,\"class\":\"MyJob\",\"args\":[],\"jid\":\"5ec73091fb56aa6f096571e6\",\"created_at\":1608568560.369355,\"enqueued_at\":1608571831.886658,\"error_message\":\"wrong number of arguments (given 0, expected 1)\",\"error_class\":\"ArgumentError\",\"failed_at\":1608568940.121059,\"retry_count\":4,
Any ideas of what might be causing this and what else to look for?
Best regards,
 raivil
All 8 comments
I suspect that sidekiq is re-enqueuing a job which had previously failed many minutes or hours before and the enqueued_at value in that job is from when it was first created and pushed. That would lead to unpredictable spikes in latency which are false alarms.
 mperham
on 21 Dec 2020
mperham
on 21 Dec 2020
You have the reliable scheduler enabled so the question is does it update the enqueued_at value?
mperham
on 21 Dec 2020
It does update enqueued_at, so that's not the issue.
- Latency should never be 0. This indicates the job was pushed to Redis without an
enqueued_atvalue so it can't be calculated. - Latency of 0.15 is healthy and normal, that's 150ms.
- Any time a job is pushed to Redis with Sidekiq's APIs, it gets a fresh enqueued_at value.
So I'm not sure why you are seeing these wild swings but double check any code which is pushing Sidekiq jobs directly to Redis without using Sidekiq's APIs.
mperham
on 21 Dec 2020
Do you have the OJ gem and recently update to 3.10.17?
If so, take a look at this issue... it could be related.
 jeffblake
on 21 Dec 2020
jeffblake
on 21 Dec 2020
@jeffblake yes, OJ 3.10.17 is present.
I'll check the issue you mentioned.
I redid the tests locally after flushing Redis, disabling scheduled jobs.
Jobs are only enqueued on console.
Similar results.
irb(main):284:0> 1.upto(10000) { MyJob.perform_async }
=> 1
=> 1.6197261810302734
irb(main):291:0> Sidekiq::Queue.new("low").latency
Traceback (most recent call last):
        1: from (irb):291
TypeError (String can't be coerced into Float)
irb(main):292:0> Sidekiq::Queue.new("low").latency
=> 1.1833012104034424
irb(main):293:0> Sidekiq::Queue.new("low").latency
=> 2.8698670864105225
irb(main):294:0> Sidekiq::Queue.new("low").latency
=> 1.567234754562378
irb(main):302:0> Sidekiq::Queue.new("low").latency
=> 0
irb(main):303:0> Sidekiq::Queue.new("low").latency
=> 0
irb(main):304:0> Sidekiq::Queue.new("low").latency
=> 0.970972e-1
irb(main):305:0> Sidekiq::Queue.new("low").latency
=> 0.13546412e1
irb(main):306:0> Sidekiq::Queue.new("low").latency
=> 0.23888452e1
irb(main):307:0> Sidekiq::Queue.new("low").latency
=> 0
irb(main):308:0> Sidekiq::Queue.new("low").latency
=> 0
irb(main):309:0> Sidekiq::Queue.new("low").latency
=> 0
irb(main):310:0> Sidekiq::Queue.new("low").latency
=> 0.4762990474700928
irb(main):311:0> Sidekiq::Queue.new("low").latency
=> 2.0065109729766846
irb(main):312:0> Sidekiq::Queue.new("low").latency
=> 3.233980894088745
irb(main):313:0> Sidekiq::Queue.new("low").latency
=> 0.21631789207458496
irb(main):314:0> Sidekiq::Queue.new("low").latency
=> 1.4458849430084229
irb(main):315:0> Sidekiq::Queue.new("low").latency
=> 0
irb(main):316:0> Sidekiq::Queue.new("low").latency
=> 0.3447341e0
irb(main):317:0> Sidekiq::Queue.new("low").latency
=> 0.16370092e1
irb(main):318:0> Sidekiq::Queue.new("low").latency
=> 0.23484682e1
irb(main):319:0> Sidekiq::Queue.new("low").latency
Traceback (most recent call last):
        1: from (irb):319
TypeError (String can't be coerced into Float)
Yes it looks like that OJ issue is affecting you. OJ changed the default_options in version 3.10.17
Sometimes Time.current.to_f returns a 17 digit float, which causes the new OJ version to load it as a BigDecimal and end up as a string in Sidekiq...
https://github.com/ohler55/oj/issues/628#issuecomment-747656559
To fix it I added this
Oj.default_options = {
  bigdecimal_load: :float
}
Note that Oj has been on the "problematic" gems list for a few months now:
https://github.com/mperham/sidekiq/wiki/Problems-and-Troubleshooting#thread-unsafe-gems-do-not-use
mperham
on 21 Dec 2020
Updating Oj.default_options seems to fix the issue related to the exceptions/errors.
However, sending data to statsd is not working as expected.
I've made a staging system queue a lot of jobs to generate some latency.
I followed the latency using console using Sidekiq::Queue.new("medium").latency and grafana with https://github.com/Strech/sidekiq-prometheus-exporter. Both got correct values.
Data reported using statsd is not correct. Looks like it doesn't update and keep repeating the values.
One thing that caught my attention is that when I forced a "Stop All" workers, once they returned the value updated once and then kept repeating again.
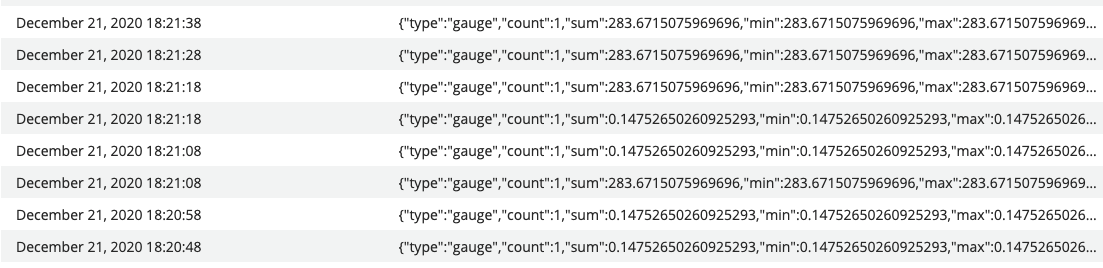
Not sure what is going on and will keep investigating.
raivil
on 21 Dec 2020
Related issues
mperham
·
22Comments
 homanchou
·
22Comments
homanchou
·
22Comments
 wimpog
·
27Comments
wimpog
·
27Comments
 runlevel5
·
40Comments
runlevel5
·
40Comments
 AndydeCleyre
·
29Comments
AndydeCleyre
·
29Comments