shiny::dataTableOutput() requested unknown parameter warning
System details
Browser Version: Google Chrome Version 77.0.3865.90
Output of sessionInfo():
R version 3.6.1 (2019-07-05)
Platform: x86_64-pc-linux-gnu (64-bit)
Running under: Ubuntu 18.04.3 LTS

Matrix products: default
BLAS:   /usr/lib/x86_64-linux-gnu/openblas/libblas.so.3
LAPACK: /usr/lib/x86_64-linux-gnu/libopenblasp-r0.2.20.so

locale:
 [1] LC_CTYPE=es_US.UTF-8       LC_NUMERIC=C               LC_TIME=es_US.UTF-8
 [4] LC_COLLATE=es_US.UTF-8     LC_MONETARY=es_US.UTF-8    LC_MESSAGES=es_US.UTF-8
 [7] LC_PAPER=es_US.UTF-8       LC_NAME=C                  LC_ADDRESS=C
[10] LC_TELEPHONE=C             LC_MEASUREMENT=es_US.UTF-8 LC_IDENTIFICATION=C

attached base packages:
[1] stats     graphics  grDevices utils     datasets  methods   base

other attached packages:
[1] shiny_1.3.2.9001

loaded via a namespace (and not attached):
 [1] compiler_3.6.1       fastmap_1.0.0        magrittr_1.5         R6_2.4.0
 [5] rsconnect_0.8.15     promises_1.1.0       later_1.0.0          htmltools_0.4.0.9000
 [9] tools_3.6.1          Rcpp_1.0.2           jsonlite_1.6         digest_0.6.21
[13] xtable_1.8-4         httpuv_1.5.2.9000    mime_0.7             rlang_0.4.0
Example application or steps to reproduce the problem
library(shiny)

ui <- mainPanel(
  dataTableOutput("table")
)

server <- function(input, output) {
  output$table <- renderDataTable({
    head(iris, 2)
  })
}

shinyApp(ui = ui, server = server)
Describe the problem in detail
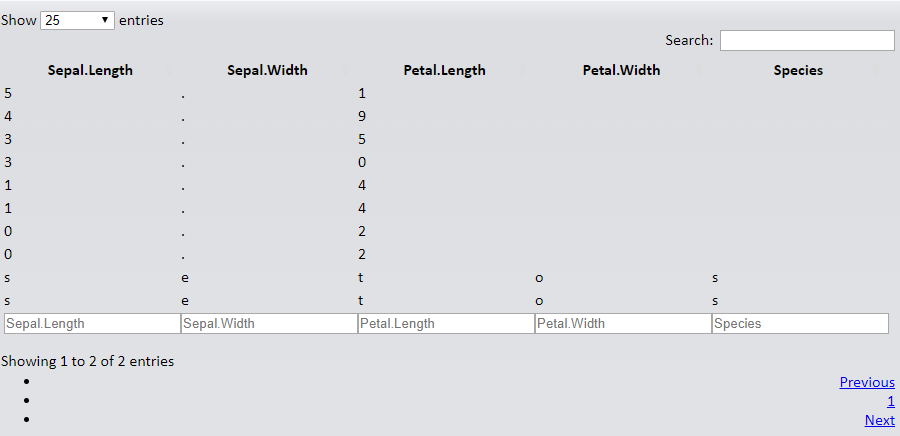
dataTableOutput() produces this error message

And then renders each character on the dataset as a cell
I have tried updating shiny and DT to the development versions but the issue persist, I have also updated shiny-server to the latest stable version.
 andresrcs
All 6 comments
Downgrading htmltools solves the problem, so I think is a compatibility issue with the new CRAN version (0.4)
devtools::install_version("htmltools", version = "0.3.6", repos = "http://cran.us.r-project.org")
Also, downgrading htmlwidgets to 1.3 version solves the issue for editable DataTables
andresrcs
on 6 Oct 2019
Hi @andresrcs, thanks for the report! Just curious, does this htmlwidgets PR fix the problem you're seeing with editable DataTables (also, do you have a minimal repro for that)?
devtools::install_github("ramnathv/htmlwidgets#351")
 cpsievert
on 7 Oct 2019
cpsievert
on 7 Oct 2019
Bisected to https://github.com/rstudio/htmltools/commit/e29ac5cbecbf804a27d8f6b4ea080bba0a05164d
It seems this has something to do with the way shiny:::dataTablesJSON() uses htmlEscape()
FWIW, this doesn't seem to be an issue for DT, and we may likely be deprecating shiny::dataTableOutput() and shiny::renderDataTable() in a future version, so I'd suggest moving to the DT version:
library(shiny)

ui <- mainPanel(
    DT::dataTableOutput("table")
)

server <- function(input, output) {
    output$table <- DT::renderDataTable({
        head(iris, 2)
    })
}

shinyApp(ui = ui, server = server)
Using DT::dataTableOutput is working, devtools::install_github("ramnathv/htmlwidgets#351") also solves the issue for editable DataTables, thanks!
Sadly I can't provide a reprex for the later, since I'm using this feature trough another package (DTedit) that I have forked to personalize so I can't manage to get my head around all the code to simplify it, sorry.
andresrcs
on 7 Oct 2019
In the commit that @cpsievert referenced, the change affects the behavior of renderDataTable because it converts a character matrix in to a character vector here:
https://github.com/rstudio/shiny/blob/89bd7e90117b5ed0c99987d81c8ec8b51a3305c1/R/utils.R#L803
I think the best solution is to modify that code (in dataTablesJSON) so that it preserves the dimensions of fdata.
 wch
on 7 Oct 2019
wch
on 7 Oct 2019
Does anyone have a solution for this that doesn't include the use of the DT package and instead just using the data.tables package? Without using DT and running this line:
output$testStats <- renderDataTable(data.table(iris))
I get the same unknown parameter warning and funky data display as the OP (@andresrcs)
HOWEVER,
if I add these options (still without using DT)
output$testStats <- renderDataTable(data.table(iris, rownames = FALSE, options = list(pageLength = 10, columnDefs = list(list(className = 'dt-center', targets = "_all")))))
The table displays _without any warnings popping up_, BUT it seems to think the options I'm adding should be new columns in my data(?why?) (screenshot below):

My first thought was "Oh, that's because these options are within data.table()" so when attempting the same line but with the data.table() brackets closed after specifying iris:
output$testStats <- renderDataTable(data.table(iris), options = list(pageLength = 10, columnDefs = list(list(className = 'dt-center', targets = "_all"))))
I am once again prompted with the unknown parameter warning and the display looks like the below screenshot:

Any suggestions here would be greatly appreciated! This behavior is quite confusing to me!
 eteuler
on 16 Apr 2020
eteuler
on 16 Apr 2020
Related issues
 beginner984
·
4Comments
beginner984
·
4Comments
 hlherrera
·
5Comments
wch
·
3Comments
hlherrera
·
5Comments
wch
·
3Comments
 dmpe
·
4Comments
dmpe
·
4Comments
 EmileArseneault
·
5Comments
EmileArseneault
·
5Comments
Most helpful comment
Downgrading
htmltoolssolves the problem, so I think is a compatibility issue with the new CRAN version (0.4)Also, downgrading
htmlwidgetsto 1.3 version solves the issue for editable DataTables