Shiny: when shiny is embedded inside rmarkdown
I try to include interactive plots in my rmarkdown.
My dataset (mydata) comes from a .rdata that I load into a r chunk global
In another r chunk, I got my selectinput and my renderPlot that is based on plotting a subset of mydata depending on selectinput.
It does not work because it does not recognize mydata. However if instead I use renderPrint to compute the length of subset of mydata, this works! so it seems it is only a problem with renderPlot!! Using ggplot, I specify environnment=environnment() but this is not working!!
Any advice?
Of note, I put this issue in rmarkdown which says that it was more a shiny problem (and advice me to ask my problem here), but if I do an independant shiny app using load, it works, so the problem is according to me in rmarkdown!
Thanks,
Best
Mélissa
 MelissaLe44
All 16 comments
@MelissaLe44: As pointed out in the issue you mentioned, markdown != rmarkdown.
I cannot judge which package is 'to blame' for your trouble, but in case you don't get help here, try over there. ;)
 mschilli87
on 19 Oct 2017
mschilli87
on 19 Oct 2017
Can you provide a simple reproducible example?
 wch
on 19 Oct 2017
wch
on 19 Oct 2017
1st step create a mydata and save it into a rdata
mydata<-data.table(A=c(rep("a",4),rep("b",3)),val=c(1:7))
save(mydata,"data.rdata")
2nd step have a rmarkdown template and put some rchunk
first r chunk code (to load the data)
load("data.rdata")
second r chunk code:
selectInput("selectinput", "",c("a","b"))
plotOutput("dist")
third r chunk: define dist as a renderplot
output$dist<-renderPlot({
chosen<-input$selectinput
p<-ggplot(mydata[A %in% chosen],aes(x=val,y=val))+geom_point()
})
When running the rmd, it does not work, error can't find mydata
MelissaLe44
on 19 Oct 2017
Fixed minimal example:
````
output: html_document
runtime: shiny
```{r}
library(data.table)
library(ggplot2)
mydata <- data.table(A=c("a", "a", "b", "c", "c"), val=c(1:5))
renderPlot({
ggplot(mydata[A %in% c("a", "c")], aes(x=val,y=val)) + geom_point()
})
```
````
It displays this:
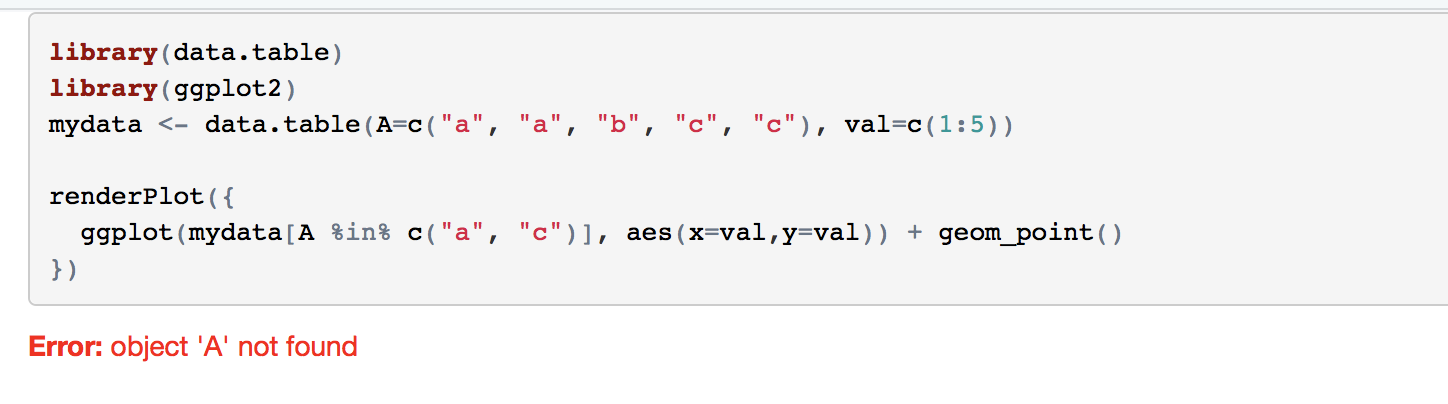
wch
on 19 Oct 2017
Thanks a lot for your help in reproducing this example. It does not have access to mydata ?
MelissaLe44
on 19 Oct 2017
@MelissaLe44 There appears to be a problem with using the special data.table syntax inside of renderPlot when used with rmarkdown and runtime:shiny. The data.table syntax works fine with renderPrint in rmarkdown, and it works fine for a regular Shiny app.
For now I would suggest using the normal data frame subsetting syntax, like this:
mydata[mydata$A %in% c("a", "c"), ]
Example of a regular Shiny app that works with data.table:
library(shiny)
library(data.table)
mydata <- data.table(A=c("a", "a", "b", "c", "c"), val=c(1:5))

shinyApp(
  fluidPage(
    plotOutput("dist")
  ),
  function(input, output) {
    output$dist<-renderPlot({
      chosen<-input$selectinput
      data <- mydata[A %in% c("a", "c")]
      plot(data$val, data$val)
    })
  }
)
Even while using a data frame it does not work in rmarkdown (I just converted my data table into a data frame)
I fully agree with you, inside a shiny app, it works (I have tried as well).
MelissaLe44
on 19 Oct 2017
Did you use the data frame syntax that I gave an example of?
wch
on 19 Oct 2017
yes!
I tried also to explicitily convert my data table into data frame
df1<-as.data.frame(mydata) (or I remove the as), and this outside the renderPlot but still does not work.
MelissaLe44
on 19 Oct 2017
You'll have to supply a reproducible example, because that code works for me.
wch
on 19 Oct 2017
Within a shiny app, there is no problem, but the same code as your "fixed minimal example" does still not work in rmarkdown, even by using
renderPlot({
ggplot(mydata[A %in% c("a", "c"), ], aes(x=val,y=val)) + geom_point()
})
MelissaLe44
on 19 Oct 2017
That's not the code I provided. Here it is again.
mydata[mydata$A %in% c("a", "c"), ]
Indeed it works! thanks a lot for your patience!!
MelissaLe44
on 19 Oct 2017
@wch: Shouldn't this still be considered a bug? Why would some render-function handle DataTable-syntax but other's not?
mschilli87
on 19 Oct 2017
@mschilli87 yes, see the rmarkdown issue I filed that references this one: rstudio/rmarkdown#1162
wch
on 19 Oct 2017
I have fixed it in https://github.com/rstudio/rmarkdown/pull/1165.
 yihui
on 19 Oct 2017
yihui
on 19 Oct 2017
Related issues
 nteetor
·
5Comments
nteetor
·
5Comments
 daattali
·
5Comments
daattali
·
5Comments
 howardcoleman
·
5Comments
howardcoleman
·
5Comments
 zji90
·
5Comments
zji90
·
5Comments
 hudon
·
4Comments
hudon
·
4Comments