Sharp: AWS Lambda running out of memory pretty quickly - then crash/timeout
I am using sharp in one of my application which runs on AWS lambda.
I am not using any fancy operation with sharp - just resize & toFormat.
Now the problem is - Lambda "Max Memory Used:" is keep on increasing until it hits the roof and then crash. To illustrate the problem, i have written a small function below
"use strict";

process.env.VIPS_DISC_THRESHOLD = '20m';

const v8    = require("v8"),
    log     = console.log,
    Busboy  = require('busboy'),
    sharp   = require("sharp");

v8.setFlagsFromString('--max_old_space_size=50');
//v8.setFlagsFromString('--max_new_space_size=50');
v8.setFlagsFromString('--trace_fragmentation');
//v8.setFlagsFromString('--trace_fragmentation_verbose');
v8.setFlagsFromString('--expose_gc');
sharp.cache(false);
sharp.concurrency(1);

module.exports.handler = (event) => new Promise((resolve, reject) => {
    let buffer;
    const busboy = new Busboy({
        headers: {
            'content-type': event.headers['content-type'] || event.headers['Content-Type'],
        }
    });

    busboy
    .on('file', (fieldname, file, filename, encoding, mimetype) => {
        log(fieldname, mimetype, encoding, filename);
        file.on('data', (data) => buffer = data);
    })
    .on('error', (err) => reject(`error: ${err}`))
    .on('finish', () => {
        sharp(buffer)
        .sequentialRead(true)
        //.resize({width: 500, height: 500})   //this operation can be anything - toFormat(), webp() etc.
        .toFormat("webp", {force: true})       //this operation can be anything - resize(), webp() etc.
        .toBuffer()
        .then(() => {
            log("=> before gc memoryUsage", process.memoryUsage());
            global.gc();
            log("=> after gc memoryUsage ", process.memoryUsage());

            const headers = {
                'content-type': "text/plain; charset=us-ascii"
            };
            resolve({statusCode: 200, body: "done", isBase64Encoded: false, headers});
        })
        .catch((err) => {
            log(err);
            reject(`error: ${err}`);
        });
    });

    busboy.write(Buffer.from(event.body, event.isBase64Encoded ? 'base64' : 'utf8'));
    busboy.end();
});
````

Now, i could see these memory related question in the forum and i tried to incorporate all the suggestions i could find
but without any luck

things tried
process.env.VIPS_DISC_THRESHOLD = '20m';
v8.setFlagsFromString('--max_old_space_size=50');
v8.setFlagsFromString('--max_new_space_size=50'); //this is not supported any more
sharp.cache(false);
sharp.concurrency(1);
sequentialRead(true)
```
also enabled gc - v8.setFlagsFromString('--expose_gc'); - and started running GC just before i return from the handler.
I am printing memoryUsage before and after the GC call on every function invokation.
the heap usage is almost constant as expected - only RSS keep on increasing and finally "Max Memory Used" hits the root.
i tried with different "MemorySize" starting from 128M to 512M (even though my sample app is very small, i tried to increase the MemorySize to prove my point)
Few sample logs below
in the start the Log is something like below - Max Memory Used: 162 MB
imageFile image/jpeg 7bit 00 (3rd copy).JPG
before gc memoryUsage { rss: 82427904, heapTotal: 22519808, heapUsed: 13582184, external: 1467043 }
compaction-selection: space=OLD_SPACE reduce_memory=0 pages=0 total_live_bytes=70
space=CODE_SPACE reduce_memory=0 pages=0 total_live_bytes=0
2 pages, 580344 (56.3%) free
after gc memoryUsage { rss: 81100800, heapTotal: 20082688, heapUsed: 9323088, external: 1467043 }
Duration: 3788.14 ms Billed Duration: 3800 ms Memory Size: 512 MB Max Memory Used: 162 MB
After few itertaion the Log is Max Memory Used: 369 MB
imageFile image/jpeg 7bit ali-al-mufti-365944-unsplash.jpg
before gc memoryUsage { rss: 195997696, heapTotal: 16015360, heapUsed: 13140688, external: 3533290 }
compaction-selection: space=OLD_SPACE reduce_memory=0 pages=0 total_live_bytes=21
compaction-selection: space=CODE_SPACE reduce_memory=0 pages=0 total_live_bytes=0
2 pages, 680840 (66.0%) free
after gc memoryUsage { rss: 191299584, heapTotal: 11300864, heapUsed: 8301824, external: 3533258 }
Billed Duration: 4100 ms Memory Size: 512 MB Max Memory Used: 369 MB
Towards the end before memory running out - Max Memory Used: 464 MB
compaction-selection: space=OLD_SPACE reduce_memory=0 pages=0 total_live_bytes=0
compaction-selection: space=CODE_SPACE reduce_memory=0 pages=0 total_live_bytes=0
[MAP_SPACE]: 2 pages, 692896 (67.2%) free
imageFile image/jpeg 7bit florian-klauer-489-unsplash.jpg
before gc memoryUsage { rss: 243482624, heapTotal: 23261184, heapUsed: 19224656, external: 5971426 }
compaction-selection: space=OLD_SPACE reduce_memory=0 pages=0 total_live_bytes=0
compaction-selection: space=CODE_SPACE reduce_memory=0 pages=0 total_live_bytes=0
2 pages, 686384 (66.6%) free
after gc memoryUsage { rss: 237264896, heapTotal: 15994880, heapUsed: 12989440, external: 4670102 }
Billed Duration: 19900 ms Memory Size: 512 MB Max Memory Used: 464 MB
Thanks
 oxi-p
oxi-p
All 21 comments
Is module.exports.handler = (event) => ... the Lambda handler?
If so, it doesn't support Promises so you'll need to accept more parameters and call the callback function it provides.
https://docs.aws.amazon.com/lambda/latest/dg/nodejs-prog-model-handler.html
module.exports.handler = (event, context, callback) => {
  ...
  callback();
}
Without this call, nothing inside the scope of your event handling function will be eligible for garbage collection.
 lovell
on 20 May 2019
lovell
on 20 May 2019
https://aws.amazon.com/blogs/compute/node-js-8-10-runtime-now-available-in-aws-lambda
Its a valid lambda handler, My handler is a function(Arrow) which returns the a promise. in that case i dont have to call the callback, just resolve or reject the promise i return - above link explains it.
By the way i ran this test on Lambda with Node 8.10 and the newest experimental Node 10.X .
The images are of average size of 2-4 MB
oxi-p
on 20 May 2019
Also, if you see the Heap usage i print on each execution - Heap is almost constant, even after i execute the same Lambda instance many times
Note: in each invocation of the function, towards the end i trigger GC all the time
oxi-p
on 20 May 2019
Ah, OK, thanks.
Is this 7500x11000px interlaced JPEG the florian-klauer-489-unsplash.jpg image referenced in the log that breaks things?
https://i2.wp.com/daniellecomer.com/wp-content/uploads/2018/07/florian-klauer-489-unsplash-1.jpg
If so, that's a relatively large, interlaced JPEG and will consume about 240MB in memory (sequential read is not possible from interlaced images).
You'll also have event.body in memory, possibly the base64 decoded version in memory, as well as anything that busboy allocates.
The call to global.gc() will not clear event data from the current invocation as it is still in scope, so 464MB seems reasonable for this request.
lovell
on 20 May 2019
image i am using is 5000 X 8000 and not the one you mentioned - mine is just 4.7 MB.
though the content is same (i think its the smaller version of image you mentioned). And once i exit the handler and the lambda gets invoked for next time, it should be cleaned in the next GC run. and even if its in the scope, it should be marked in my Heap usage - and my Heap usage never go above 15 MB
Note: its not related to images, it happens with all the images
oxi-p
on 20 May 2019
Node.js Buffers are allocated outside of the V8 heap, with only a small descriptor/pointer stored on the V8 heap as reported by process.memoryUsage().
As you've possibly seen on previous "memory issues", RSS includes free memory that has yet to be returned to the OS. A good example, if you've not seen it, is https://github.com/lovell/sharp/issues/955
I don't know which memory allocator the AWS Lambda runtime uses or if/how it reclaims from processes. If the runtime/OS isn't requesting free memory back then the RSS value will represent the peak memory requirement, possibly with some fragmentation (dependent on allocator).
Have you tried increasing the RAM available to your Lambda? You'll get more CPU share too, so the processing might be cheaper if the task is CPU-bound.
lovell
on 20 May 2019
Even though the buffer is allocated outside the heap, buffers gets freed when GC runs.
I have see the issue you mentioned, but then i dont get to choose the memory allocator in lambda.
As i mentioned in original question, i started the memory from 128 MB and increased it up to 512 MB with no luck. My small function does not that memory though.
By the way, i used JIMP with the same function,and i dont have this issue (but its slow :) )
So i think its something todo with sharp and Aws lambda combination
oxi-p
on 20 May 2019
I did a test to see the Lambda Max memory usage when i allocate buffer
"use strict";
const v8    = require("v8"),
    log     = console.log;

module.exports.handler = (event) => new Promise((resolve, reject) => {
    let buffer = Buffer.allocUnsafe(52428800); //50 MB
    log(buffer.length, buffer.byteLength);

    log("=> before gc memoryUsage", process.memoryUsage());
    global.gc();
    log("=> after gc memoryUsage ", process.memoryUsage());

    const headers = {
        'content-type': "text/plain; charset=us-ascii"
    };
    resolve({statusCode: 200, body: "done", isBase64Encoded: false, headers});
});
1) Allocate 50MB buffer
2) print memory usage
3) GC
4) print memory usage
Now if i see the lambda memory usage its constant even after i run the same function 100 times
Duration: 4.21 ms Billed Duration: 100 ms Memory Size: 512 MB Max Memory Used: 58 MB
Also RSS is constant.
This proves that Lambda doesn't have problem reclaiming the memory allocated to buffer
Then what could be the problem in "Sharp & Lambda combination" ?
oxi-p
on 21 May 2019
Are you still seeing this problem on the latest Node.js 10.x AWS Lambda environment?
I notice you mentioned max_new_space_size, which is now max_semi_space_size as the "new" objects heap is split in two. Could setting this force Node.js to run its GC earlier?
lovell
on 26 Jun 2019
Same effect. No luck yet
oxi-p
on 26 Jun 2019
We have the same problem with sharp in combination with AWS Lambda.
We use sharp solely to resize and optimize images before they get delivered to our CDN. By optimizing we specifically mean saving as JPEG, PNG or WEBP with one or more of the following parameters: quality, progressive, optimiseScans and compressionLevel
The log stream shows how the Lambda function is allocating more and more memory over time.

However, the memory increase does not happen on every execution. We had several execution with 206MB until it suddenly jumped up to 218MB with one execution.
Eventually we hit our defined limit of 512MB which immediately kills the process.
 sebastianhenneberg
on 20 Sep 2019
sebastianhenneberg
on 20 Sep 2019
I've been using sharp with Lambda in production environment over 1+ years. (Thanks to @lovell :bow:)
This issue is related with Lambda runtime's behavior. As you may know, Lambda can reuse container, and freezes container until after invocation. So the chance of V8's GC execution is quite low. also there is no background task capabilities including GC. GC only can be executed during Lambda invocation.
so IMHO It's better to use larger memory size configuration, Especially if you have to handle super high resolution images. Lambda allocates CPU power linearly in proportion to the amount of memory configured. there won't be big cost difference - allocating 2x memory size will give 2x processing speed. also it gives better function stability since it has more memory size - New container will be used before reaching max memory.
Also, Increasing VIPS_DISC_THRESHOLD might be help if you are having memory issues.
(Please refer to #707 or http://jcupitt.github.io/libvips/API/current/VipsImage.html#VIPS-ACCESS-RANDOM:CAPS)
 mooyoul
on 23 Sep 2019
mooyoul
on 23 Sep 2019
Thank you @mooyoul - I hope this helped others using AWS Lambda. Another benefit of using larger instance sizes is that you get a second vCPU for V8's GC thread to use in parallel with your handler's logic.
lovell
on 25 Oct 2019
As i have mentioned in my original post -
enabled gc - v8.setFlagsFromString('--expose_gc'); - and started running GC just before i return from the handler.
i am exposing GC using V8 flags and running it before i return from Lambda handler.
But with No luck - memory used just goes up up
So this is nothing todo with "Lambda running behaviour & Container reuse" as mentioned by @mooyoul
@lovell Can you please keep this open ?
oxi-p
on 25 Oct 2019
@oxi-p I recommend you speak with AWS support about this. I'd be happy for them to bring any discussion to this issue, if required.
It's clear from #955 that the choice of memory allocator impacts both the likelihood of memory fragmentation and the rate of return of freed memory to the OS, so that's probably a good place for them to start.
lovell
on 25 Oct 2019
@oxi-p we are facing the same issues. Did you find a solution? Did you contact the AWS support?
 davincho
on 11 Feb 2020
davincho
on 11 Feb 2020
@oxi-p we are facing the same issues. Did you find a solution?
 dimitrius-ion
on 19 Feb 2020
dimitrius-ion
on 19 Feb 2020
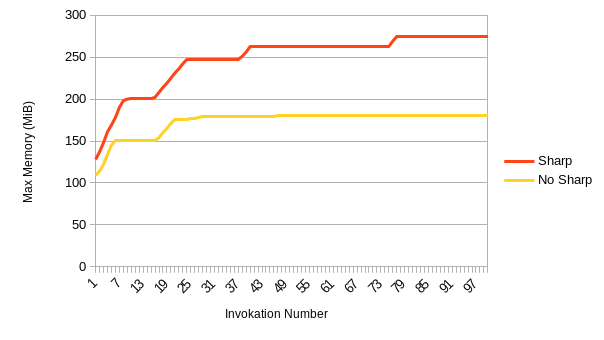
Also having the same issue. It was confusing to identify in a test environment as there can be long stretches (> 12 invokations) without an increase.
Edit: at least for me, it seems like it's working OK in a test environment. I graphed the memory usage over 100 invokations in quick succession, and it just seems to take longer to plateau than I expected.
 QMuncaster
on 19 May 2020
QMuncaster
on 19 May 2020
I was able to figure out the issue, but I don't think the answer is going to be satisfying to everyone.
For context I'm running an image resizer & converter that uses sharp on Node 12.x in Lambda. We're doing about 4k invocations an hour.
To fix the issue I just increased the amount of memory for the Lambda function to over 1GB. Eventually the garbage collector will kick in and the function will level off around 800-900mb of usage.
Since you get more CPU with larger memory sizes in Lambda, it actually doesn't seem to increase the cost in the long run. Doubling the amount of memory decreased the runtime by about half.
Currently I have the function set to 2GB of memory, and I haven't had any memory issues.
EDIT:
I see that I just repeated @mooyoul, but the advice is still sound.
 mckalexee
on 22 Jul 2020
mckalexee
on 22 Jul 2020
@mckalexee Glad you worked it out. Maximising CPU share via the "memory" setting remains the recommend approach for using sharp on AWS Lambda.
lovell
on 22 Jul 2020
@mckalexee Thank you for sharing your insights! You helped us to fix this annoying memory leak. We had this issue open for over 1 year. Thank you very much! 🙏
We already upped our memory in order to fix it, but we stopped at 512MB. Last week, we set it to 1024MB. Since then we had over 6M lambda executions. None of them ran out of memory. 🙂
I hope this helps a few more people around here.
sebastianhenneberg
on 28 Jul 2020
Related issues
 terbooter
·
3Comments
terbooter
·
3Comments
 OleVik
·
3Comments
OleVik
·
3Comments
 paulieo10
·
3Comments
paulieo10
·
3Comments
 vermin1337
·
3Comments
vermin1337
·
3Comments
 henbenla
·
3Comments
henbenla
·
3Comments
Most helpful comment
I've been using sharp with Lambda in production environment over 1+ years. (Thanks to @lovell :bow:)
This issue is related with Lambda runtime's behavior. As you may know, Lambda can reuse container, and freezes container until after invocation. So the chance of V8's GC execution is quite low. also there is no background task capabilities including GC. GC only can be executed during Lambda invocation.
so IMHO It's better to use larger memory size configuration, Especially if you have to handle super high resolution images. Lambda allocates CPU power linearly in proportion to the amount of memory configured. there won't be big cost difference - allocating 2x memory size will give 2x processing speed. also it gives better function stability since it has more memory size - New container will be used before reaching max memory.
Also, Increasing
VIPS_DISC_THRESHOLDmight be help if you are having memory issues.(Please refer to #707 or http://jcupitt.github.io/libvips/API/current/VipsImage.html#VIPS-ACCESS-RANDOM:CAPS)