Shap: Unable to view features of low/zero importance
Hello Everyone,
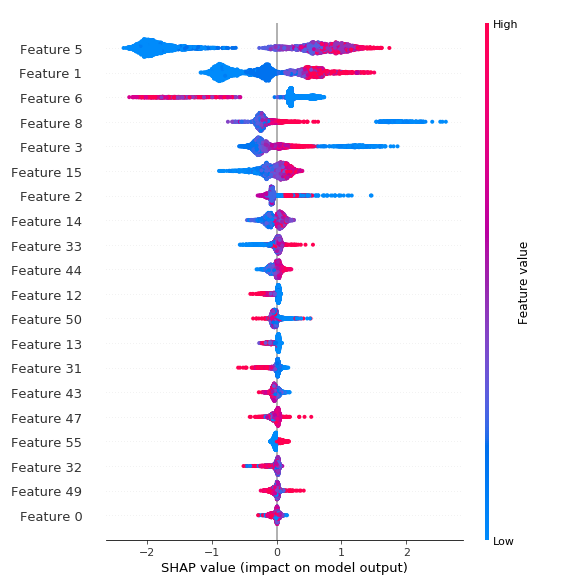
I am new to shap and trying to understand the model predictions through shap plot as shown below.
q1) As you can see in the below graph that only 12-13 features are visible in the plot. But my dataset has around 42-44 features? Does shap plot show only the important features or am I making any mistake here?
q2) Is there any other shap plot that I should use to see all the features?
Please find the code below that I wrote
shap.summary_plot(shap_values, features=X_train, feature_names=X_train.columns)
 SSMK-wq
>All comments
Have you tried the max_display parameter? By default, summary_plot displays top 20 features, which is exactly your case. If you need more, add this parameter with the value of the number of top features you would like to see. Exampe:
shap.summary_plot(shap_values, features=X_train, feature_names=X_train.columns, max_display=44)
will display the plot for all your 44 features.
 ibuda
on 27 Dec 2019
ibuda
on 27 Dec 2019
Related issues
 shoaibkhanz
·
4Comments
shoaibkhanz
·
4Comments
 saurabhhjjain
·
3Comments
saurabhhjjain
·
3Comments
 GitAnalyst
·
3Comments
GitAnalyst
·
3Comments
 resdntalien
·
3Comments
resdntalien
·
3Comments
 gabrielcs
·
3Comments
gabrielcs
·
3Comments
Most helpful comment
Have you tried the
max_displayparameter? By default,summary_plotdisplays top 20 features, which is exactly your case. If you need more, add this parameter with the value of the number of top features you would like to see. Exampe:will display the plot for all your 44 features.