Shap: Summary Plot for CatBoost MultiClass Shap Values
I'm having a lot of trouble trying to get the summary plot for shap values calculated from my CatBoost model.
Essentially I had a dataset with 4 classes, 400 features and I'm using the following code to build my model.
from catboost import Pool, CatBoostClassifier, EFstrType
import shap

dataset = Pool(data=features,
                     label=labels)

model = CatBoostClassifier(iterations=10,
                           learning_rate=1,
                           depth=2,
                           loss_function="MultiClass")

model.fit(dataset, plot=True)
Initially I tried using the shap package as seen in the demo notebooks:
explainer = shap.TreeExplainer(model)
shap_values = explainer.shap_values(X)
But I encounter the following error:
ValueError                                Traceback (most recent call last)
<ipython-input-124-4f15c13050bc> in <module>
----> 1 explainer = shap.TreeExplainer(model)
      2 shap_values = explainer.shap_values(scaled_features.to_numpy())

/opt/conda/anaconda/lib/python3.6/site-packages/shap/explainers/tree.py in __init__(self, model, data, model_output, feature_dependence)
     94         self.feature_dependence = feature_dependence
     95         self.expected_value = None
---> 96         self.model = TreeEnsemble(model, self.data, self.data_missing)
     97
     98         assert feature_dependence in feature_dependence_codes, "Invalid feature_dependence option!"

/opt/conda/anaconda/lib/python3.6/site-packages/shap/explainers/tree.py in __init__(self, model, data, data_missing)
    629             for i in range(ntrees):
    630                 l = len(self.trees[i].features)
--> 631                 self.children_left[i,:l] = self.trees[i].children_left
    632                 self.children_right[i,:l] = self.trees[i].children_right
    633                 self.children_default[i,:l] = self.trees[i].children_default

ValueError: could not broadcast input array from shape (31) into shape (19)
So instead I used CatBoosts shap value implementation which is simply:
shap_values = model.get_feature_importance(type=EFstrType.ShapValues, data=dataset). The resulting array is of shape: (1458048, 4, 401). CatBoost documentation points out in each row the last value is the Expected Value of Model Prediction.
Of course to exclude expected value I just index this as shap_values[:, :, :-1], however when feeding that array into shap_values param it fails. I'm semi-successful in just doing it for a single observation as shap.summary_plot(shap_values=shap_values[0, :, :-1], features=list(features.columns), plot_type="bar") BUT it doesn't show the bars for the varying classes, there is only 1 colour.
This might be multiple issues - if so, my apologies. I would greatly appreciate any help on the matter.
 AbhinavanT
All 8 comments
UPDATE
I've updated this to reflect correct solution (using transpose instead of reshape)
UPDATE
Okay so I've been messing around and I _think_ this is the fix. So CatBoost returns SHAP values for MultiClass models in a different shape AND object type than what the shap package expects - I believe there should be some documentation in the code about the expected dimensions & type for such case.
From my explanation above, CatBoost returns an array of shape (1458048, 4, 401) where I have 4 classes. For the summary_plot method however, it needs a list of arrays, where the list length is the number of classes. ~So essentially I need to reshape my array to (4, 1458048, 401) and then convert that to a list.~ Transpose instead.
# original_shape = shap_values.shape
# shap_values_reshaped = shap_values.reshape(original_shape[1], original_shape[0], original_shape[-1])
shap_values_transposed = shap_values.transpose(1, 0, 2)
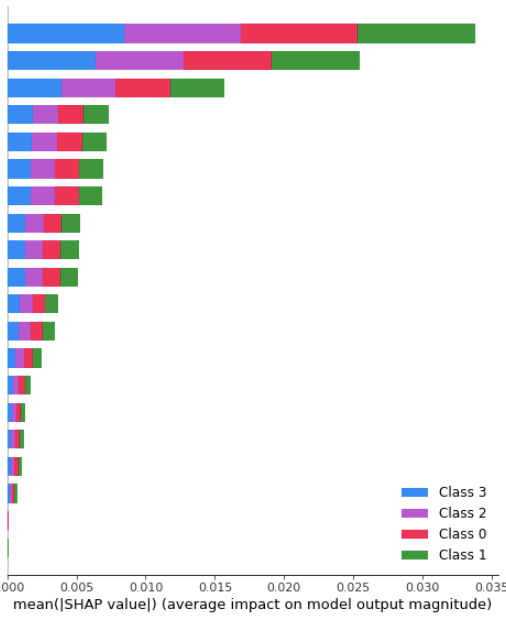
shap.summary_plot(shap_values=list(shap_values_transposed[:, :, :-1]), features=X_scaled)
Which gives me this (the colours are ugly I really want to change that next)
AbhinavanT
on 15 Aug 2019
@AbhinavanT Thank you very much! I had the same issue, including with the very latest release of shap (current commit on github), and it was driving me mad!
So to make this work, make sure to convert the reshaped shap values into a list, else it won't work! This is because shap expects multi-class shap values to be in a list, not in a 3D numpy array.
To make it clear: catboost returns a 3D numpy matrix for the shap values of dimension: [#samples, #classes, #features], whereas shap is expecting a list of 2D numpy matrices of shape [#samples, #features], the list length being #classes.
Also, if you have pooled your data with the output class labels, the code is a bit different. Here is a canonical example:
import catboost
import shap

# Fit your CatBoost classifier
pyver = 3
if pyver == 2:
    # For Python 2, CatBoost has currently a bug that makes it incapable of handling categorical features automatically, thus one needs to encode them beforehand
    # See https://github.com/catboost/catboost/issues/958
    model.fit(X_train_enc, y_train_enc,   # encoded X_train and y_train with a sklearn LabelEncoder
        cat_features=categorical_columns,
        eval_set=(X_test_enc, y_test_enc),  # idem for X_test and y_test
        #logging_level='Verbose',  # you can uncomment this for text output
        plot=True #Uncomment and you'll see really great real time interactive graph
    )
else:
    # Python 3, CatBoost can handle categorical features automatically, no need for an encoder
    model.fit(X_train, y_train,
        cat_features=categorical_columns,
        eval_set=(X_test, y_test),
        #logging_level='Verbose',  # you can uncomment this for text output
        plot=True #Uncomment and you'll see really great real time interactive graph
    )

# Use a KernelExplainer since catboost is not yet supported by TreeExplainer
explainer = shap.KernelExplainer(model.predict_proba, X_train)
#shap_values = explainer.shap_values(X_train) # does not work with current shap version if using a catboost classifier
shap_values = model.get_feature_importance(catboost.Pool(X_train, y_train, cat_features=categorical_columns), type=catboost.EFstrType.ShapValues)  # can use 'ShapValues' instead for the type, and categorical_columns is the list of the columns names where the values are categorical

# visualize the first prediction's explanation
shap.force_plot(explainer.expected_value[0], shap_values[0], feature_names=X_orig.columns, out_names=list(y_train.unique()))

# summarize the effects of all the features in a multi-class barplot
original_shape = shap_values.shape
shap_values_reshaped = shap_values.reshape(original_shape[1], original_shape[0], original_shape[-1])
shap.summary_plot(list(shap_values_reshaped[:,:,:-1]), features=X_train, class_names=y_train.unique(), plot_type='bar')
This is what you get (the features and class names are named, I hid them here by removing the features and class_names arguments):
Note that if you do not reshape and convert to a list your shap values, in other words if you input a 3D numpy matrix, you'll get a 2D plot of the pairwise shap value interaction between all features & classes, which is NOT correct because shap is assuming that the two last dimensions are #features, when in reality it's #classes, #features:
shap.summary_plot(shap_values[:,:-1,:-1], features=X_train, plot_type='dot')
Which gives this:
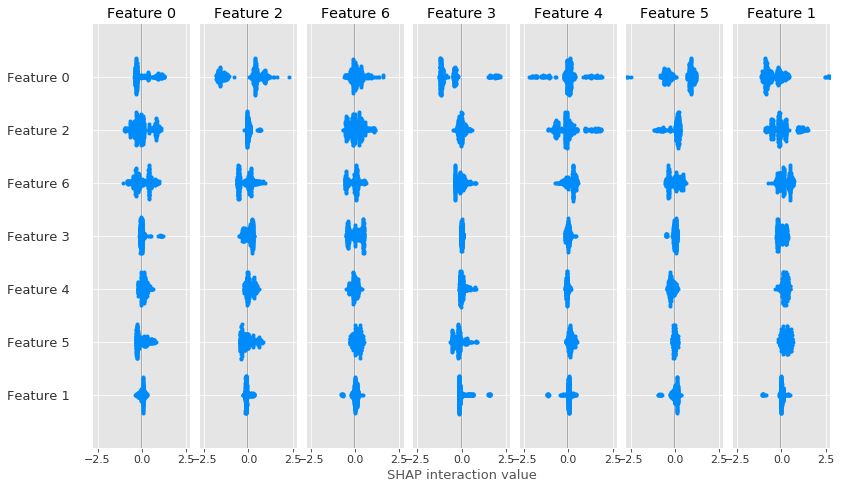
This kind of plot is not described in the readme, but I guess it should be used on the output of shap.TreeExplainer(model).shap_interaction_values(X), which currently does not work for catboost.
I think these examples should be added to the catboost/shap tutorial, that would be extremely helpful (since shap does not support catboost any other way yet #761 #753 ). As well as #367 to help with the interpretation in multi-class case.
 lrq3000
on 20 Aug 2019
lrq3000
on 20 Aug 2019
PS: I'm not sure the class naming is correct (class_names=y_train.unique()), I'm reading the catboost documentation to understand in what order the classes are detected in returned in the shap values. If someone has any idea? :-)
lrq3000
on 20 Aug 2019
UPDATE: using reshape is wrong! We need to use transpose to get an appropriately rearranged ndarray, else with reshape, all classes will get the same mean SHAP value!
Here is the updated code, using transpose:
# Summarize the effects of all the features in a multi-class barplot
# See for more explanations on how it was done: https://github.com/slundberg/shap/issues/750
# To understand how to interpret this graphic, see: https://github.com/slundberg/shap/issues/367
# TODO: fix order of class names, not sure this is the order used by catboost!
# Transpose the 3D numpy ndarray (shape [#samples, #classes, #features]) so we place the classes first
#original_shape = shap_values.shape
#shap_values_reshaped = shap_values.reshape(original_shape[1], original_shape[0], original_shape[-1], order='C') # not the correct way of doing it, you will get the same mean SHAP value for all classes!
shap_values_transposed = shap_values.transpose(1, 0, 2)
assert shap_values[0, 1, 2] == shap_values_transposed[1, 0, 2] # just check we've done it right
print(shap_values_transposed.shape)
# Then we convert the transposed shap values into a list, where each element will be a 2D numpy matrix of shape [#samples, #features] as expected by the shap package
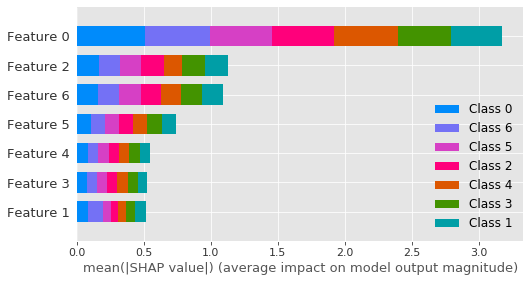
shap.summary_plot(list(shap_values_transposed[:,:,:-1]), features=X_train, class_names=y_train.unique(), plot_type='bar')
And here is the correct graphic (you can compare with the one above to see that here each class gets a different mean SHAP values):

I also checked that the order used for the features is correct on my dataset, I know that feature 0 is the most important one by far, and this is what we see here in the figure. And feature 2 and 6 are just after as expected. I also double checked with other explaining packages such as skater, which work as-is on catboost, and the result is similar, so this looks like the correct way of plotting the summary plot with the shap package on catboost for now (until shap fixes the TreeExplainer support).
lrq3000
on 20 Aug 2019
@lrq3000 Good catch! I wasn't certain of reshape and in fact just went into the docs to refresh myself on the difference between reshape and transpose. Clearly reshape is wrong as it's just forcing the existing arrays into the specified dimensions rather than pivoting them.
I'm using the solution you provided - wasn't even aware of KernelExplainer so that's a plus!
AbhinavanT
on 20 Aug 2019
Thanks for digging through this and sorry for the confusions along the way. I am adding a to-do tag here to try and make this better in the future when I get to updating the CatBoost interface.
 slundberg
on 1 Sep 2019
slundberg
on 1 Sep 2019
I am getting 6 classes on the summary plot, while the class in the data is only 4. How do I fix this
The model is SVM
x_pool=Tfidf_vect.transform(low_conf['text']).toarray()
explainer = shap.LinearExplainer(model, x_train,feature_dependence="independent")
shap_values_pool = explainer.shap_values(x_pool)
np.asarray(shap_values_pool).shape
Result (6,1004,5000)
shap.summary_plot(shap_values_pool, features=x_pool, feature_names=Tfidf_vect.get_feature_names())

I have done the transposing but got me an error
The shape of the shap_values matrix does not match the shape of the provided data matrix.
How do i fix this. Thank you for your help
 rmfajri
on 13 Nov 2019
rmfajri
on 13 Nov 2019
I have been banging my head for the whole day to solve this issue.
For some reason, the solution proposed by OP does not work for me (i.e. transpose and wrapping the transposed result in a list) and I ended up with the error "The shape of the shap_values matrix does not match the shape of the provided data matrix." (probably this is relevant to @rmfajri ). Note that, I am working on a single output regression problem.
I solved my problem by reshaping the 3D input numpy array to 2D (#samples * #number of features).
What is important here is to make sure that you reshape the parameters of summary plot, namely both the numpy array of shap_values and X_train (that you assigned to the "features" parameter in the summary_plot).
After reshaping the two parameters, make sure that the shape of shap_values is similar to the shape of X_train.
 GlorianY
on 6 Oct 2020
GlorianY
on 6 Oct 2020
Related issues
 grofte
·
4Comments
grofte
·
4Comments
 franciscorodriguez92
·
4Comments
franciscorodriguez92
·
4Comments
 cbeauhilton
·
3Comments
cbeauhilton
·
3Comments
 saurabhhjjain
·
3Comments
saurabhhjjain
·
3Comments
 TdoubleG
·
4Comments
TdoubleG
·
4Comments
Most helpful comment
UPDATE
I've updated this to reflect correct solution (using transpose instead of reshape)
UPDATE
Okay so I've been messing around and I _think_ this is the fix. So CatBoost returns SHAP values for MultiClass models in a different shape AND object type than what the
shappackage expects - I believe there should be some documentation in the code about the expected dimensions & type for such case.From my explanation above, CatBoost returns an array of shape
(1458048, 4, 401)where I have 4 classes. For thesummary_plotmethod however, it needs a list of arrays, where the list length is the number of classes. ~So essentially I need to reshape my array to(4, 1458048, 401)and then convert that to a list.~ Transpose instead.Which gives me this (the colours are ugly I really want to change that next)