Shap: dependence_plot categorical features
I've worked through the "Tree ensemble example with TreeExplainer (XGBoost/LightGBM/CatBoost/scikit-learn models)" example but switching catboost for xgboost. I got everything to work except
shap.dependence_plot
If I pass X as a pandas.DataFrame I get "ValueError: could not convert string to float: 'New Years Day'" but if I pass X as a catboost.Pool I get "TypeError: 'Pool' object is not subscriptable"
Is there any way to get this working?
 david-waterworth
All 17 comments
The issue is that catboost can handle string valued categorical variables, and right now dependence_plot expects all features to be numerical. Perhaps we should fix that, but for now you can convert the categorical variables to numbers and then pass the matrix with strings as the display_features argument.
 slundberg
on 31 Dec 2018
slundberg
on 31 Dec 2018
Thanks @slundberg
I've not tried yet, but it would be nice if it could handle pandas categorical columns (i.e. pandas.Series.astype('category')), that way both the label and encoding are maintained in the same structure. Unlike R though this doesn't seem to be a commonly used python pattern - I guess as it's not part of the standard python library and most machine learning libraries are based on numpy?
david-waterworth
on 1 Jan 2019
Seems like a good feature, though I can't promise any timeline. I'll leave this with a todo tag in case anyone wants to pick that up.
slundberg
on 2 Jan 2019
i had this same exact question. In lieu of a solution soon, how does one use the display_features parameter. In the NHANES example it looks like X_display is just the dataframe itself. Thanks.
 MotoRZR
on 14 Jan 2019
MotoRZR
on 14 Jan 2019
@MotoRZR The display_features array should be a parallel array to the original dataframe and can have strings in place of numeric categorical encodings.
slundberg
on 18 Jan 2019
Gotcha, cheers.
MotoRZR
on 23 Jan 2019
I'm interested in this feature. There is some workaround beyond one-hot-encoding? Like using Pool of catboost to handle the cat_features.
 ryukinix
on 13 Feb 2019
ryukinix
on 13 Feb 2019
Perhaps I misunderstood you question @ryukinix, but there is no need to one-hot encode anything. The numbers you give above just define the x-axis and the display_features define the names.
slundberg
on 16 Feb 2019
Oh, right, I misunderstood the workaround you provided. Thanks for the attention.
ryukinix
on 16 Feb 2019
This works if I put the categorical column as a interactioin_index. However, when I put it in the ind argument (x axis), it give me error:
set_xticks() got an unexpected keyword argument 'rotation'
The plot still show, but the x-axis is numerical instead of categorical
 xiaoyaoyang
on 14 Aug 2019
xiaoyaoyang
on 14 Aug 2019
Hi, does this work only with string categorical features? Or is it supposed to work with features of type category as well?
 gmyrianthous
on 20 Apr 2020
gmyrianthous
on 20 Apr 2020
@gmyrianthous I haven't tested with category, but if it does not work feel free to share a broken example or a PR :)
slundberg
on 23 Apr 2020
Hey, I've tested it with category, and it's not working.
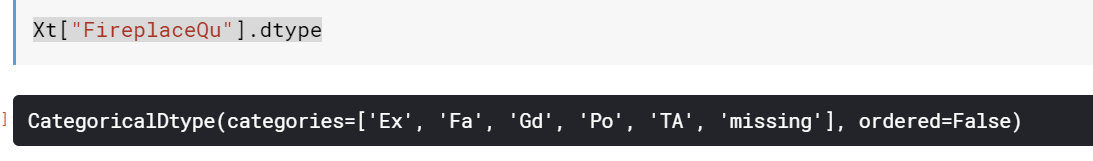
X is the feature DataFrame. FireplaceQuis a categorical type.
Xt, Xv, yt, yv = train_test_split(X, y)
tpool = Pool(Xt, yt, cat_features=cat_features)
vpool = Pool(Xv, yv, cat_features=cat_features)
explainer = shap.TreeExplainer(m)
shap_values = explainer.shap_values(tpool)
shap.dependence_plot("FireplaceQu", shap_values, tpool)
ValueError                                Traceback (most recent call last)
<ipython-input-298-691630829094> in <module>
----> 1 shap.dependence_plot("FireplaceQu", shap_values, tpool)

/opt/conda/lib/python3.7/site-packages/shap/plots/dependence.py in dependence_plot(ind, shap_values, features, feature_names, display_features, interaction_index, color, axis_color, cmap, dot_size, x_jitter, alpha, title, xmin, xmax, ax, show)
    101         features = np.reshape(features, len(features), 1)
    102
--> 103     ind = convert_name(ind, shap_values, feature_names)
    104
    105     # guess what other feature as the stongest interaction with the plotted feature

/opt/conda/lib/python3.7/site-packages/shap/common.py in convert_name(ind, shap_values, feature_names)
    268                 return "sum()"
    269             else:
--> 270                 raise ValueError("Could not find feature named: " + ind)
    271                 return None
    272         else:

ValueError: Could not find feature named: FireplaceQu
 nickcorona
on 17 Jun 2020
nickcorona
on 17 Jun 2020
@nickcorona that error is probably coming because the dependence_plot does not know about the feature names. If you pass Xt (which I assume is a DataFrame with a column named FireplaceQu) instead of tpool I expect it would work.
slundberg
on 17 Jun 2020
So, I've tried that as well, and I also get an error, just a different one.
shap.dependence_plot("FireplaceQu", shap_values, Xt)
ValueError                                Traceback (most recent call last)
<ipython-input-21-c8250da05cbf> in <module>
----> 1 shap.dependence_plot("FireplaceQu", shap_values, Xt)

/opt/conda/lib/python3.7/site-packages/shap/plots/dependence.py in dependence_plot(ind, shap_values, features, feature_names, display_features, interaction_index, color, axis_color, cmap, dot_size, x_jitter, alpha, title, xmin, xmax, ax, show)
    106     if not hasattr(ind, "__len__"):
    107         if interaction_index == "auto":
--> 108             interaction_index = approximate_interactions(ind, shap_values, features)[0]
    109         interaction_index = convert_name(interaction_index, shap_values, feature_names)
    110     categorical_interaction = False

/opt/conda/lib/python3.7/site-packages/shap/common.py in approximate_interactions(index, shap_values, X, feature_names)
    305     interactions = []
    306     for i in range(X.shape[1]):
--> 307         val_other = X[inds, i][srt].astype(np.float)
    308         v = 0.0
    309         if not (i == index or np.sum(np.abs(val_other)) < 1e-8):

ValueError: could not convert string to float: 'RL'
print(shap.__version__)
print(catboost.__version__)

0.35.0
0.23.2
Ah that's because dependence plot does not handle string values by default, it wants you to map them to numbers first. This should be supported though I think. Mind opening a separate issue for it?
slundberg
on 18 Jun 2020
Ah that's because dependence plot does not handle string values by default, it wants you to map them to numbers first. This should be supported though I think. Mind opening a separate issue for it?
Created here:
https://github.com/slundberg/shap/issues/1275
nickcorona
on 18 Jun 2020
Related issues
 SaadAhmed96
·
3Comments
SaadAhmed96
·
3Comments
 grofte
·
4Comments
grofte
·
4Comments
 nickkimer
·
4Comments
nickkimer
·
4Comments
 samupino
·
3Comments
samupino
·
3Comments
 artemmavrin
·
4Comments
artemmavrin
·
4Comments