Hi,
Thank you for this great work. Do you have any plans to make it possible to explain RNN/LSTM models? Right now I have to make the explanation with LIME and then I plot it with force_plot.
 hcthorsen
All 30 comments
DeepExplainer is one option that is designed for deep models. I just pushed a new version that will land in v0.23 so if you run into issues try the github master :)
 slundberg
on 15 Aug 2018
slundberg
on 15 Aug 2018
Ok. And DeepExplainer also deals with models with 3D input (samples x timesteps x features)?
When I try to use DeepExplainer I get following error:

I guess the reason is the same as described in #218. I have to wait for v0.23, right?
hcthorsen
on 15 Aug 2018
How can I use force_plot to plot the Recurrent Neural Network's (RNN) model when we use a sequence of _n_ instances for classification? In normal classification models, single instances are used in Train and Test sets, however, in RNN you can use, for example, a sequence of 3 instances as Time-series data, for training and testing. In this case, what matters is the information that a sequence of 3 instances carries and this sequence is used for classifying data!
Imagine you want to classify people by features of their heartbeat but using a single heartbeat it is not possible to classify the data. So, we use the information of 3 consecutive heartbeats (3 instances) and we feed them to RNN.
So, I would like to know if the current version of SHAP supports RNN with a sequence of n instances or not?
Regards
 amirjalilifard
on 16 Aug 2018
amirjalilifard
on 16 Aug 2018
@hcthorsen I would try that again on 0.23 and make sure you still get the same error before we look into it. NotEqual produces a boolean output, so it would be good to know how it is being used in your model to compute the model output. In theory we can pass attributions though a boolean function by considering True as 1 and False as 0, but I would like to make sure we know how it is being used first.
slundberg
on 18 Aug 2018
@amirjalilifard I think the real answer is to create a text_plot or a series_plot that are specifically designed to display that data. However, if you want to make a force_plot you can just flatten the attribution array you get from DeepExplainer down to 1D (or 2D for an area plot) and then pass it to force plot. You will just need to pass the right feature names then so you know what instance each feature came from (like pulse (1) or pulse (2) for instances 1 and 2).
If you have a time series with 20 sample instances each of which has 5 features, then you can stack them into a 20 x 5 array and pass that to force plot. If you then sort by original sample order you will see the attributions for all 20 times points stacked over time.
slundberg
on 18 Aug 2018
I managed to get the DeepExplainer working after the new update to v0.23. As mentioned earlier I work with a LSTM classifier. Like @amirjalilifard I would like to to make a force_plot, that illustrates the contribution of the different features with timesteps as the x-axis. I can make the force_plot, but it's not making much sense. All the contributions are very small, and it's far from adding up to the prediction. In the example below there is 49 timesteps and 75 features, so shap_values[0][1] is a 49*75 array.
hcthorsen
on 26 Aug 2018
If the sum does not match the model output plus the base value then
something is wrong. Would you mind trying the Gradient Explainer and seeing
if it works? If it does then that will narrow it down to something with
DeepExplainer. Thanks.
On Sun, Aug 26, 2018 at 12:52 PM hcthorsen notifications@github.com wrote:
I managed to get the DeepExplainer working after the new update to v0.23.
As mentioned earlier I work with a LSTM classifier. Like @amirjalilifard
https://github.com/amirjalilifard I would like to to make a force_plot,
that illustrates the contribution of the different features with timesteps
as the x-axis. I can make the force_plot, but it's not making much sense.
All the contributions are very small, and it's far from adding up to the
prediction. In the example below there is 49 timesteps and 75 features, so
shap_values[0][1] is a 49*75 array.[image: image]
https://user-images.githubusercontent.com/30860976/44632363-ac339a00-a979-11e8-8649-488e2a3b0f6c.png—
You are receiving this because you commented.Reply to this email directly, view it on GitHub
https://github.com/slundberg/shap/issues/213#issuecomment-416065622, or mute
the thread
https://github.com/notifications/unsubscribe-auth/ADkTxYsGUHuBMnXRgzvR8J-QMhTYjw7zks5uUvxsgaJpZM4V5kSc
.
slundberg
on 27 Aug 2018
I found out why the sum does not match the model output plus the base value.
My sequences are not of the same length, so I pad with zeros and use a masking layer.
The masking layer confuses the DeepExplainer. If I remove the masking layer the sum of the SHAP values and base value adds up to the prediction. Do you know if there is a way to keep masking?
hcthorsen
on 27 Aug 2018
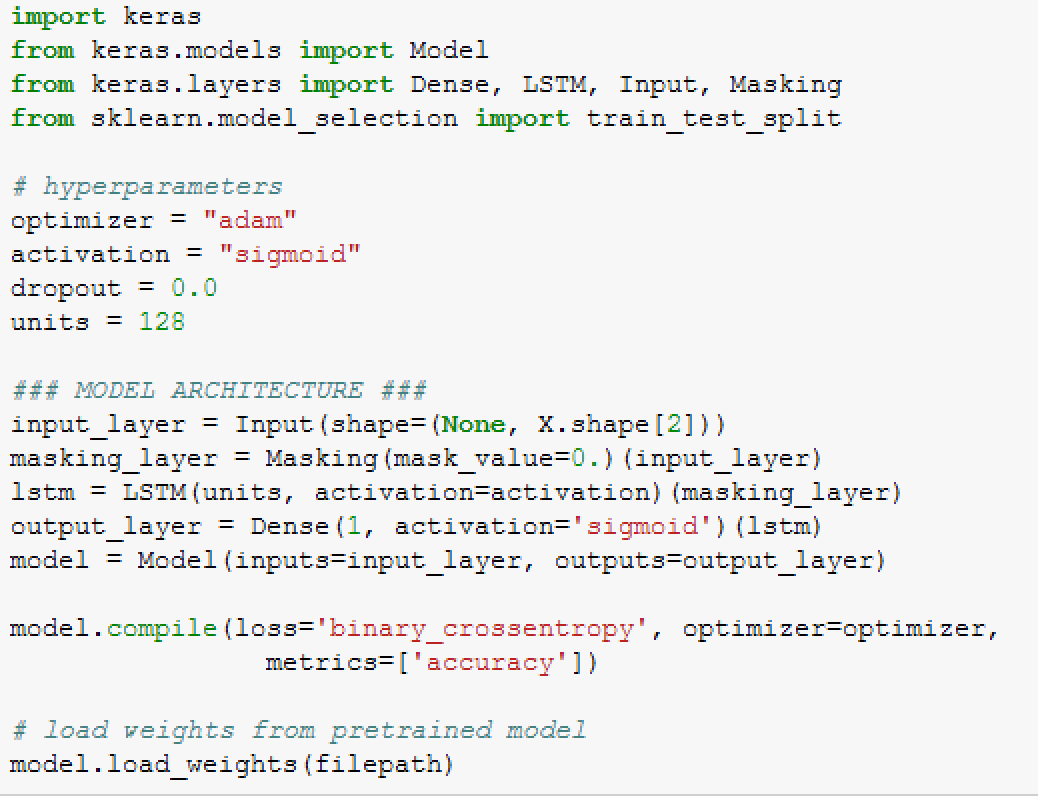
Great! Could you share the piece of code that makes the masking layer? That
way I can figure out which low-level TF operation it creates that might
cause the problem.
slundberg
on 27 Aug 2018
I just started with a very simple model. Sorry about the screenshot, but I work in an environment where I can't copy/paste text):
hcthorsen
on 27 Aug 2018
Thanks. When I get a chance I'll add a masking layer to the current LSTM
example for DeepExplainer and see if I can reproduce the problem.
On Mon, Aug 27, 2018 at 2:30 PM hcthorsen notifications@github.com wrote:
I just started with a very simple model. Sorry about the screenshot, but I
work in an environment where I can't copy/paste text):[image: image]
https://user-images.githubusercontent.com/30860976/44687284-1bc88880-aa51-11e8-9fcd-219907669fe2.png—
You are receiving this because you commented.Reply to this email directly, view it on GitHub
https://github.com/slundberg/shap/issues/213#issuecomment-416375518, or mute
the thread
https://github.com/notifications/unsubscribe-auth/ADkTxfcL6GT0KSbdp57s2tEf-zS77AT-ks5uVGUNgaJpZM4V5kSc
.
slundberg
on 27 Aug 2018
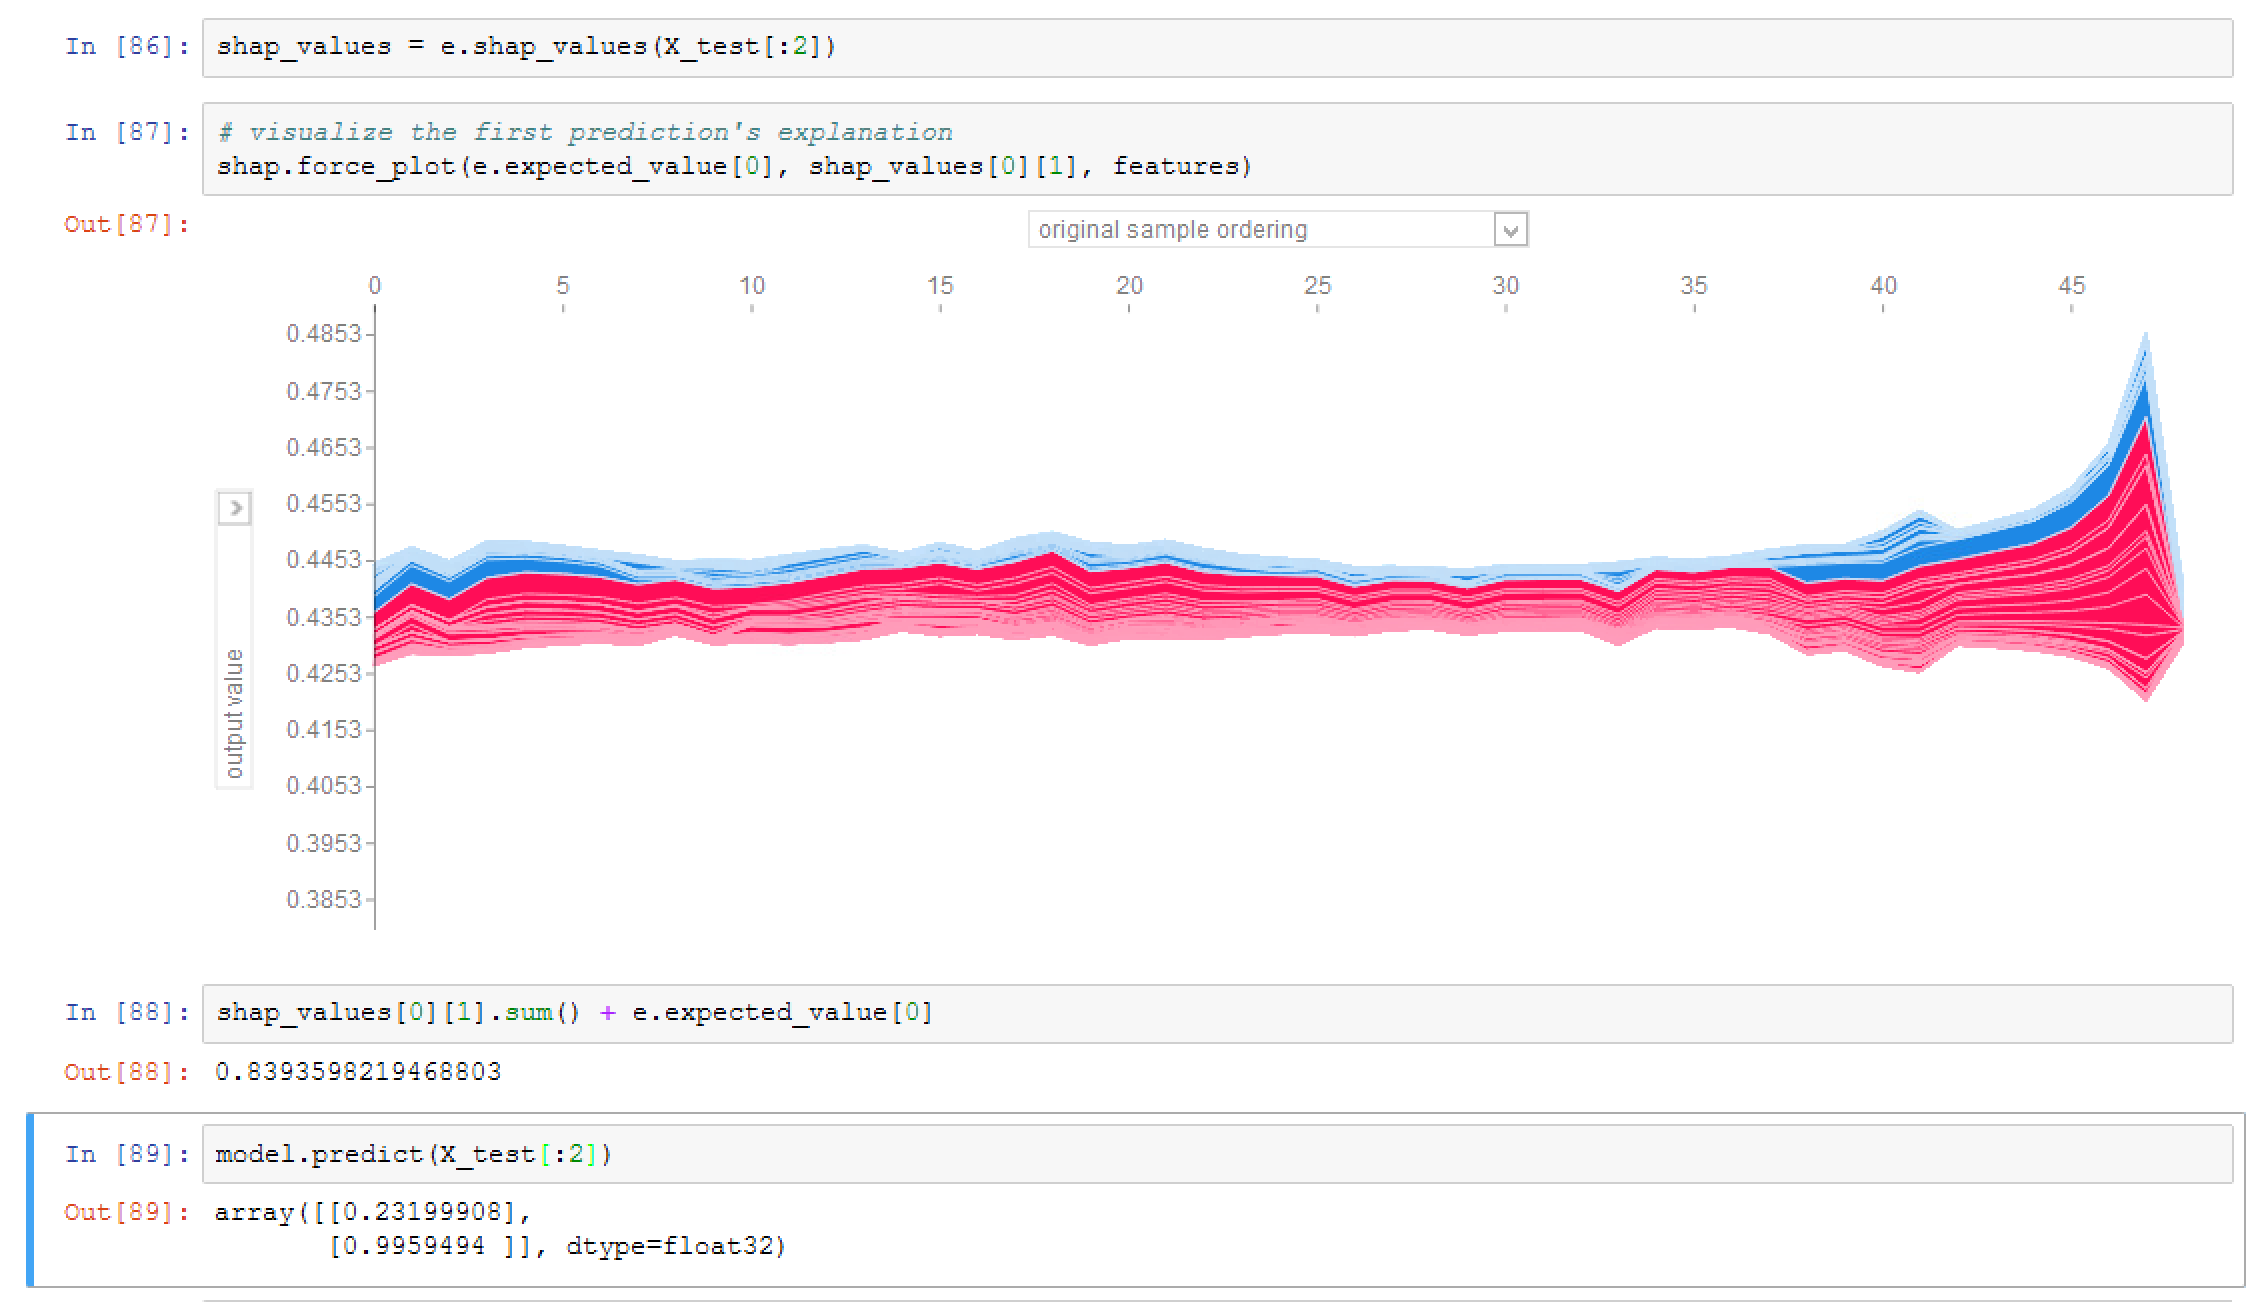
Hi, I'm also having trouble with the prediction value given with the sum of contributions, when using a LSTM model. I'm working on pytorch and I also have input data with variable sequence length, so I suspect that it's because of the padding that I did. To try to prevent this issue, I did some modifications to the DeepExplainer in my forked version (essentially, I added the option to indicate the original sequence lengths when calling the model's feedforward method). However, although it seems to assign a bigger contribution to relevant features, the sum of the contributions is still wrong, as you can see in the force plot bellow:

Real output values for this sequence:
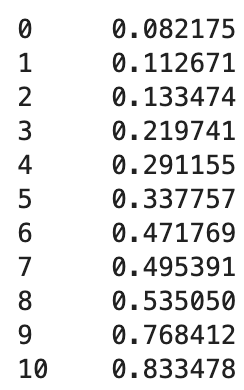
Is there any way for SHAP to work with this kind of padded data?
 AndreCNF
on 13 Jun 2019
AndreCNF
on 13 Jun 2019
@AndreCNF it is hard to debug without a concrete example. Could you share a small stripped down notebook that demonstrates the issue?
slundberg
on 19 Jun 2019
Hi @slundberg. Thank you for answering. Here's a simple notebook demonstrating the problem with a dummy dataset: https://github.com/AndreCNF/shap-variable-sequence-pytorch-debug
I can't provide the original data that I'm using, as it's not public. But this simple example is enough to show that contribution scores don't add up to the real output value.
AndreCNF
on 26 Jun 2019
Thanks! I looked through (and ran) the example, and it is involved enough that it will take more time to dig through I think. For example could you clarify what the output of the model is in relation to the inputs? Normally I get outputs from a model that have the same first dimension as the input dataset, but in your case that's not how it seems to be working.
Also @gabrieltseng may have some insights here.
slundberg
on 26 Jun 2019
Thank you @slundberg for looking through the example! Essentially, I'm working on Electronic Medical Records, where we have a time series for each patient, with variable sequence length. The output that we want to predict is related to the well being of the patient / disease progression, and so each instance of each time series has its own output label. As such, the output's dimension would be [batch_size, max_sequence_length, 1], being that there is only one output per instance and that we need to do padding on the time series, adding fake instances, so that every sequence has the same length (equal to the longest on the batch).
AndreCNF
on 26 Jun 2019
Hi @AndreCNF ,
RNNs aren't yet supported for the PyTorch DeepExplainer (A warning pops up to let you know which modules aren't supported yet: Warning: unrecognized nn.Module: RNN). In this case, the explainer assumes the module is linear, and makes no change to the gradient. Since RNNs contain nonlinearities, this is probably contributing to the problem.
You can see the layers which are explicitly supported here: https://github.com/slundberg/shap/blob/master/shap/explainers/deep/deep_pytorch.py#L352
Adding RNN support for the PyTorch DeepExplainer is definitely planned, but is a little tricky because - since a lot of stuff is hidden in PyTorch's C++ backend - RNN layers can't be broken down into their simpler operations.
 gabrieltseng
on 28 Jun 2019
gabrieltseng
on 28 Jun 2019
As an additional note, using the GradientExplainer instead of theDeep Explainer should work.
gabrieltseng
on 29 Jun 2019
Hi again @slundberg and @gabrieltseng. Thank you for discussing the issues with me. Meanwhile, I've tried both the Gradient and the Kernel Explainers and both were still not complying with local accuracy (sum of SHAP values different from the real output). So, I've changed a bit Kernel Explainer's code in my forked version of SHAP. Now, everything seems to be working fine for RNNs on PyTorch! I've also published an article on Towards Data Science about SHAP and also this adaptation to RNNs: https://towardsdatascience.com/interpreting-recurrent-neural-networks-on-multivariate-time-series-ebec0edb8f5a
AndreCNF
on 1 Aug 2019
Hello,
Is there any way to support 3D input/output Keras models using DeepExplainer?
The shapes for the input and output vectors are (batch size, sequence length, features) and (batch size, sequence length, 1). This is how I build the model and the error when using DeepExplainer.
num_features = 20
num_outputs = 1

model = Sequential()
model.add(LSTM(units=128, return_sequences=True, activation='relu', input_shape=(None, num_features)))
model.add(TimeDistributed(Dense(units=128, activation='relu')))
model.add(TimeDistributed(Dense(units=num_outputs, activation='sigmoid')))

model.compile(loss='binary_crossentropy', optimizer='Adagrad')
 pablovicente
on 2 Sep 2019
pablovicente
on 2 Sep 2019
Does SHAP analysis with KernelExplainer work for say a VARMAX model - will that be possible?
 shamitb
on 24 Sep 2019
shamitb
on 24 Sep 2019
@shamitb VARMAX is just a linear model so you can use the formula phi_i = beta_i * (x_i - E[x_i]) to compute the SHAP values from each of the coefficients. If you want to not have the residuals as some of the input features (i.e. map those back to the original time series) then you might need to write that out and see if it is a linear dependence on the original data.
slundberg
on 25 Sep 2019
@AndreCNF great in depth article! Sorry I was avoiding email a bit during vacation this summer and missed when you posted this in August. In the not to distant future I want to take some time to consider how to improve support for deep time series models. Sounds like what you are working on if very related and would love to see more when I get to working on that!
slundberg
on 25 Sep 2019
I am working on a multivariate time series data. I saw the demo of SHAP on LSTM for IMDB sentiment classification. In that case, SHAP explains the contribution of each word. In wording embedding, all the dimensions at a time step represent a word. But in the case of multivariate time series, each dimension at a time step represents a feature. Is it possible for SHAP to explain the contribution of each feature at a time step?
 wmmxk
on 11 Dec 2019
wmmxk
on 11 Dec 2019
@wmmxk Yes, if you use GradientExplainer then you get attributions of the same shape as your input and you can add them up how you like. For KernelExplainer you might need to write a bit of a wrapper to toggle things how you want.
slundberg
on 11 Dec 2019
@slundberg Thanks so much for your reply. That is cool.
wmmxk
on 11 Dec 2019
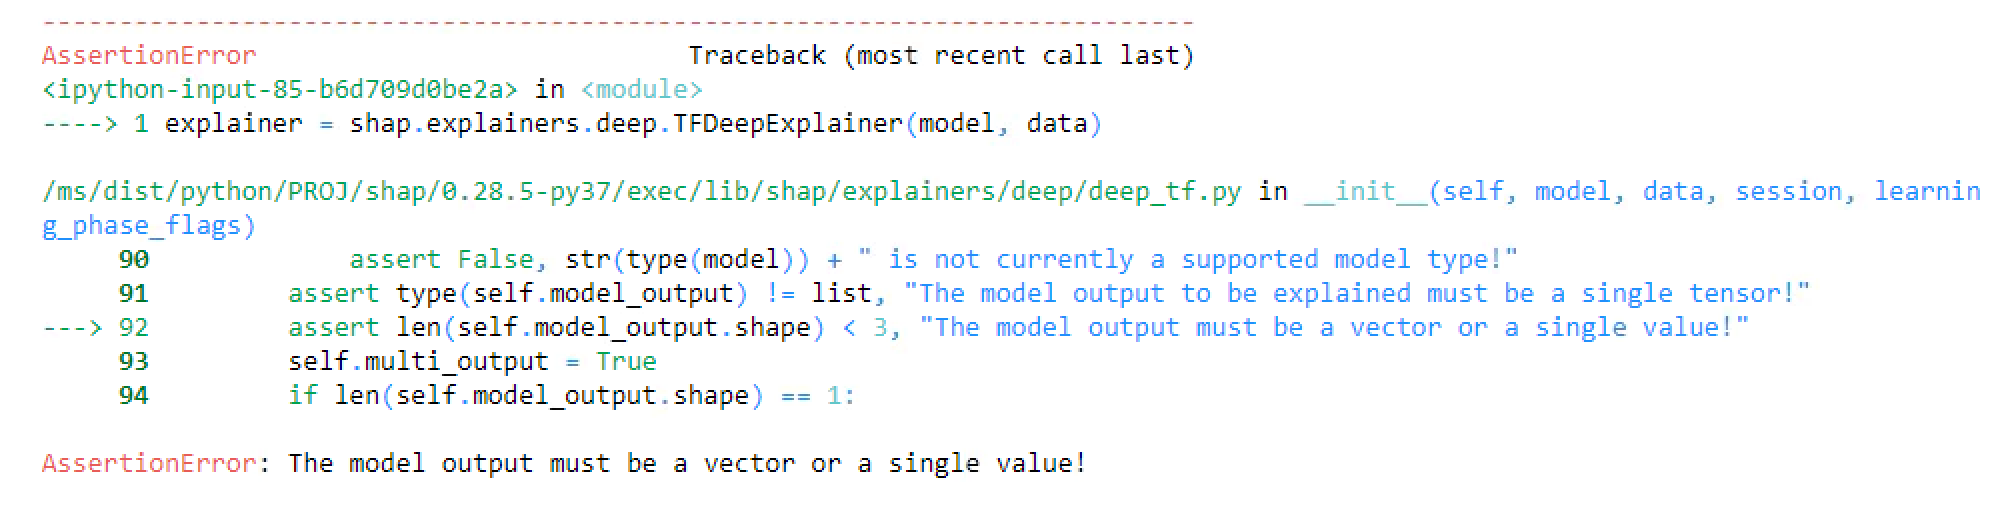
I have a TCN (Temporal convolutional network) code written on Tf2.0. I used both GradientExplainer and DeepExplainer and for both I am getting this error:
AssertionError:
Would you please help me what is the problem?
 Noohshiny
on 28 Jan 2020
Noohshiny
on 28 Jan 2020
I have a TCN (Temporal convolutional network) code written on Tf2.0. I used both GradientExplainer and DeepExplainer and for both I am getting this error:
AssertionError:
is not currently a supported model type! Would you please help me what is the problem?
don't use keras subclass
 JefferyLondon
on 10 Feb 2020
JefferyLondon
on 10 Feb 2020
@pablovicente @slundberg did you find a way to make it work for 3D data?
 Nazanin84
on 29 Jun 2020
Nazanin84
on 29 Jun 2020
@Nazanin84 : I guess you should try GradientExplainer for 3D input data
 GlorianY
on 6 Oct 2020
GlorianY
on 6 Oct 2020
Related issues
 grofte
·
4Comments
grofte
·
4Comments
 SaadAhmed96
·
3Comments
SaadAhmed96
·
3Comments
 ArpitSisodia
·
3Comments
ArpitSisodia
·
3Comments
 yolle103
·
3Comments
yolle103
·
3Comments
 artemmavrin
·
4Comments
artemmavrin
·
4Comments
Most helpful comment
@AndreCNF great in depth article! Sorry I was avoiding email a bit during vacation this summer and missed when you posted this in August. In the not to distant future I want to take some time to consider how to improve support for deep time series models. Sounds like what you are working on if very related and would love to see more when I get to working on that!