Sf: group_by and summarise with sf objects
Hello,
I am trying to aggregate a sf object and struggling. I try to do this:
grid_emissions <- grid_emissions %>%
                    group_by(pollutant, group, geom) %>%
                      summarise(sailing = sum(sailing),
                                berth = sum(berth))
But am told 'Error in grouped_df_impl(data, unname(vars), drop) :
Column geom can't be used as a grouping variable because it's a sfc_MULTIPOLYGON/sfc'
This works (by removing geom from the group by), but I end up with only one feature, when there should be around 100 if I recall correctly.
grid_emissions <- grid_emissions %>%
                    group_by(pollutant, group) %>%
                      summarise(sailing = sum(sailing),
                                berth = sum(berth))
I thought perhaps I could do this instead:
aggregate(data = as.tibble(grid_emissions), sailing ~ pollutant + group + geom, FUN=sum)
But I get the error - "Error in model.frame.default(formula = sailing ~ pollutant + group + geom, :
invalid type (list) for variable 'geom'"
Any ideas? Thanks!
 JimShady
All 22 comments
Without a reproducible example I cannot do anything.
 edzer
on 11 Dec 2018
edzer
on 11 Dec 2018
Fair enough @edzer . I will make one later. I figured you might be able to inform me if I'm even using the commands appropriately on SF data.
JimShady
on 11 Dec 2018
Hello @edzer . Here's a reproducible example. My expectation is that the result is 166 features. Instead I get only 1 feature. I guess I'm doing something wrong?
test_data <- st_read('https://github.com/JimShady/laei_river_data/raw/master/test_data.gpkg')
unique(test_data[,c('group', 'geom')])
[166]
head(test_data)
Simple feature collection with 6 features and 2 fields
geometry type: MULTIPOLYGON
dimension: XY
bbox: xmin: 538000 ymin: 177000 xmax: 555000 ymax: 181316.3
epsg (SRID): 27700
proj4string: +proj=tmerc +lat_0=49 +lon_0=-2 +k=0.9996012717 +x_0=400000 +y_0=-100000 +ellps=airy +towgs84=446.448,-125.157,542.06,0.15,0.247,0.842,-20.489 +units=m +no_defs
# A tibble: 6 x 3
sailing group geom
<dbl> <int> <MULTIPOLYGON [m]>
1 2.52 2 (((554000 177621.9, 554005.6 177626, 554008.8 177628.9, 554020 177644.7, 554026.4 17...
2 7.2 2 (((538000 181000, 539000 181000, 539000 180532.2, 538999.6 180532.1, 538966.1 180522...
3 9.98 2 (((544000 181000, 544964.4 181000, 544933 180966.9, 544856.1 180874.5, 544823.6 1808...
4 5.18 2 (((550000 181000, 550261 181000, 550269.3 180996.2, 550335.3 180963.6, 550357.8 1809...
5 3.6 2 (((552000 178445.3, 551991.5 178447.7, 551981.4 178451.3, 551968.2 178457.2, 551940....
6 0.48 2 (((549000 181316.3, 549077.6 181272.8, 549164.4 181235.7, 549294 181187.7, 549375.6 ...
result <- test_data %>%
group_by(group) %>%
summarise(sailing = sum(sailing))
head(result)
Simple feature collection with 1 feature and 2 fields
geometry type: MULTIPOLYGON
dimension: XY
bbox: xmin: 523000 ymin: 174000 xmax: 558000 ymax: 187000
epsg (SRID): 27700
proj4string: +proj=tmerc +lat_0=49 +lon_0=-2 +k=0.9996012717 +x_0=400000 +y_0=-100000 +ellps=airy +towgs84=446.448,-125.157,542.06,0.15,0.247,0.842,-20.489 +units=m +no_defs
# A tibble: 1 x 3
group sailing geom
<int> <dbl> <MULTIPOLYGON [m]>
1 2 190472. (((541000 175000, 542000 175000, 542000 174000, 541000 174000, 541000 175000)), ((52...
It's like the function is merging all of the geometries into one. When I want to group them by similar geometries.
Thanks in advance for any ideas....
James
JimShady
on 11 Dec 2018
I guess this is what you should expect when group is a constant:
> as.data.frame(test_data) %>% group_by(group) %>% summarise(sailing = sum(sailing))
# A tibble: 1 x 2
group sailing
<int> <dbl>
1 2 190472.
My guess is the OP wants to mutate a new column containing the group-wise sum rather than "collapsing" the data with summarize.
 jsta
on 11 Dec 2018
jsta
on 11 Dec 2018
I'm struggling to explain what I expect from the result. If I was writing the query in PostGIS it would be:
SELECT geom, group, SUM(sailing) FROM test_data GROUP BY geom, group
The result would be 166 rows long. Every value in the group column would be '2'. There would be 166 rows, due to the 166 unique geometries (out of the 365 rows in test_data).
I should add that there will actually be more like 10-20 'groups' rather than just '2' in the actual data
JimShady
on 11 Dec 2018
Does this produce what you expect?
library(sf)
library(dplyr)
test_data <- st_read('https://github.com/JimShady/laei_river_data/raw/master/test_data.gpkg')
result <- test_data %>%
group_by(group) %>%
mutate(sailing = sum(sailing, na.rm = TRUE))
There is only one value in test_data$group, as @edzer says. The data (365 by 3) are very messy, with a linear structure imposed on grid cells:
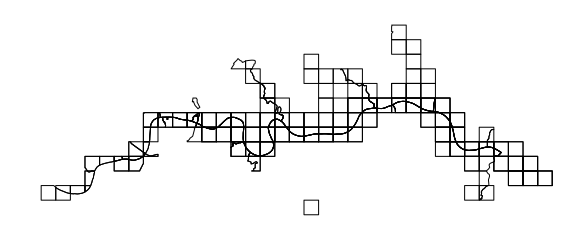
and little (visible) variability in the variable of interest. Say the real data has more group levels to group by, I guess the OP wanted:
> tapply(test_data$sailing, list(test_data$group), sum)
2
190471.9
here with one group, because that is all there is in the example. There are 365 geometries in the object. However, many are equal to each other in extent, so this isn't a group_by thing at all, the summations are needed over equal sets of geometries. st_equals gives:
> oo <- st_equals(st_geometry(test_data))
> table(sapply(oo, length))
1 2 3
43 94 228
The singletons are easy, but we need to drop the duplicate sets for the pairs and triples. Ideas?
 rsbivand
on 11 Dec 2018
rsbivand
on 11 Dec 2018
How else to put the issue. Haha. Er. There are only 166 unique geometries in my data. Not 365. I want to condense the 365 to 166, and sum the sailing variable as I do it. I might be making things worse by trying to explain more to be honest....
JimShady
on 11 Dec 2018
I'll make a larger test dataset and share it shortly. I think it'll make things clearer.
JimShady
on 11 Dec 2018
@rsbivand -- yes, I think you understand what my issue is now. Thanks for illustrating it for me.
JimShady
on 11 Dec 2018
Afternoon @edzer , @rsbivand @jsta . Thank you for your help with this still. I've made a new test_data dataset which I think is better at illustrating what I'm trying to achieve.
test_data <- st_read('https://github.com/JimShady/laei_river_data/raw/master/test_data.gpkg')
test_data
Simple feature collection with 365 features and 1 field
geometry type: MULTIPOLYGON
dimension: XY
bbox: xmin: 523000 ymin: 174000 xmax: 558000 ymax: 187000
epsg (SRID): NA
proj4string: +proj=tmerc +lat_0=49 +lon_0=-2 +k=0.9996012717 +x_0=400000 +y_0=-100000 +ellps=airy +towgs84=446.448,-125.157,542.06,0.15,0.247,0.842,-20.489 +units=m +no_defs
First 10 features:
sailing geom
1 2.52 MULTIPOLYGON (((554000 1776...
2 7.20 MULTIPOLYGON (((538000 1810...
3 9.98 MULTIPOLYGON (((544000 1810...
4 5.18 MULTIPOLYGON (((550000 1810...
5 3.60 MULTIPOLYGON (((552000 1784...
6 0.48 MULTIPOLYGON (((549000 1813...
7 6.25 MULTIPOLYGON (((536872.4 18...
8 2.28 MULTIPOLYGON (((537000 1786...
9 0.15 MULTIPOLYGON (((539338.9 18...
10 3.02 MULTIPOLYGON (((536872.4 18...
unique(test_data[,'geom'])
[1] 166
How do I condense the geometries to only be 166, and sum the 'sailing' column as I do so? My result should be 166 features.
Something like this feels appropriate, but it doesn't work
test_data %>%
group_by(geom) %>%
summarise(sailing = sum(sailing))
In my actual data I will have an additional 'group' column too. But the above is the crux of the problem I think. Thanks.
JimShady
on 12 Dec 2018
With downloaded data (I think) before your change above ...
Is this a possibility? A production version could detect the counts of equal polygons itself, here done by hand. Please check to see whether the sums are right (not handling groups here as they are all the same):
library(sf)
test_data <- st_read('https://github.com/JimShady/laei_river_data/raw/master/test_data.gpkg')
oo <- st_contains(test_data)
table(sapply(oo, length))
# these are hard-coded, but could use the as.integer(names()) of the table() above
oo3 <- unique(do.call("rbind", sapply(oo, function(x) if (length(x) == 3L) x)))
oo2 <- unique(do.call("rbind", sapply(oo, function(x) if (length(x) == 2L) x)))
oo1 <- unique(do.call("rbind", sapply(oo, function(x) if (length(x) == 1L) x)))
agg3 <- do.call("rbind", apply(oo3, 1, function(i) aggregate(test_data[i, "sailing"], by=list(rep(TRUE, length(i))), FUN=sum)))
agg2 <- do.call("rbind", apply(oo2, 1, function(i) aggregate(test_data[i, "sailing"], by=list(rep(TRUE, length(i))), FUN=sum)))
agg1 <- do.call("rbind", apply(oo1, 1, function(i) aggregate(test_data[i, "sailing"], by=list(rep(TRUE, length(i))), FUN=sum)))
aggs <- do.call("rbind", list(agg1, agg2, agg3))
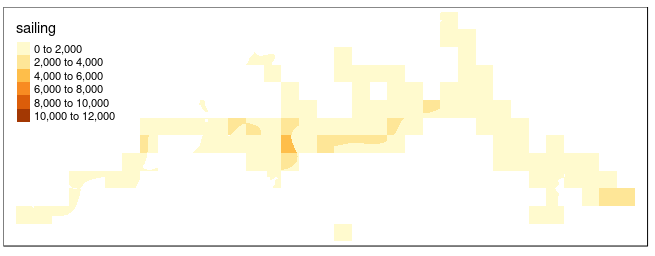
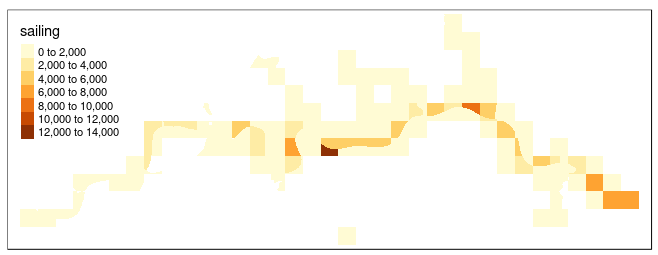
plot(aggs)
summary(aggs)
#Group.1 sailing geometry
#Mode:logical Min. : 0.0 MULTIPOLYGON : 3
#TRUE:166 1st Qu.: 0.9 POLYGON :163
# Median : 164.7 epsg:NA : 0
# Mean : 1147.4 +proj=tmer...: 0
# 3rd Qu.: 1302.0
# Max. :13013.0
rsbivand
on 12 Dec 2018
Apologies for changing the test_data there @rsbivand . I was trying to be helpful (!).
Your code above seems to have achieved what I need, but it's going to take me a little while to understand what you have done, and how to apply it to my larger dataset. It also feels like there should be an easier way?
JimShady
on 12 Dec 2018
Ok so here's a mega hacky way of achieving what I need. Which unfortunately doesn't end up with the geometry in-tact, but might be helpful.
test_data <- st_read('https://github.com/JimShady/laei_river_data/raw/master/test_data.gpkg')
test_data$geom_text <- as.character(st_geometry(test_data))
test_data$geom <- NULL
test_data <- test_data %>%
group_by(geom_text) %>%
summarise(sailing = sum(sailing))
I essentially force group_by to use the geom as a text field to achieve the result. Unfortunately I'm not sure how to re-instate the geom_text back to a proper geometry column now....
JimShady
on 12 Dec 2018
I tried this:
> test_data$grp = sapply(st_equals(test_data), max)
> test_data %>% group_by(grp) %>% summarize(sum_sailing = sum(sailing))
Simple feature collection with 166 features and 2 fields
geometry type:  GEOMETRY
dimension:      XY
bbox:           xmin: 523000 ymin: 174000 xmax: 558000 ymax: 187000
epsg (SRID):    NA
proj4string:    +proj=tmerc +lat_0=49 +lon_0=-2 +k=0.9996012717 +x_0=400000 +y_0=-100000 +ellps=airy +towgs84=446.448,-125.157,542.06,0.15,0.247,0.842,-20.489 +units=m +no_defs
# A tibble: 166 x 3
     grp sum_sailing                                                        geom
   <int>       <dbl>                                              <GEOMETRY [m]>
 1    85        0.04 POLYGON ((550000 179000, 551000 179000, 551000 178000, 550…
 2   110        0.48 POLYGON ((545425.6 182000, 545425.8 182005.6, 545427.6 182…
 3   124        0.44 POLYGON ((544000 183000, 544473.6 183000, 544486.1 182994.…
 4   125        0.37 POLYGON ((553000 176000, 553615.3 176000, 553612.6 175998.…
 5   132        0.14 POLYGON ((543545.8 184000, 544000 184000, 544000 183245.9,…
 6   135        0.02 POLYGON ((543000 184000, 543545.8 184000, 543544.8 183991.…
 7   136        0    POLYGON ((541000 175000, 542000 175000, 542000 174000, 541…
 8   137        1.11 POLYGON ((544473.6 183000, 545000 183000, 545000 182909, 5…
 9   153        1.96 POLYGON ((539338.9 181000, 539367.6 181043.6, 539386.3 181…
10   154        2.78 MULTIPOLYGON (((539338.9 181000, 539175.2 181000, 539182.2…
# … with 156 more rows
st_equals is the "proper" way of finding identical geometries; we now (arbitrarily) group them to the last index of a group, using max.
edzer
on 12 Dec 2018
Amazing. Thanks @edzer. That's it. Thank you.
JimShady
on 12 Dec 2018
Well, a quibble: you don't have the equal polygon ids there, so:
test_data %>% mutate(grp=sapply(st_equals(.), function(i) paste(i, collapse="_"))) %>% group_by(grp) %>% summarize(sum_sailing=sum(sailing))
but because this is too tidy, you lose the intermediate products. This also only works if you know without doubt that there are no overlaps or gaps, that is the equality test passes for geometry precision. Like all tidyverse stuff, it needs data cleanly meeting its expectations (here it does). There is no group column now, but it should be trivial to add it back to group by. Using SE lets you see everything that is going on inside, and with NSE/tidy we still needed an sapply() which could derail if st_equals() hits a snag. Actually, pipes and NSE/verbs may involve much more trouble when things don't work, are not used inside functions in general, so you have to master base syntax anyway to get work done.
Bottom line: without the SE analysis, it would not have been feasible to break the problem down.
rsbivand
on 12 Dec 2018
Here is a tidyverse version to replace sapply:
test_data %>% mutate(grp = st_equals(.) %>% purrr::map(max) %>% unlist()) -> test_data
which looks convoluted -- I hope somebody can come up with a simpler version.
edzer
on 12 Dec 2018
Still not there - I really think that max() is too simple, because it doesn't list the polygons being grouped. It gets the sums and polygon unions by group, but if you need their IDs, you have to go back to the beginning. Can you put paste(., collapse="_") inside map()? (and why not Map()?).
rsbivand
on 12 Dec 2018
The purrr::map() and base::Map() (base::mapply() ) do not simplify their output, so the tidy version of sapply would be required. https://jennybc.github.io/purrr-tutorial/bk01_base-functions.html#sapply()_vs_%C2%AF_(%E3%83%84)_%C2%AF tells me to try purrr::map_chr(), so I did. My latest is:
test_data <- st_read('https://github.com/JimShady/laei_river_data/raw/master/test_data.gpkg')
f <- function(i) paste(i, collapse="_")
test_data %>% mutate(grp=st_equals(.) %>% purrr::map_chr(f)) %>% group_by(grp) %>% summarize(sum_sailing=sum(sailing)) -> grouped_test_data
head(grouped_test_data)


md5-71f758202970f58591ce83be6244ca6f


test_data <- st_read('https://github.com/JimShady/laei_river_data/raw/master/test_data.gpkg')
f <- function(i) paste(i, collapse="_")
grp <- factor(sapply(st_equals(test_data), f))
SE_grouped_test_data <- aggregate(test_data, list(grp), sum)


md5-a45daf532f44cf8857e9b5b42f244f5f


head(SE_grouped_test_data)


md5-a45daf532f44cf8857e9b5b42f244f5f


all.equal(SE_grouped_test_data$sailing, grouped_test_data$sum_sailing)
# [1] TRUE
Thanks for that link!
edzer
on 13 Dec 2018
Related issues
 WWolf
·
25Comments
WWolf
·
25Comments
 jeffreyhanson
·
52Comments
jeffreyhanson
·
52Comments
 pssguy
·
27Comments
pssguy
·
27Comments
 RCura
·
27Comments
RCura
·
27Comments
 rundel
·
44Comments
rundel
·
44Comments
Most helpful comment
I tried this:
st_equalsis the "proper" way of finding identical geometries; we now (arbitrarily) group them to the last index of a group, usingmax.