Sf: Rotation of sf objects does not work anymore
I have followed the example to rotate features in the Vignette at https://cran.r-project.org/web/packages/sf/vignettes/sf3.html.
rot = function(a) matrix(c(cos(a), sin(a), -sin(a), cos(a)), 2, 2)

nc = st_read(system.file("shape/nc.shp", package="sf"), quiet = TRUE)
ncg = st_geometry(nc)
plot(ncg, border = 'grey')
cntrd = st_centroid(ncg)
## Warning in st_centroid.sfc(ncg): st_centroid does not give correct
## centroids for longitude/latitude data
ncg2 = (ncg - cntrd) * rot(pi/2) * .75 + cntrd
plot(ncg2, add = TRUE)
plot(cntrd, col = 'red', add = TRUE, cex = .5)
Unfortunately this does not work anymore, as you can see in the markdown example in the vignette as well. In the end I did not get the rotated features only the centroids of them.
The rotation works with sf 0.6-0, so I've reinstalled this version.
Hope, you can find the issue and fix it.
 danceb
All 7 comments
Thanks -- this is because of #675 -- you can't use a single operator for two things. I'll try to think of a way out.
 edzer
on 7 Apr 2018
edzer
on 7 Apr 2018
Thanks for the attempt to find a solution. Maybe writing a new inbuilt function st_rotateor something would be great.
danceb
on 10 Apr 2018
@edzer - the new revision of the operators still do not give the same result as in the past. For example, a piece of code from vignette 3:
library(sf)
#> Linking to GEOS 3.6.1, GDAL 2.1.4, proj.4 4.9.3
rot = function(a) matrix(c(cos(a), sin(a), -sin(a), cos(a)), 2, 2)
nc = st_read(system.file("shape/nc.shp", package="sf"), quiet = TRUE)
ncg = st_geometry(nc)
plot(ncg, border = 'grey')
cntrd = st_centroid(ncg)
#> Warning in st_centroid.sfc(ncg): st_centroid does not give correct
#> centroids for longitude/latitude data
ncg2 = (ncg - cntrd) * rot(pi/2) * .75 + cntrd
plot(ncg2, add = TRUE)
plot(cntrd, col = 'red', add = TRUE, cex = .5)

 Nowosad
on 13 Apr 2018
Nowosad
on 13 Apr 2018
I see this:
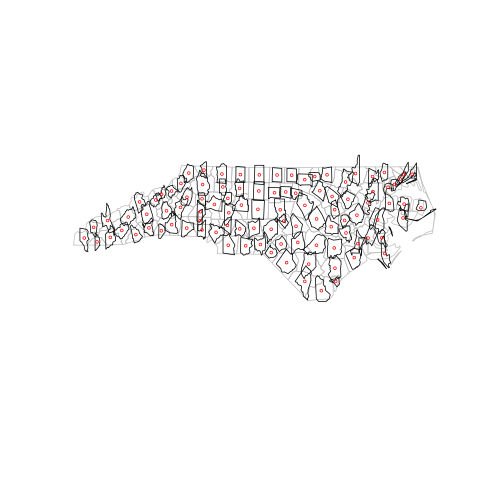
which LGTM.
edzer
on 13 Apr 2018
Oh sorry, my bad. I have seen the example in the third vignette (https://r-spatial.github.io/sf/articles/sf3.html#affine-transformations) and wrongly thought that it is still not working.
Nowosad
on 13 Apr 2018
It's not auto-updated (I know, #687)
edzer
on 13 Apr 2018
(now updated)
edzer
on 13 Apr 2018
Related issues
 kendonB
·
4Comments
kendonB
·
4Comments
 happyshows
·
3Comments
kendonB
·
3Comments
happyshows
·
3Comments
kendonB
·
3Comments
 gregmacfarlane
·
4Comments
gregmacfarlane
·
4Comments
 matthewpaulking
·
4Comments
matthewpaulking
·
4Comments
Most helpful comment
Thanks for the attempt to find a solution. Maybe writing a new inbuilt function
st_rotateor something would be great.