Sf: creating lines from points w/ grouping
I am struggling to determine the optimal/best workflow for creating
multiple lines from sf point objects that have a group identifier.
This seems like it should be a pretty straightforward process -- and, it very well may be -- but I can't quite figure it out with the existing documentation, etc.
Let's first create an sf/data.frame from latlong point data
library(sf)
library(tidyverse)

pts_sf <- data.frame(
  x = seq(47, 48, by=0.1),
  y = seq(147, 148, by=0.1),
  attr_data = rnorm(11,42,42),
  id = c(rep("fred",6), rep("wilma",5))
) %>%
  sf::st_as_sf(coords = c("x","y")) %>%
  sf::st_set_crs(4326)

pts_sf
Simple feature collection with 11 features and 2 fields
geometry type:  POINT
dimension:      XY
bbox:           xmin: 47 ymin: 147 xmax: 48 ymax: 148
epsg (SRID):    4326
proj4string:    +proj=longlat +datum=WGS84 +no_defs
   attr_data    id          geometry
1  -32.28072  fred     POINT(47 147)
2   45.37867  fred POINT(47.1 147.1)
3   56.77862  fred POINT(47.2 147.2)
4   48.94170  fred POINT(47.3 147.3)
5  -26.56757  fred POINT(47.4 147.4)
6  -25.84003  fred POINT(47.5 147.5)
7   23.10022 wilma POINT(47.6 147.6)
8   23.09363 wilma POINT(47.7 147.7)
9   85.06559 wilma POINT(47.8 147.8)
10  59.14303 wilma POINT(47.9 147.9)
11 -19.68219 wilma     POINT(48 148)
If I want to create a linestring from this, I can simply
l <- pts_sf %>% st_coordinates() %>% st_linestring()
l
```
LINESTRING(47 147, 47.1 147.1, 47.2 147.2, 47.3 147.3, 47.4 147.4, 47.5 147.5, 47.6 147.6, 47.7 147.7, 47.8 147.8, 47.9 147.9)
But, what to do if I want to end up with multiple linestrings with
one for "fred" and another for "wilma" ?

Intuition tells me there should be some way to implement a pipe chain with group_by() and st_multilinestring() e.g.

```r
ml <- pts_sf %>% group_by(id) %>% st_coordinates() %>% st_multilinestring()
But, that doesn't seem to work because st_coordinates() drops the group and also
st_multilinestring() is expecting a list.
in PostGIS, I would do something like:
SELECT sf_pts.id, ST_MakeLine(sf_pts.geometry) As line_geom
    FROM sf_pts
GROUP BY sf_pts.id;
So, maybe a similar sf::st_makeline() function would be beneficial?
 jmlondon
All 8 comments
is
> pts_sf %>% group_by(id) %>% summarize(m = mean(attr_data)) %>% st_cast("LINESTRING")
Simple feature collection with 2 features and 2 fields
geometry type:  LINESTRING
dimension:      XY
bbox:           xmin: 47 ymin: 147 xmax: 48 ymax: 148
epsg (SRID):    4326
proj4string:    +proj=longlat +datum=WGS84 +no_defs
     id        m                       geometry
1  fred 51.11700 LINESTRING(47 147, 47.1 147...
2 wilma 63.77475 LINESTRING(47.6 147.6, 47.7...
what you are looking for?
 edzer
on 28 Apr 2017
edzer
on 28 Apr 2017
Ah yes! ... summarize() was the missing piece.
Is there an advantage/difference between this approach (collection of LINESTRINGs) and casting to a MULTIPOINT/MULTILINESTRING with groups/ids?
I think it could still be worth considering whether an st_MakeLine() -like function would offer an improvement. Although, it could just end up being a redundant wrapper for st_cast("LINESTRING").
jmlondon
on 28 Apr 2017
sf now has about 125 functions, 85 starting with st_. I'd like to try to make these number smaller, rather than larger, for the sake of usability. But others might disagree, and say that larger numbers are more usable. Anyway, this would be a discussion for a new issue.
edzer
on 30 Apr 2017
st_cast("LINESTRING") doesnt work nice for me. It creates a line, but it breaks the order of the points at it appears to arrange(lon,lat), beforeheand because line jumps all over the Y space instead of following a nice path.
Here is a minimal working example building on jmlondon's example:
pts_sf <- data.frame(
x = c(seq(47, 48, by=0.1), seq(48, 47, by=-0.1)),
y = c(seq(147, 148, by=0.1,),seq(148, 149, by=0.1,)),
attr_data = rnorm(11,42,42),
id = rep("fred",22)) %>%
sf::st_as_sf(coords = c("x","y")) %>%
sf::st_set_crs(4326)
plot(pts_sf)
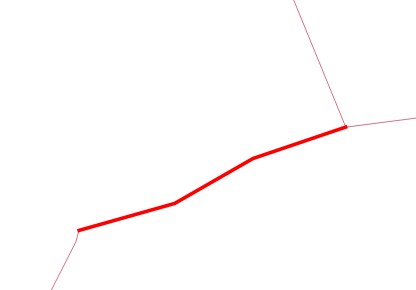
this line goes up-right from (47,147) to (48,148), then up-left from (48,148) to (47,149)
pts_sf%>% st_coordinates() %>% st_linestring() %>% plot()
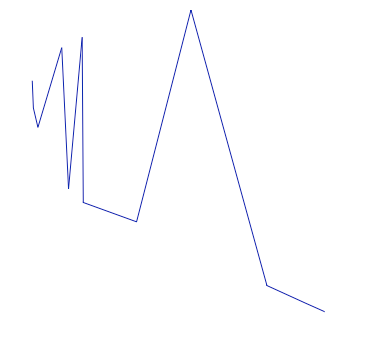
this line is supper jagged, jumping up and down on the y axis as it move from x= 47 to x= 48
pts_sf %>% group_by(id) %>% summarize(m = mean(attr_data)) %>% st_cast("LINESTRING") %>% plot()
I want to generate many such line and create a sf data.frame where I have 1 row for each line and plot them in a different color in leaflet.
I am not sure how to that with the first line, because I am not sure how to combine sfg objects.
I can't do it with the second option, because the order of the points in the line is broken.
Any tips for a newbie? :)
thanks!
 SimonCoulombe
on 6 Nov 2017
SimonCoulombe
on 6 Nov 2017
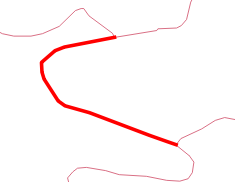
pts_sf %>% group_by(id) %>% summarize(m = mean(attr_data),do_union=FALSE) %>% st_cast("LINESTRING") %>% plot()
The default for summarize is to call st_union on points, which rearranges, just like
pts_sf %>% group_by(id) %>% st_union() %>% st_cast("LINESTRING") %>% plot()
does
edzer
on 6 Nov 2017
Will this (something like this) works [one fashion] for create a geometrycollection as well, keeping points where there is one element only for a ID group?
I'm reading hundreds of millions of data from ornithological radar, tippically with one hexa ID for points (single id) that are replicated when a track is identified.
It would be nice to cast them all in a single process for further analysis.
I found this #110 but the way to go may be here, nevertheless no combination of geometries seems to be in use.
 pecard
on 19 Dec 2017
pecard
on 19 Dec 2017
I just spent a good deal of time trying to figure out why some code worked one way on one line and a different way on another line. Just leaving some notes here for future reference.
The one that worked looked like this:
The one that broke looked like this:
but when it came out of my function it looked like:
So node order wasn't being preserved when I was round tripping from sf to matrix back to sf using the method described here.
What @edzer pointed out above with summarise(do_union=FALSE) was the ticket. Here's some code that drives the point home.
roundtrip <- function(input) {

  sf::st_as_sf(input, coords = c("X", "Y"), crs = 4326) %>%
    dplyr::group_by(L1) %>%
    dplyr::summarise(do_union=FALSE) %>%
    sf::st_cast("LINESTRING") %>%
    sf::st_coordinates() %>%
    as.data.frame()

}

roundtrip_no_order <- function(input) {

  sf::st_as_sf(input, coords = c("X", "Y"), crs = 4326) %>%
    dplyr::group_by(L1) %>%
    dplyr::summarise(do_union=TRUE) %>%
    sf::st_cast("LINESTRING") %>%
    sf::st_coordinates() %>%
    as.data.frame()

}

input <- data.frame(X = c(-76.8776437244438, -76.8804731911061, -76.8810037244386,
                          -76.8817699244375, -76.8817405244375, -76.8816223911043,
                          -76.8808265244389, -76.8804431911061, -76.8790579244417,
                          -76.8756683244469, -76.8746957244484, -76.8741651911159),
                    Y = c(39.3640528722325, 39.3635036055667, 39.3632976055671,
                          39.3626338722348, 39.3620848055689, 39.3616958722362,
                          39.3604604055714, 39.3601858722385, 39.3597970722392,
                          39.3585160055745, 39.3581728055751, 39.3579898055752),
                    L1 = c(1, 1, 1, 1, 1, 1, 1, 1, 1, 1, 1, 1))

cbind(input, roundtrip(input))

cbind(input, roundtrip_no_order(input))
And the output:
cbind(input, roundtrip(input))
           X        Y L1         X        Y L1
1  -76.87764 39.36405  1 -76.87764 39.36405  1
2  -76.88047 39.36350  1 -76.88047 39.36350  1
3  -76.88100 39.36330  1 -76.88100 39.36330  1
4  -76.88177 39.36263  1 -76.88177 39.36263  1
5  -76.88174 39.36208  1 -76.88174 39.36208  1
6  -76.88162 39.36170  1 -76.88162 39.36170  1
7  -76.88083 39.36046  1 -76.88083 39.36046  1
8  -76.88044 39.36019  1 -76.88044 39.36019  1
9  -76.87906 39.35980  1 -76.87906 39.35980  1
10 -76.87567 39.35852  1 -76.87567 39.35852  1
11 -76.87470 39.35817  1 -76.87470 39.35817  1
12 -76.87417 39.35799  1 -76.87417 39.35799  1

cbind(input, roundtrip_no_order(input))
           X        Y L1         X        Y L1
1  -76.87764 39.36405  1 -76.88177 39.36263  1
2  -76.88047 39.36350  1 -76.88174 39.36208  1
3  -76.88100 39.36330  1 -76.88162 39.36170  1
4  -76.88177 39.36263  1 -76.88100 39.36330  1
5  -76.88174 39.36208  1 -76.88083 39.36046  1
6  -76.88162 39.36170  1 -76.88047 39.36350  1
7  -76.88083 39.36046  1 -76.88044 39.36019  1
8  -76.88044 39.36019  1 -76.87906 39.35980  1
9  -76.87906 39.35980  1 -76.87764 39.36405  1
10 -76.87567 39.35852  1 -76.87567 39.35852  1
11 -76.87470 39.35817  1 -76.87470 39.35817  1
12 -76.87417 39.35799  1 -76.87417 39.35799  1
 dblodgett-usgs
on 3 Jul 2018
dblodgett-usgs
on 3 Jul 2018
https://gis.stackexchange.com/a/270814/112713
x1=st_as_sfc("POINT(47.810368 13.941994)")
x2=st_as_sfc("POINT(47.810358 13.941994)")
c(x1, x2) %>% st_combine() %>% st_cast("LINESTRING")
Works with all group-by/mutate/etc stuff. With lead/lag you'll have to filter out first/last points.
 Demetrio92
on 3 May 2019
Demetrio92
on 3 May 2019
Related issues
 pssguy
·
27Comments
edzer
·
30Comments
pssguy
·
27Comments
edzer
·
30Comments
 mkschneider
·
28Comments
edzer
·
49Comments
mkschneider
·
28Comments
edzer
·
49Comments
 rsbivand
·
24Comments
rsbivand
·
24Comments
Most helpful comment
The default for
summarizeis to callst_unionon points, which rearranges, just likedoes