Seurat: No legend in VlnPlot() split.by
Seurat rookie here. I am using Seurat 3.1.2 and I want to use the argument "split.by" in the VlnPlot() function to visualize QC metrics for samples which are or are not fluorescent.
My code is
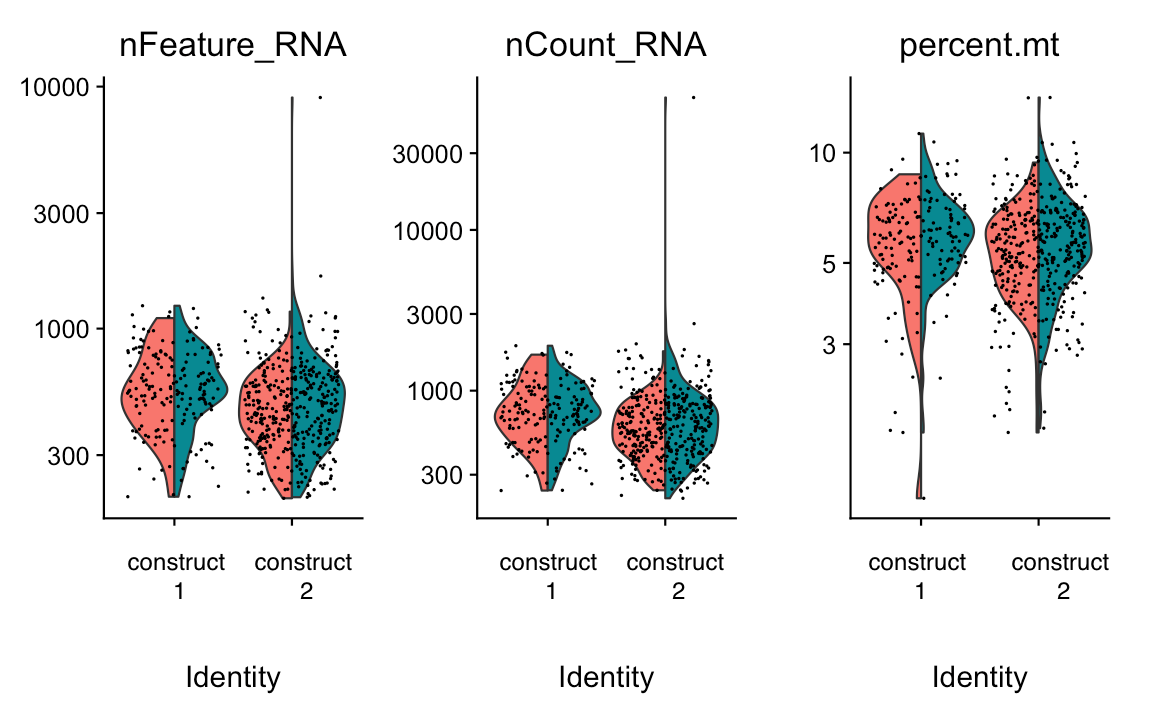
VlnPlot(object,
             features = c("nFeature_RNA",
                                   "nCount_RNA",
                                   "percent.mt"),
                      ncol = 3,
                      log = TRUE,
                      pt = 0.1,
                      split.by = "fluorescence",
                      group.by = "construct")
and gives this as output
Questions
- How do I get a legend to show me which samples (fluorescent or not) are which color (red or blue) color in the split violin plots?
I tried the code below, which gives me the graph above without a legend:
plot_runid <- VlnPlot(EF1a_object,
                      features = c("nFeature_RNA",
                                   "nCount_RNA",
                                   "percent.mt"),
                      ncol = 3,
                      log = TRUE,
                      pt = 0.1,
                      split.by = "fluorescence",
                      group.by = "construct") + theme(legend.position = 'right')
- How do I plot the median? I tried the code below but the graph looks identical to above.
VlnPlot(object,
             features = c("nFeature_RNA",
                                   "nCount_RNA",
                                   "percent.mt"),
                      ncol = 3,
                      log = TRUE,
                      pt = 0.1,
                      split.by = "fluorescence",
                      group.by = "construct") + stat_summary(fun.y = median, fun.ymin = median, fun.ymax = median, geom = "crossbar", width = 0.5)
Many thanks!
 corina444
All 2 comments
Hi,
Not member of the Dev team but hopefully this can be helpful (and is correct). I believe that both of the issues that you are having are related to the fact that when you provide multiple features to VlnPlot it is actually using CombinePlots() under the hood and theming doesn't work with combine plots in Seurat. You should be able to manually get around the issues by creating individual plots saved to the environment:
p1 <- VlnPlot(object, "nCount_RNA", pt.size = 0.1, split.by = "fluorescence", group.by = "construct")) + stat_summary(fun.y = median, fun.ymin = median, fun.ymax = median, geom = "crossbar", width = 0.5)
p2 <- VlnPlot(object, "nFeature_RNA", pt.size = 0.1, split.by = "fluorescence", group.by = "construct")) + stat_summary(fun.y = median, fun.ymin = median, fun.ymax = median, geom = "crossbar", width = 0.5)
Then combine with cowplot package
plot_grid(p1, p2)
Hope that helps and solves the issue. Also Dev team or others please correct me if I'm wrong.
Best,
Sam
 samuel-marsh
on 11 Feb 2020
samuel-marsh
on 11 Feb 2020
Hi Sam,
I tested it, and it works! I get the legend and the median.
Many thanks, it was torturing me the whole day!
Best,
Corina
corina444
on 11 Feb 2020
Related issues
 sarahwajid
·
3Comments
sarahwajid
·
3Comments
 GHAStVHenry
·
3Comments
GHAStVHenry
·
3Comments
 Biogitte
·
3Comments
Biogitte
·
3Comments
 rajasreemenon
·
3Comments
rajasreemenon
·
3Comments
 akhst7
·
3Comments
akhst7
·
3Comments
Most helpful comment
Hi,
Not member of the Dev team but hopefully this can be helpful (and is correct). I believe that both of the issues that you are having are related to the fact that when you provide multiple features to
VlnPlotit is actually usingCombinePlots()under the hood and theming doesn't work with combine plots in Seurat. You should be able to manually get around the issues by creating individual plots saved to the environment:p1 <- VlnPlot(object, "nCount_RNA", pt.size = 0.1, split.by = "fluorescence", group.by = "construct")) + stat_summary(fun.y = median, fun.ymin = median, fun.ymax = median, geom = "crossbar", width = 0.5)p2 <- VlnPlot(object, "nFeature_RNA", pt.size = 0.1, split.by = "fluorescence", group.by = "construct")) + stat_summary(fun.y = median, fun.ymin = median, fun.ymax = median, geom = "crossbar", width = 0.5)Then combine with cowplot package
plot_grid(p1, p2)Hope that helps and solves the issue. Also Dev team or others please correct me if I'm wrong.
Best,
Sam