Seurat: The min expression levevl in a VlnPlot is not zero, but negative value
When type in
VlnPlot(object = pbmc_small, features = 'PC_1', slot = "counts")
you can see what happen. It does bother me. Needding your help...
 xds123
All 4 comments
Hi,
This is a bit of a misnomer in the plot: you're plotting the embedding values for PC1, not expression of a feature. These values are allowed to be negative (look at a DimPlot with reduciton = 'pca') so it's no concern that the violin plot show negative values. We've made some changes to VlnPlot (and RidgePlot) so that the axis labels more accurately describe what they're showing. These changes are available in the development version of Seurat. To install the development version of Seurat, please see the instructions here.
 mojaveazure
on 14 May 2019
mojaveazure
on 14 May 2019
Hello,
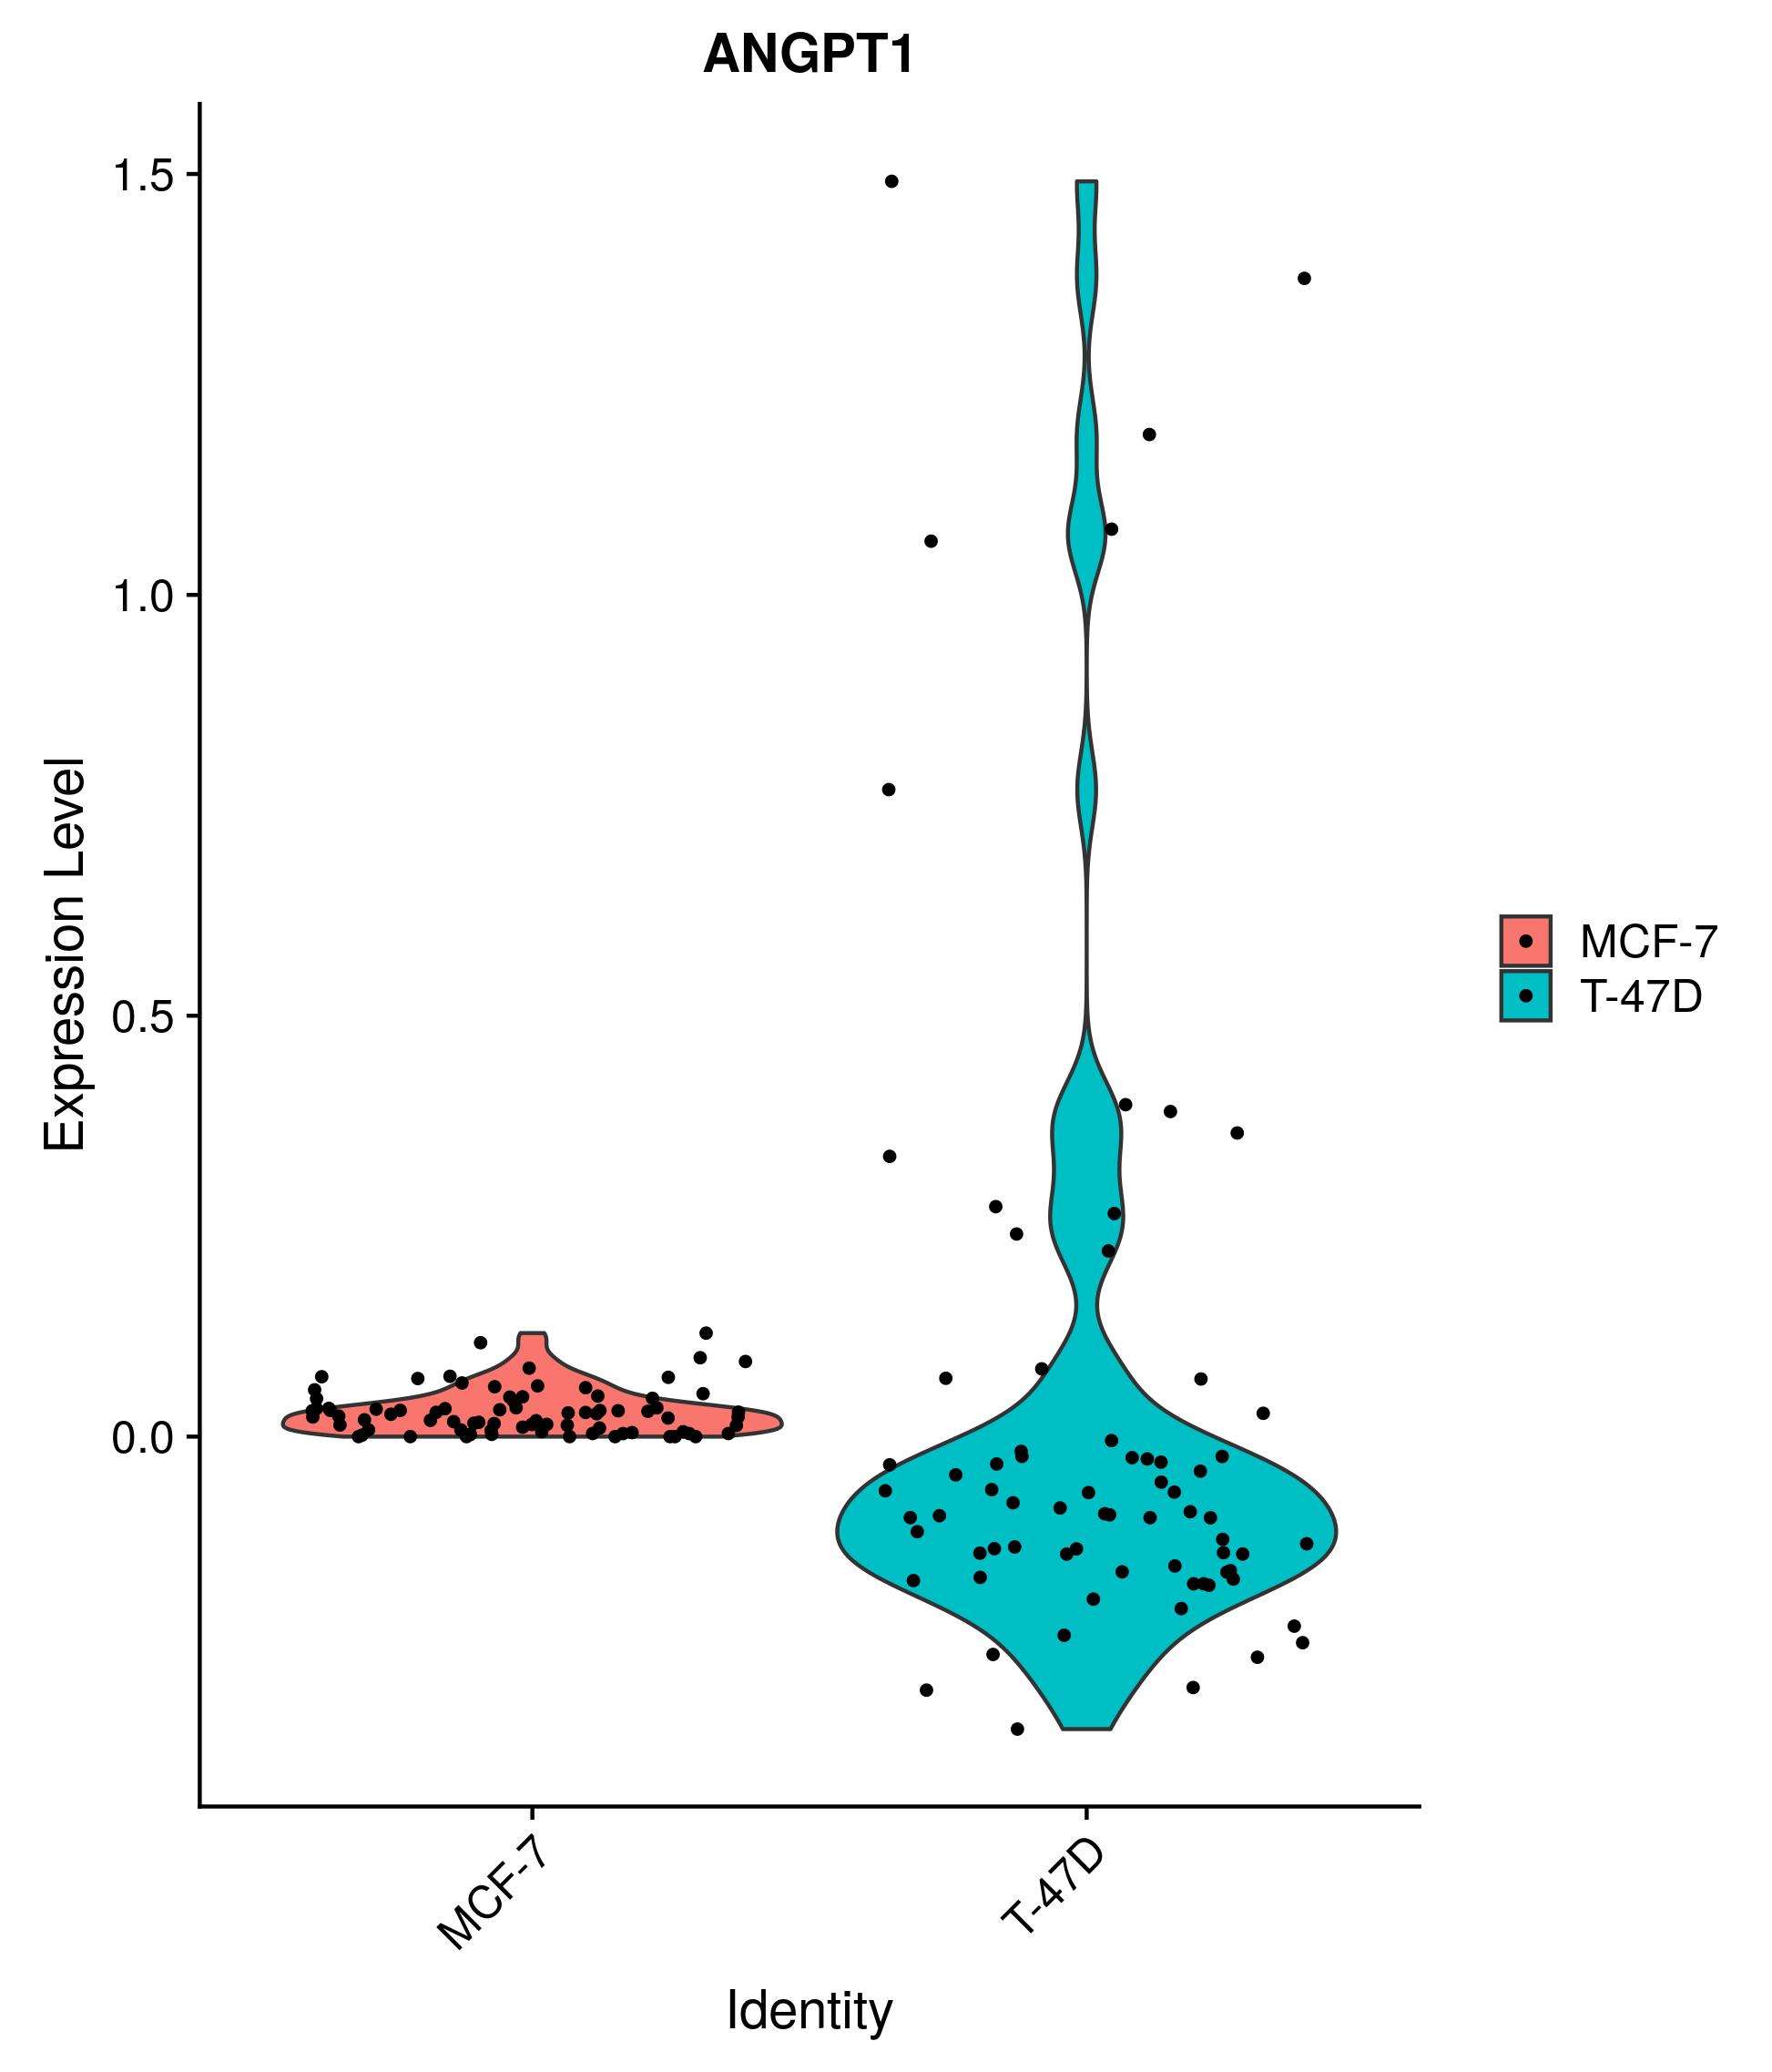
I have a related question. I am plotting gene expression levels using VlnPlot but with some of them I am getting negative values. The data has been normalised and scaled but I don't remember ever specifying any controls - so if these values are log2 fold change, I'm not sure what they are relative to. Could you explain why I sometimes get negative expression levels?
The code I am using is here. To execute it, change line 8 of global_variables.R to the location where you downloaded and then execute explore.R. This should pickup the Seurat object from the RDS file in SavedObjects and plot a bunch of VlnPlot's.
Thanks
Ciaran
 CiaranWelsh
on 16 Jul 2019
CiaranWelsh
on 16 Jul 2019
yeah, I have solved this problem by asigning the paramater of assay. Just look at this code: VlnPlot(..., assay = "RNA"), it may help you!
xds123
on 16 Jul 2019
Excellant, thank you.
CiaranWelsh
on 16 Jul 2019
Related issues
 kysbbubbu
·
3Comments
kysbbubbu
·
3Comments
 fly4all
·
3Comments
fly4all
·
3Comments
 kathirij
·
3Comments
kathirij
·
3Comments
 milanmlft
·
3Comments
milanmlft
·
3Comments
 mvalenzuelav
·
3Comments
mvalenzuelav
·
3Comments
Most helpful comment
yeah, I have solved this problem by asigning the paramater of assay. Just look at this code: VlnPlot(..., assay = "RNA"), it may help you!