Seurat: FindMarkers on Integrated Data: Seurat v3
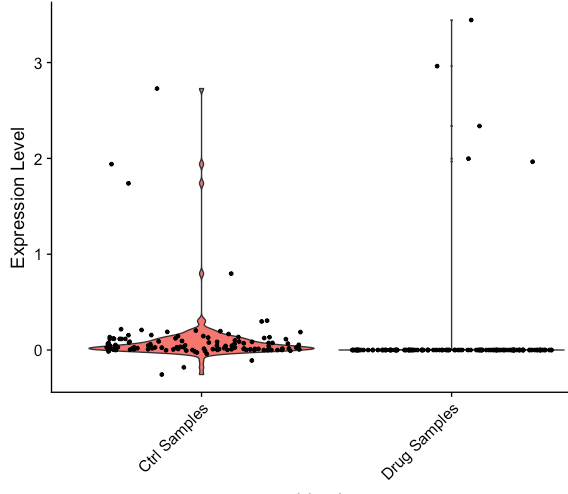
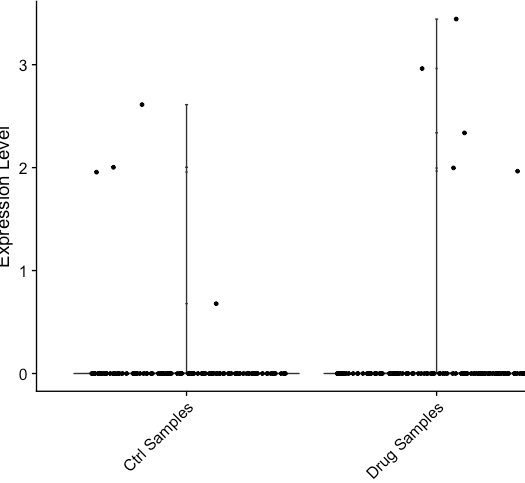
Genes that have zero expression in RNA assay can get slightly positive/negative values in the integrated data (see plots below). This affects the calculation of pct.1 and pct.2 . It inflated pct of the query dataset and can affect differential expression results. Is there a fix for it? Also, can the thresh.min be made a user defined property? Currently it is set to 0.
 silpasuthram
All 2 comments
When comparing data across conditions (for example, ctrl v. drug), you should not run FindMarkers on the integrated data, but on the original dataset (assay = "RNA"). This is because the integration will aim to remove differences across samples so that shared populations align together.
This is why we treat sample comparison as a two-step process. First, we integrate datasets together to consistently identify common cell populations across datasets. Second, we perform DE on the original (unintegrated) data, to find gene expression differences for each population.
 satijalab
on 21 Feb 2019
satijalab
on 21 Feb 2019
Thanks.
silpasuthram
on 21 Feb 2019
Related issues
 camilliano
·
3Comments
camilliano
·
3Comments
 tmccra2
·
3Comments
tmccra2
·
3Comments
 sarahwajid
·
3Comments
sarahwajid
·
3Comments
 mvalenzuelav
·
3Comments
mvalenzuelav
·
3Comments
 kysbbubbu
·
3Comments
kysbbubbu
·
3Comments
Most helpful comment
When comparing data across conditions (for example, ctrl v. drug), you should not run FindMarkers on the integrated data, but on the original dataset (assay = "RNA"). This is because the integration will aim to remove differences across samples so that shared populations align together.
This is why we treat sample comparison as a two-step process. First, we integrate datasets together to consistently identify common cell populations across datasets. Second, we perform DE on the original (unintegrated) data, to find gene expression differences for each population.