Seurat: v3.0 Problem removing Legend and Axes in FeaturePlot
Hello,
I am trying to remove the legends and axes from the FeaturePlot using v3.0
This is what I tried:
plot <- FeaturePlot(object = seuratobject, features = gene.list1) + NoLegend() + NoAxes()
print(plot)
But it still return a plot that includes legends and axes.
Thanks in advance for any help.
 SFF-singecell-user
All 5 comments
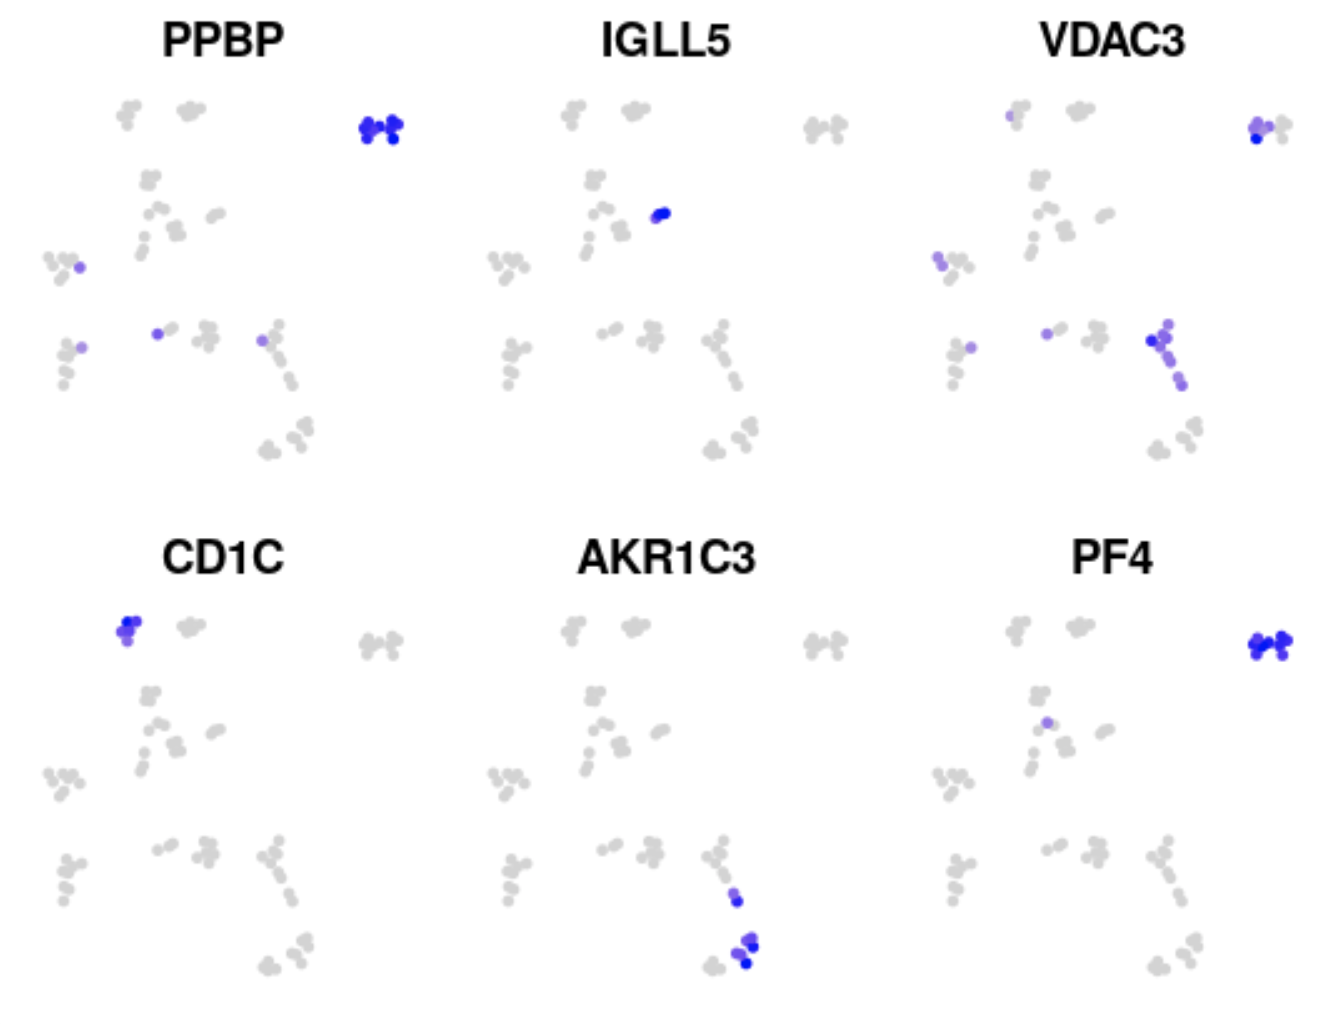
When you plot >1 feature, FeaturePlot combines the plots using cowplot::plot_grid. After the plots have been combined you can't change things like the legend and axes. Instead you can use the combine=FALSE argument, so that the plots are not combined, then change each individual plot, then combine the altered plots. Here is an example with the pbmc dataset:
library(Seurat)

p <- FeaturePlot(pbmc_small, head(VariableFeatures(pbmc_small)), combine = FALSE)

for(i in 1:length(p)) {
  p[[i]] <- p[[i]] + NoLegend() + NoAxes()
}

cowplot::plot_grid(plotlist = p)
 timoast
on 22 Jan 2019
timoast
on 22 Jan 2019
Thank you
SFF-singecell-user
on 22 Jan 2019
Would it be possible to bring back the no.axes and no.legend arguments to FeaturePlot() and DimPlot()? Both seem like a much more elegant way to solve this problem.
 diazdc
on 20 Mar 2019
diazdc
on 20 Mar 2019
I was able to use
FeaturePlot(object = object, features = features, combine = TRUE) & NoLegend() & NoAxes()
 ajpfahnl
on 11 Aug 2020
ajpfahnl
on 11 Aug 2020
Yes, we now use patchwork for combining plots which allows easier modification of the individual panels using the & operator
timoast
on 11 Aug 2020
Related issues
 fly4all
·
3Comments
fly4all
·
3Comments
 GHAStVHenry
·
3Comments
GHAStVHenry
·
3Comments
 RuiyangLiu94
·
3Comments
RuiyangLiu94
·
3Comments
 farhanma
·
3Comments
farhanma
·
3Comments
 htc502
·
3Comments
htc502
·
3Comments
Most helpful comment
Would it be possible to bring back the no.axes and no.legend arguments to FeaturePlot() and DimPlot()? Both seem like a much more elegant way to solve this problem.