Seurat: How to add median lines to VlnPlot?
Hi,
I am trying to add median lines to VlnPlot, like this:
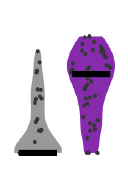
I know geom_violin(draw_quantiles = 0.5) can achieve this when using ggplot function, but here I think I may have to modify the ggplot object that VlnPlot created, which is something I am not familiar with. Is there anyway to do this?
Thank you
 arnssino
All 5 comments
This answer on StackOverflow has some suggestions for how to do it for violin plots in general https://stackoverflow.com/questions/17319487/median-and-quartile-on-violin-plots-in-ggplot2. I think a variation on the first answer is probably what you are looking for. You will need to set do.return = TRUE to be able to modify the plot.
median.stat <- function(x){
out <- quantile(x, probs = c(0.5))
names(out) <- c("ymed")
return(out)
}
VlnPlot(object = pbmc_small, features.plot = 'PC1', do.return = TRUE) +
stat_summary(fun.y = median.stat, geom='point', size = 10, colour = "blue")

 lazappi
on 10 Sep 2018
lazappi
on 10 Sep 2018
Actually, if you just want the median (without other quartiles) the regular median function will work (so will mean, min, max etc.).
VlnPlot(object = pbmc_small, features.plot = 'PC1', do.return = TRUE) +
stat_summary(fun.y = median, geom='point', size = 10, colour = "blue")
Thank you very much @lazappi
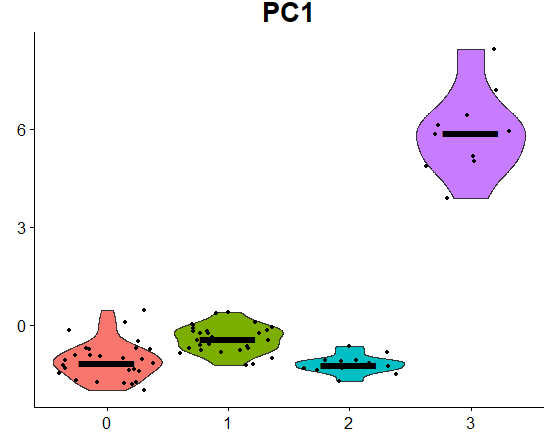
I made a little adjustment to make the median markers look like "lines" so it looks more like what I expected.
VlnPlot(object = pbmc_small, features.plot = 'PC1', do.return = TRUE) +
stat_summary(fun.y = median, geom='point', size = 25, colour = "black", shape = 95)
arnssino
on 10 Sep 2018
Thanks! This is very useful
 satijalab
on 14 Sep 2018
satijalab
on 14 Sep 2018
Hi,
I'm using Seurat v3, and got this error when trying the above code to make median lines on Vlnplot:
median.stat <- function(ILC2.tumor){
out <- quantile(ILC2.tumor, probs = c(0.5))
names(out) <- c("ymed")
return(out)
}
VlnPlot(ILC2.tumor, c("Il4", "Il5", "Il13"), group.by = "orig.ident", pt.size = 0, do.return = TRUE) +
stat_summary(fun.y = median.stat, geom='point', size = 25, colour = "black", shape = 95)
Warning messages:
1: In as_grob.default(plot) :
Cannot convert object of class logical into a grob.
2: Graphs cannot be vertically aligned unless the axis parameter is set. Placing graphs unaligned.
3: Graphs cannot be horizontally aligned unless the axis parameter is set. Placing graphs unaligned.
I'm new to coding so I've been following the guided tutorials on Seurat, so apologies if this question is naive! How can I fix this error?
Thank you!
 joanimal
on 17 Aug 2019
joanimal
on 17 Aug 2019
Related issues
 whitleyo
·
3Comments
whitleyo
·
3Comments
 milanmlft
·
3Comments
milanmlft
·
3Comments
 htc502
·
3Comments
htc502
·
3Comments
 mvalenzuelav
·
3Comments
mvalenzuelav
·
3Comments
 rajasreemenon
·
3Comments
rajasreemenon
·
3Comments
Most helpful comment
Thank you very much @lazappi
I made a little adjustment to make the median markers look like "lines" so it looks more like what I expected.