Service-fabric: 100% CPU spike on all cluster nodes
We have for a time now been facing issues where all nodes in our production cluster suddenly spikes to 100% and stay that way for a long time (10min-90min) before slowly settling down to a normal level again (10-15% CPU). We haven't found a cure for this condition other than just waiting for whatever condition that is causing it to disappear and the CPU settling back down. Obviously our response time goes through the roof in this period which is pretty critical for our service.

Attempting to understand the root cause of this has not been successful yet (we have open tickets with MS support that is not resulting in any feedback) but it seems to be triggered on changes to a node in the cluster (changes to services does not trigger the spikes). We have found a few ways to reproduce this:
- In Task Manager on a single node, take a process dump from a service process (which effectively freezes the process for some time). This causes all nodes in the cluster to spike to 100% CPU for minutes before slowly settling down again
- In Service Explorer, on a single node, click "Deactivate (remove data)" which also causes all nodes to spike to 100% CPU for a long time. Clicking "Deactivate (pause)" does not cause any spikes
- Adding a new scaleset to the cluster also causes all nodes (both new nodes and the existing nodes) to spike to 100% CPU
- Azure maintenance events that cause SF to disable nodes also cause the behavior
Other observations on this behavior:
- The cluster is a 6 node cluster running v. 6.3.187.9494 of ServiceFabric on Win2012 machines. We are using RemotingV1 between the services.
- The initial incident occurred as part of a windows update, when nodes were disabled. We have been using the PatchOrchestration service for a long time but have now disabled it to avoid it triggering node changes and the spikes again
- The initial incident also occurred at a time when we had not updated our deployed applications in 14 days and had not performed any actions to adjust the services or nodes so it does not feel like we deployed something faulty but rather that something else caused the behavior
- The specific processes consuming the CPU on the nodes are the Fabric.exe, our frontend webservice.exe receiving all incoming requests and our main accountservice.exe application that coordinates most request to appropriate data. They each take around 20-30% CPU and leave a little room for the remaining service to fill up
- We can deploy new versions of our applications without any significant CPU spikes
- We cannot reproduce this on our other environments
- We do not have disk space issues, we have plenty of storage overhead on all drives as well as memory overhead on all nodes as well
- We receive a large spike of SF ETW events (see below) but we do not see any exceptions bubble into our own code, calls just seem to take a very long time to complete.
We capture SF ETW warning and error events to our logging infrastructure and when the spikes occur, we receive 500K+events per minute. Here is a sample of some of the events that look problematic to us:
"2018-12-04T09:33:43.9452465Z", "level": "Warning", "message": "Exception encountered while reading ETL file. Exception information: System.ComponentModel.Win32Exception (0x80004005): The handle is invalid\r\n at Tools.EtlReader.TraceFileEventReader.ReadEvents(DateTime startTime, DateTime endTime)\r\n at System.Fabric.Dca.Utility.PerformWithRetries[T](Action1 worker, T context, RetriableOperationExceptionHandler exceptionHandler, Int32 initialRetryIntervalMs, Int32 maxRetryCount, Int32 maxRetryIntervalMs). ", "nodeName": "_livevm_4"
"2018-12-04T09:33:43.945249Z", "level": "Warning", "message": "Read from ETL file will be retried if retry limit has not been reached. ", "nodeName": "_livevm_4"
"2018-12-04T09:34:13.4138005Z", "level": "Warning", "message": "Using default replicator settings, unable to load replicator settings config section named 'ReplicatorConfig' from config package named 'Config'. ", "nodeName": "_livevm_4"
"2018-12-04T09:34:13.6845916Z", "level": "Warning", "message": "InternalReadAsync: background read task exception 35665082 1048576 System.Collections.Generic.KeyNotFoundException: Element not found ---> System.Runtime.InteropServices.COMException: Element not found. (Exception from HRESULT: 0x80070490)", "nodeName": "_livevm_4"
"2018-12-04T09:34:29.2539217Z", "level": "Warning", "message": "Reason: InsufficientLogs. Target Replica: 131883896791946948. ", "nodeName": "_livevm_4"
"2018-12-04T09:34:34.0531267Z", "level": "Warning", "message": "Flushed Bytes: 1,747,643 Records: 6,913 LatencySensitiveRecords: 2,153 FlushTime(ms): 5,827 SerializationTime(ms): 32 Avg. Byte/sec: 67,823.000 Avg. Latency Milliseconds: 1,059.900. WritePosition: 648,551 ", "nodeName": "_livevm_4"
"2018-12-04T09:34:42.4871206Z", "level": "Warning", "message": "10.0.0.8:55387-10.0.0.7:61144: dropping message 0330d0d1-b084-4d3c-baac-7eec0099a7cb:53,522,463, Actor = Empty, Action = 'CopyOperation' ", "nodeName": "_livevm_4"
"2018-12-04T09:34:42.4871206Z", "level": "Warning", "message": "aborted Txn: 131,878,044,364, 769, 424 Count: 1", "nodeName": "_livevm_4"
We do not understand the implications of these events but they seem to indicate an overall problem in the system. Can someone assist us with deciphering these messages?
Our current theory evolves around the service resolution code in SF that somehow fails to detect/react to the change in topology and rather than performing a controlled re-resolution/retry/stepback does an aggressive retry that churns CPU on all nodes (since all nodes need to resolve the changed node)
We'd love to get some insight into how we can troubleshoot a root cause, as we are currently developing a nervous condition dreading the next time our CPUs spike.
 enemaerke
All 19 comments
Sounds somewhat similar to Stateful Service high and increasing CPU usage
 MedAnd
on 5 Dec 2018
MedAnd
on 5 Dec 2018
Thanks for replying. I did read that issue, but I think we are seeing something else since 1) we are getting CPU spikes both in the Fabric.exe and our stateless service and not just around a statefull service and 2) we are seeing the spike on all nodes in the cluster simultanously. I think we are looking for something else.
enemaerke
on 5 Dec 2018
Hi, I had also some issue with the CPU going to 100%, maybe it is similar to your issue:
https://github.com/Azure/service-fabric-issues/issues/1221
Are you sure you only use RemotingV1?
 ThiemeNL
on 7 Dec 2018
ThiemeNL
on 7 Dec 2018
@ThiemeNL Thanks for replying. Yes, we are only using RemotingV1. We want to move to V2 to get any benefits from it, but right now all transports are RemotingV1
enemaerke
on 10 Dec 2018
@enemaerke
Which sdk version you are using?
 suchiagicha
on 12 Dec 2018
suchiagicha
on 12 Dec 2018
@suchiagicha We are on 3.2.187 but we actually just got info back from the SF ProductGroup (we had an open support ticket on this) that we should roll back to 3.1 because 3.2 introduced an aggressive retry in resolving partitions in some cases and that seems to have been triggering when our partitions rebalanced for whatever reason.
enemaerke
on 13 Dec 2018
@enemaerke
We have made the release of the nuget package which has the fix . Please make sure you update all the nuget package of ServiceFabric sdk for that service.
https://github.com/Microsoft/service-fabric-services-and-actors-dotnet/issues/166
suchiagicha
on 19 Dec 2018
And @enemaerke if you can let us know if this resolves your issue that'd be great.
 masnider
on 20 Dec 2018
masnider
on 20 Dec 2018
@masnider, we downgraded to 3.1 which resolved the CPU spikes for us. We have yet to roll up to new 3.2 that includes the fix, so we cannot verify that as of yet. Not entirely sure when we'll do that upgrade to be honest as we are a bit backlogged after fighting the CPU spikes for a few weeks
enemaerke
on 20 Dec 2018
I would like to add some details here might be related:
On my development environment(localhost), I generally play around with Hyper-V and have to manage networks. When I setup a network to share the host wireless card, it deactivate and reactivate the card to apply the changes(make the bridge).
I've noticed that the Fabric.exe and the FabricApplicationGateway.exe CPU spikes to a very high usage while the Network is being modified.
I haven't reported it as a bug because it is not a common scenario, but might be related to these CPU spikes we often see reported around here, maybe a network issue to these services are putting pressure in the communication logic causing the spikes.
The Runtime Version id _6.4.617.9590_, but I also noticed it happening on older versions.
 guibirow
on 6 Feb 2019
guibirow
on 6 Feb 2019
Facing same problem. Runtime version 6.4.617.9590 too.
So, what is recommended while awaiting fix?
 wirtoo
on 8 May 2019
wirtoo
on 8 May 2019
@guibirow @wirtoo
Are you seeing high cpu for fabricdnsservice also?
suchiagicha
on 9 May 2019
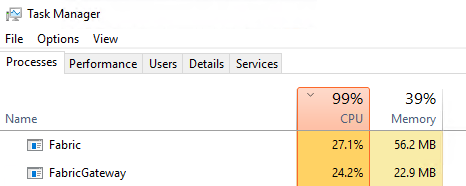
@suchiagicha I did a quick test disabling the network and could notice it does increase the CPU usage for Dns service, but not as high as other components.
I noticed Fabric.exe and FabricGateway.exe spike the cpu to values around 14-17% and FabbricDnsService.exe around 3%.
Look the below SS I took:

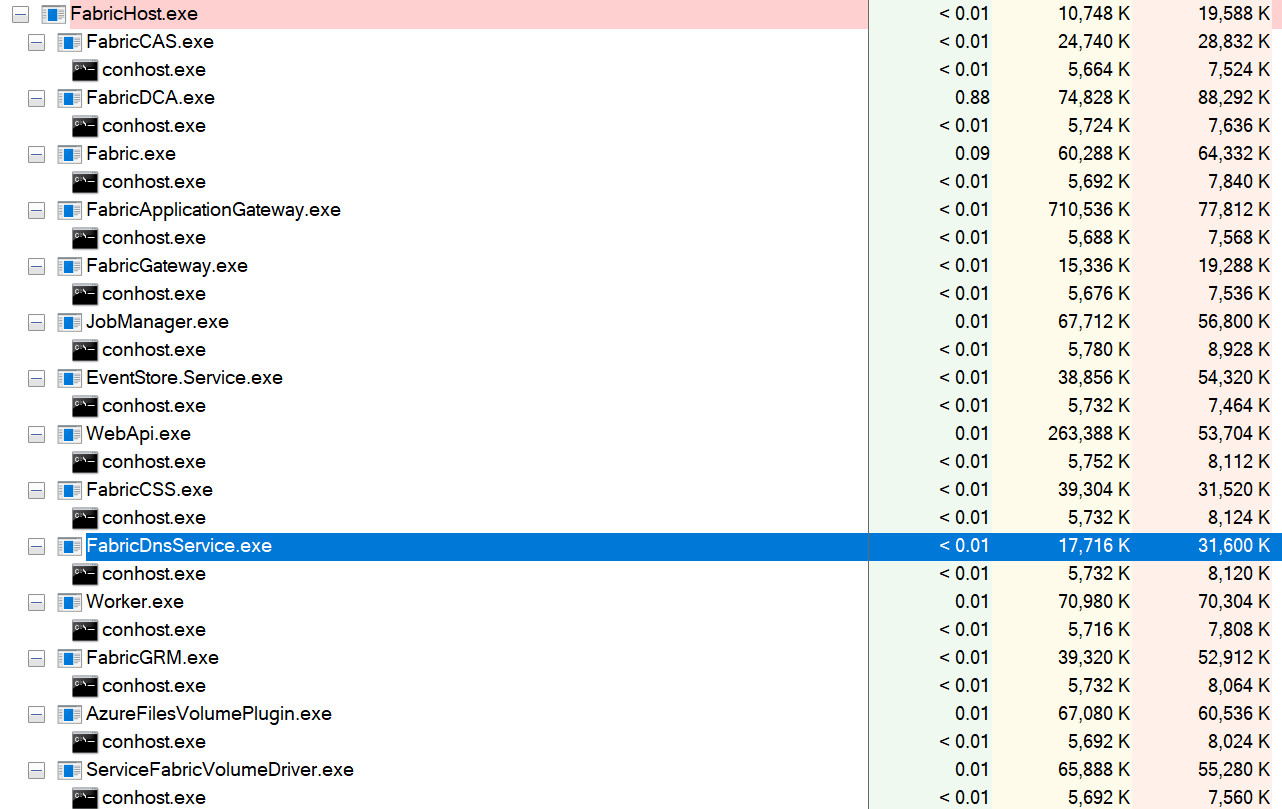
Note that there are no load in the cluster other than the the standby services JobManager and Worker.
I've noticed Worker also spike in usage, it supposed to make remoting calls(Every 10s) to JobManager to get work.
In a normal situation, the load should look like this:
guibirow
on 9 May 2019
@guibirow
This one can be fixed if you upgrade sdk to latest version.
I was asking you about this scenario.
"I've noticed that the Fabric.exe and the FabricApplicationGateway.exe CPU spikes to a very high usage while the Network is being modified.". Do you see FanricDnsService high cpu?
suchiagicha
on 9 May 2019
I haven't had time to test it, I will probably be able to check it only after May 29th.
guibirow
on 15 May 2019
@suchiagicha
@guibirow @wirtoo
Are you seeing high cpu for fabricdnsservice also?
No, only Fabric.exe and FabricGateway.exe
Upgrade haven't solved the problem, current version is 6.4.664.9590
Do you need any logs, system info etc.? Please, let me know.
wirtoo
on 18 Jun 2019
The same issue here. Also, there are a lot of "Info" level messages In ETL logs with "Microsoft-Service Fabric" Event Name.
 inebritov
on 19 Jul 2019
inebritov
on 19 Jul 2019
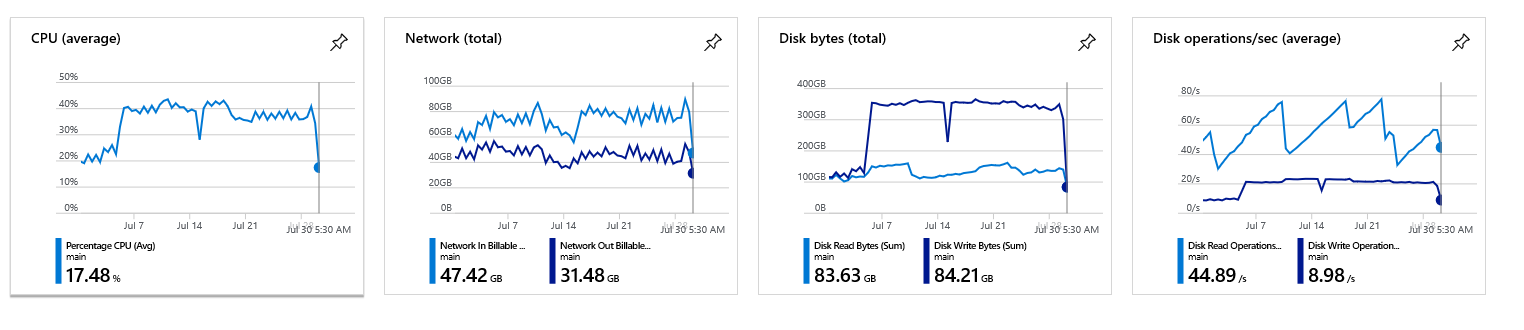
Upgrade cluster to 6.5.641.9590 version solved the problem in my case:
inebritov
on 30 Jul 2019
Facing with the same problem! FabricDnsService eats too much CPU even if I
shuted down cluster
 Sm1le291
on 2 Aug 2020
Sm1le291
on 2 Aug 2020
Related issues
 SergiiKliebanov
·
8Comments
SergiiKliebanov
·
8Comments
 spottedmahn
·
5Comments
spottedmahn
·
5Comments
 muradkhateeb78
·
3Comments
muradkhateeb78
·
3Comments
 FernandoNunes
·
7Comments
FernandoNunes
·
7Comments
 moberacker
·
6Comments
moberacker
·
6Comments