Hi, thanks for the great product. I've been running it now for two weeks and I've noticed an increase in memory usage from the icons service.
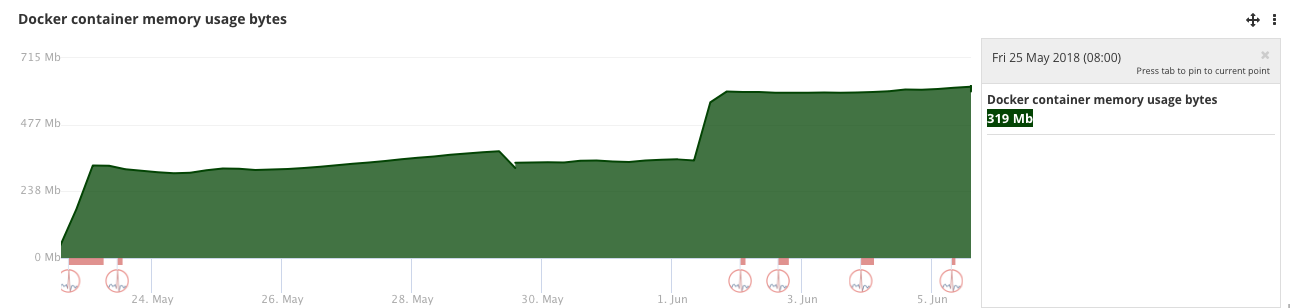
Is this normal? After a restart the memory usage drops again to 'normal' levels.
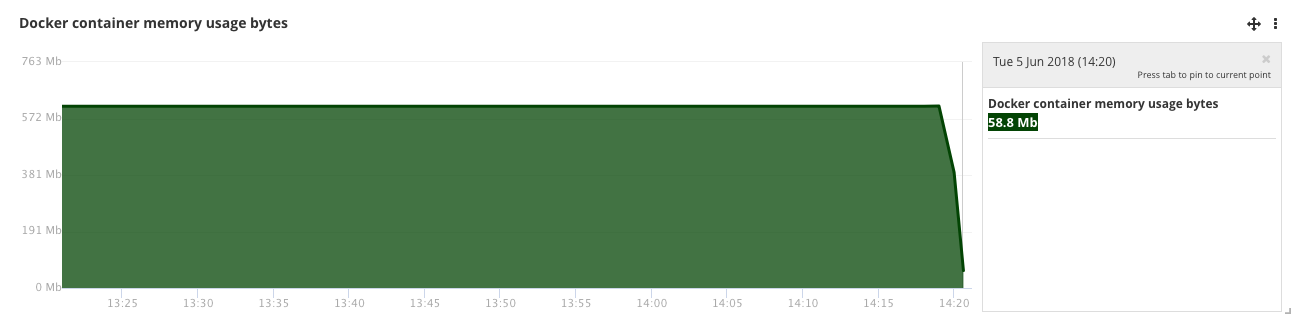
Let me know if I can provide any debug information.
 kidk
kidk
All 29 comments
Yes, it's expected as of now. Fetching icons is somewhat expensive to do. We cache them in memory at the moment, which will keep growing as more icons are fetched. There is an environment variable for specifying the max cache size which you can set in docker-compose.override.yml for the icons container if you'd like to scope it:
iconsSettings__cacheSizeLimit=<number of bytes>
ex for 1gb max cache size:
iconsSettings__cacheSizeLimit=1073741824
 kspearrin
on 5 Jun 2018
kspearrin
on 5 Jun 2018
Great, thanks for the quick reply. I will use the env var.
kidk
on 5 Jun 2018
@kidk What program is that you are using to monitor resources of containers?
kspearrin
on 5 Jun 2018
@kspearrin http://www.coscale.com
Full disclosure: I work for them ;)
kidk
on 5 Jun 2018
With around 600 items, icons service takes about 450MB in memory, which is quite important.
@kspearrin what's the behavior when the iconsSettings__cacheSizeLimit is reached ?
And what is the default limit ?
Thx 👍
 Mart124
on 11 Jun 2018
Mart124
on 11 Jun 2018
Default is no limit. We should probably add one to env file builder. It will start evicting least recently used from the cache when it hits limits.
kspearrin
on 12 Jun 2018
I put the following in bwdata/env/global.override.env (100 MB) :
iconsSettings__cacheSizeLimit=104857600
dotnet /app/Icons.dll process started at around 70 MB, and is now over 500 MB.
I also noticed many entries in nginx/access.log like the following :
"GET /icons/login.teamviewer.com/icon.png HTTP/1.1" 500 0
"GET /icons/live.com/icon.png HTTP/1.1" 500 0
And each time such 500 failing request is made, process grows by some KB, sometimes by some MB.
Mart124
on 12 Jun 2018
@Mart124 I am not able to reproduce the 500 errors on teamviewer.com or live.com
https://icons.bitwarden.com/login.teamviewer.com/icon.png
https://icons.bitwarden.com/live.com/icon.png
kspearrin
on 12 Jun 2018
The 500 error seems to be related to the issue I encounter with some icons in #268.
Even restarting all the app (all the containers), after having removed the iconsSettings__cacheSizeLimit rule, I get the same 500 errors on these specific icons.
Some stack-traces :
https://pastebin.com/raw/w5SVC0km
https://pastebin.com/raw/tDGRhbA3
Main error is System.ArgumentException: Only 'http' and 'https' schemes are allowed.
As if required location was wrongly computed without a valid sheme :
https://github.com/bitwarden/core/blob/v1.20.0/src/Icons/Services/IconFetchingService.cs#L279
Mart124
on 12 Jun 2018
The code takes the scheme from the previous followed request so it's not clear to me why it would be wrong here. The only way to figure this out would be to debug it. Do you have a site that reliably causes these 500 errors? I've tried login.teamviewer.com , which does do a 302 redirect with a location header, but it seems to work correctly in my tests.
kspearrin
on 12 Jun 2018
These fail every time (among several others) :
login.teamviewer.com
live.com
www.paypal.com
# curl -vk https://teamviewer.com
(...)
location: /en/
(...)
Do you follow locations when they do not have a sheme / when they are internal ?
Mart124
on 12 Jun 2018
It seem we are getting served different responses, likely because of geo IP detection:
$ curl -vk https://teamviewer.com
...
location: https://www.teamviewer.us/
...
It's suppose to follow relative path locations, but maybe there is a problem there. I need to figure out a test case that I can run to reproduce it for debugging
kspearrin
on 12 Jun 2018
I built a simple test domain with such a redirection, and of course managed to reproduce the issue.
But icons.bitwarden.net succeeded !
This may sound like the following : https://github.com/dotnet/corefx/issues/8941
Is icons.bitwarden.net perhaps running on Windows, while I perform my Icons tests on Linux ?
Mart124
on 13 Jun 2018
I'm looking to restrict the memory usage of bitwarden-icons. My server is small and this container ends up consuming too much memory until my server comes to a crawl. However, I can't seem to find any way to make cacheSizeLimit work.
I've tried adding iconsSettings__cacheSizeLimit to my global.override.env, but I noticed that's not actually loaded into the bitwarden-icons container. So then I created a docker-compose.override.yml with the following:
version: '3'

services:
  icons:
    environment:
      - iconsSettings__cacheSizeLimit=X
That gets it into the environment of the container, but the Icons program doesn't seem to honor it. I've tried all kinds of values for the size limit and the container always ends up growing until my server dies. Any ideas?
 bmatcuk
on 15 Jun 2018
bmatcuk
on 15 Jun 2018
@bmatcuk I'm still looking into other possible memory leaks that may be causing the problem seen here.
kspearrin
on 15 Jun 2018
I wonder if other users facing this memory issue also face the HTTP/500 errors.
As I noticed above, _each time such 500 failing request is made, process grows by some KB, sometimes by some MB._
I then wonder whether or not these 2 issues could be related, as browsing a vault could generate some tens of HTTP/500.
Mart124
on 18 Jun 2018
@Mart124 I just scrolled through my list and I can't say I get the same result. Memory usage has been stable for the last couple of days.
I did get a crash I think
/entrypoint.sh: line 61: 16 Illegal instruction (core dumped) gosu $USERNAME:$GROUPNAME dotnet /app/Icons.dll iconsSettings:bestIconBaseUrl=http://localhost:8080
Do you have some HTTP/500 errors in your nginx/access.log file ?
Let's assume you have :
"GET /icons/site.com/icon.png HTTP/1.1" 500 0
Then, using your favorite browser, or curl or whatever... go to this several times in a raw : <your_vault_base_url>/icons/site.com/icon.png
This while looking at the process size.
This is how I found HTTP/500 errors made the process to grow easily.
While an already cached icon does not reproduce this.
Mart124
on 18 Jun 2018
I do have some 500's but it seems they only happened once, cause the icon was cached correctly. I have this on most 500's.
kidk
on 19 Jun 2018
I made some changes to the icons container to try to remove any memory leaks. Can you try the beta tag and see if it has helped any?
Edit the compose file in ./bwdata/docker and change the icons container tag to beta. Then restart.
kspearrin
on 19 Jun 2018
Thank you @kspearrin for this beta version.
I'm however still able to reproduce the HTTP/500 errors which still make the process to grow constantly (15 HTTP/500 requests lead to about 10 more MB in memory).
Mart124
on 19 Jun 2018
@Mart124 I still havent been able to get a 500 to happen while debugging various website. Tried teamviewer.com, paypal.com, etc
kspearrin
on 19 Jun 2018
Did you see my note & question above ?
Perhaps we could put a strong hard-coded test redirection in place to simplify debugging ?
Mart124
on 19 Jun 2018
@Mart124 The issue you referenced seems to have been fixed over 2 years ago. I am only able to debug while on Windows with Visual Studio so I haven't been able to try on Linux.
kspearrin
on 19 Jun 2018
Yes I was just referencing this issue because it demonstrates that behaviors could be different depending on the host OS, which is perhaps what we could face here.
Mart124
on 19 Jun 2018
I pushed another beta update that now makes it impossible for the Uri scheme to be anything other than http or https. Can you try now?
kspearrin
on 19 Jun 2018
The beta image definitely improved memory usage on my server! I only have about a dozen passwords in my vault for testing. Whereas previously the icons container would shoot up to 250MB+ of memory when I loaded my vault, it's now hovering around 98MB, so that's a nice improvement =) I'll have to do some more testing when I get home, though.
I tried to help profile the process over the weekend, but I couldn't find any easy way to find the memory leak. I couldn't figure out how to make lldb/libsosplugin show me a summary of items in memory that were alive, for example. I could make it output a giant list of memory locations for live objects, but it would only ever print out a summary (with a list of object types) that included both live and dead objects. So it's hard to say what objects, if any, were preventing the garbage collector from cleaning up.
I also tried inserting an explicit garbage collection and disabling the memory cache altogether, but that didn't help =(
bmatcuk
on 20 Jun 2018
So, HTTP/500 errors are gone, and icons which failed before are now correctly retrieved 👍
Global memory usage is also (a consequence in my case ?) much lower, around 250 MB vs 450/500 MB with 1.20.0.
Mart124
on 20 Jun 2018
It seems that when the exceptions were being thrown the http request/responses were not properly disposing.
kspearrin
on 20 Jun 2018
Related issues
 yureiita
·
3Comments
yureiita
·
3Comments
 shartge
·
3Comments
shartge
·
3Comments
 Pulsar
·
6Comments
Pulsar
·
6Comments
 jasonkuehl
·
3Comments
jasonkuehl
·
3Comments
 mjlm
·
6Comments
mjlm
·
6Comments
Most helpful comment
@bmatcuk I'm still looking into other possible memory leaks that may be causing the problem seen here.