@volkanceylan @minhhungit
How we can add a chart in a grid? can you please put some light on how this can be achieved.
Regards,
Arvind
 reach2rv
All 7 comments
not sure what exactly what you mean about "chart in grid", does it like this sample ?
http://mleibman.github.io/SlickGrid/examples/example10-async-post-render.html
 minhhungit
on 29 Aug 2020
minhhungit
on 29 Aug 2020
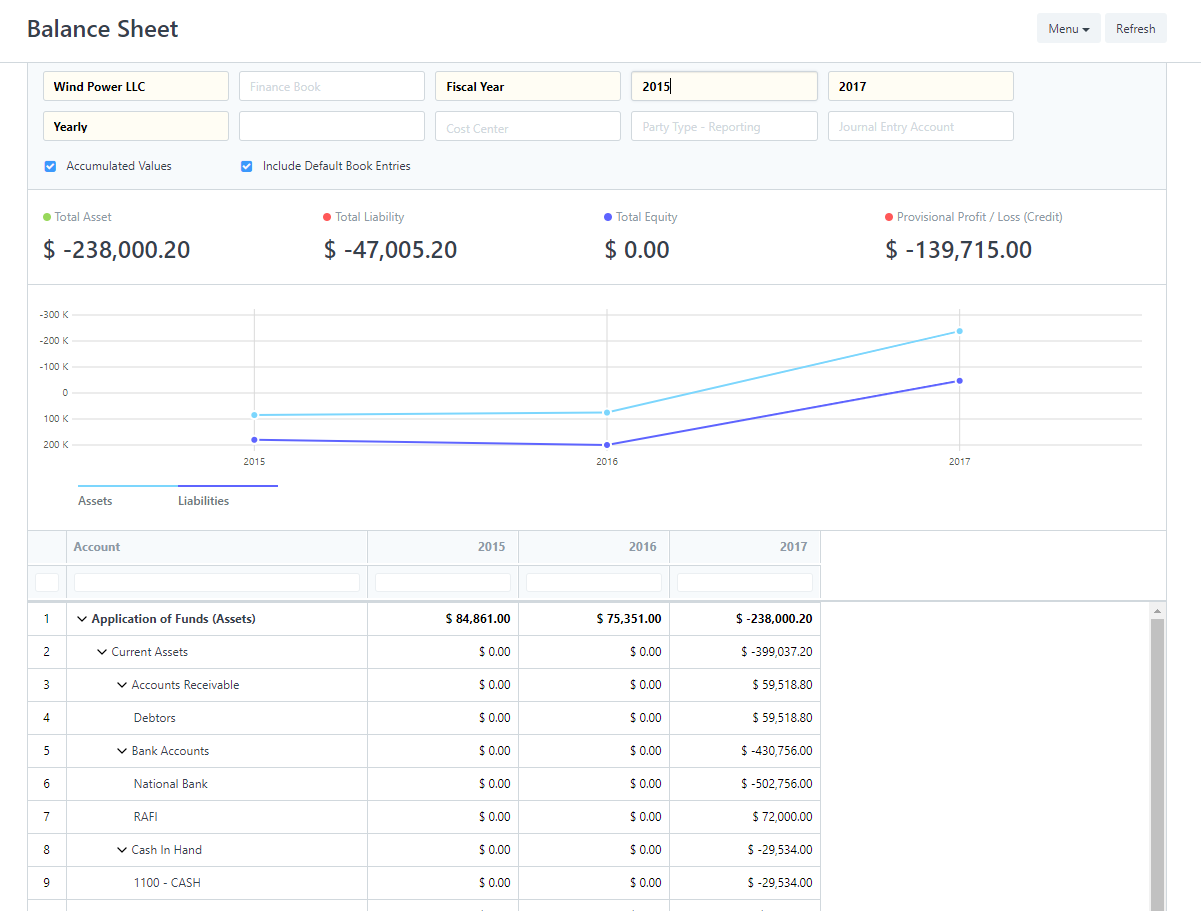
Not exactly.. there should chart above grid which will be dependent on data in grid.
I am looking to achieve something like attached image
reach2rv
on 29 Aug 2020
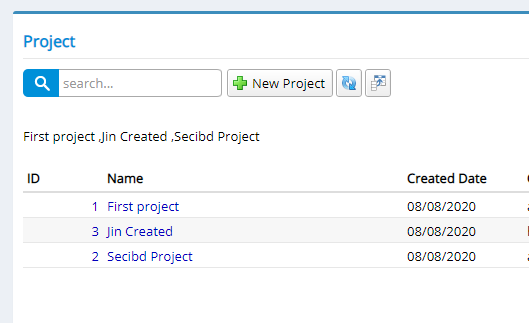
I can give you the idea:
- append a div tag before grid container
- get grid data using this.view.getItems
- create chart serenity panel template with parameter from grid's values
- inject chart panel into the div above
export class ChartPanelOptions {
items: ProjectRow[];
}
export class ChartPanel extends Serenity.TemplatedPanel<ChartPanelOptions> {
constructor(container: JQuery, opt: ChartPanelOptions) {
super(container, opt);
this.byId("chartContainer").text(`${this.options.items.map(x => `${x.Name} `)}`);
}
getTemplate() {
return `<div id="~_chartContainer"></div>`;
}
}
and GRID.ts
@Serenity.Decorators.registerClass()
export class ProjectGrid extends Serenity.EntityGrid<ProjectRow, any> {
protected getColumnsKey() { return 'Default.Project'; }
// ..
private chartContainer: JQuery;
private chartPanel: ChartPanel;
constructor(container: JQuery) {
super(container);
}
onViewProcessData(response: Serenity.ListResponse<ProjectRow>) {
if (!this.chartContainer) {
this.chartContainer = $("<div style='padding: 20px 0' />");
this.chartContainer.insertBefore(this.element.find(".grid-container"));
}
if (this.chartPanel) {
this.chartPanel.destroy();
}
this.chartPanel = new ChartPanel(this.chartContainer, { items: response.Entities });
return response;
}
// ...
minhhungit
on 29 Aug 2020
@minhhungit thank you for quick response. I will try and update. a small query rest of the chart details i.e type of chart, row, column, axis can be defined in ChartPanel constructor?
something like
this.areaChart = new Morris.Area({
element: this.idPrefix + 'Chart',
resize: true, parseTime: false,
data: response.Values,
xkey: 'Month',
ykeys: response.ShipperKeys, labels: response.ShipperLabels, hideHover: 'auto'
});
you can do anything you want, you just need to build your response.Values to chart data
here is full code what I tried
declare var Morris;

namespace DailyTimelog.Default {

    export class ChartPanelOptions {
        items: ProjectRow[];
    }

    export class ChartPanel extends Serenity.TemplatedPanel<ChartPanelOptions> {
        constructor(container: JQuery, opt: ChartPanelOptions) {
            super(container, opt);

            Morris.Bar({
                element: this.byId("chartContainer"),
                data: [
                    { y: '2006', a: 100, b: 90 },
                    { y: '2007', a: 75, b: 65 },
                    { y: '2008', a: 50, b: 40 },
                    { y: '2009', a: 75, b: 65 },
                    { y: '2010', a: 50, b: 40 },
                    { y: '2011', a: 75, b: 65 },
                    { y: '2012', a: 100, b: 90 }
                ],
                xkey: 'y',
                ykeys: ['a', 'b'],
                labels: ['Series A', 'Series B']
            });
        }

        getTemplate() {
            return `<div id="~_chartContainer"></div>`;
        }
    }

    @Serenity.Decorators.registerClass()
    export class ProjectGrid extends Serenity.EntityGrid<ProjectRow, any> {
        protected getColumnsKey() { return 'Default.Project'; }
        protected getDialogType() { return ProjectDialog; }
        protected getIdProperty() { return ProjectRow.idProperty; }
        protected getInsertPermission() { return ProjectRow.insertPermission; }
        protected getLocalTextPrefix() { return ProjectRow.localTextPrefix; }
        protected getService() { return ProjectService.baseUrl; }

        private chartContainer: JQuery;
        private chartPanel: ChartPanel;

        constructor(container: JQuery) {
            super(container);
        }

        onViewProcessData(response: Serenity.ListResponse<ProjectRow>) {

            if (!this.chartContainer) {
                this.chartContainer = $("<div style='padding: 20px 0' />");
                this.chartContainer.insertBefore(this.element.find(".grid-container"));
            }

            if (this.chartPanel) {
                this.chartPanel.destroy();
            }

            this.chartPanel = new ChartPanel(this.chartContainer, { items: response.Entities });

            return response;
        }
    }
}
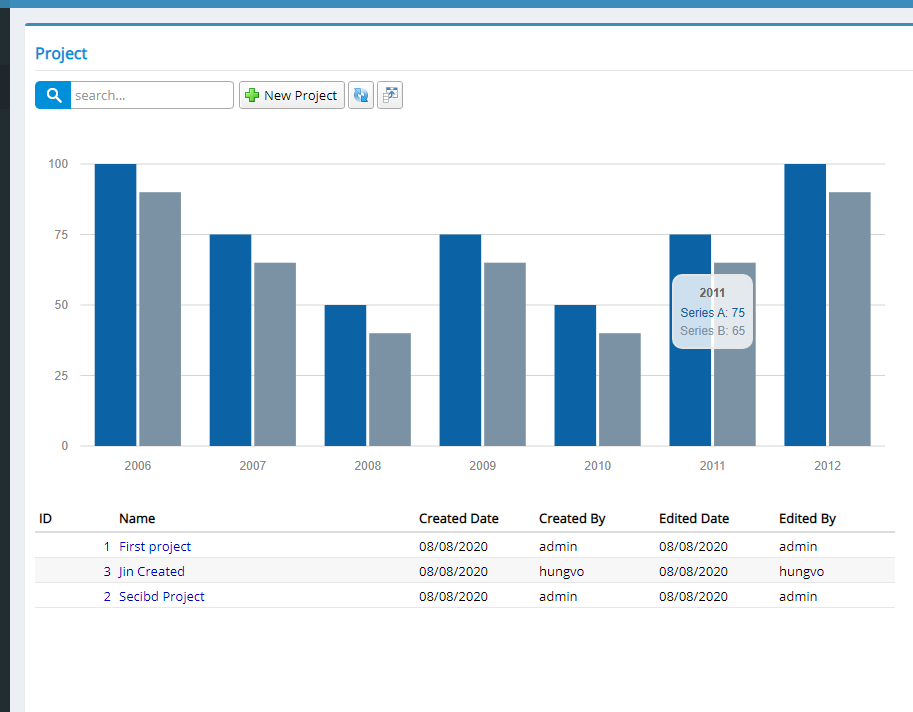
and result
minhhungit
on 30 Aug 2020
Thank you so much 🙏👍
reach2rv
on 30 Aug 2020
@minhhungit Thank you for sharing. I wonder what if I want the chart to be on the right grid? Thanks!
 huynhvanquy
on 25 Oct 2020
huynhvanquy
on 25 Oct 2020
Related issues
 Pinellus
·
3Comments
Pinellus
·
3Comments
 moostafaa
·
3Comments
moostafaa
·
3Comments
 gfo2007
·
3Comments
gfo2007
·
3Comments
 chintankukadiya18
·
3Comments
chintankukadiya18
·
3Comments
 newyearsoft
·
3Comments
newyearsoft
·
3Comments
Most helpful comment
you can do anything you want, you just need to build your
response.Valuesto chart datahere is full code what I tried
and result