Hello Volkan,
Please are there any tutorials on how to implement the dashboard with various data as well as charts? Where can I find that tutorial online?
 gfo2007
All 7 comments
You can see how works dashbord page in Serene example https://github.com/volkanceylan/Serene/blob/master/Serene/Serene.Web/Modules/Common/Dashboard/DashboardPage.cs
 Estrusco
on 1 Jun 2017
Estrusco
on 1 Jun 2017
That is quite basic. I want to be able to do some serious charts as dashboard and was thinking someone has someone tutorials that provides more depth on it.
gfo2007
on 2 Jun 2017
Hi, I did 2 different implementations of charts for the dashboard.
But before I continue a little disclaimer: I'm not a web developer. I know nothing of this tech. I'm just a copypaster (a good one, but just a copypaster). So these examples may be as wrong as the last reboot of fantastic four.
Anyway...
The first implementation is using typescript and the Morris chart. I build this example from the Chart In Dialog in Basic Samples (check the sample, is really useful).
Step 1: Change DashboardIndex.cshtml at the end add this code.
<script type="text/javascript">
    jQuery(function () {

        //This is if we use typescript to load the chart.
        // the info looks like hidden.
        YourSerenityAppName.Common.DashboardChart.initializeChart();
    });
</script>
Step 2: Create a ts file for the dashboard. I call it DashboardChart.ts (I'm really, really, really not sure about the naming convention... so... yeah.)
In this file I added this code (see that I'm using the revenue chart. This is because that chart was working fine, so whatever I do I will know if I broke it, anyway, change the name revenue-chart to whatever you want, but also change it in the cshtml):
declare var Morris: any;
declare var Chart: any;

namespace YourSerenityAppName.Common {

    @Serenity.Decorators.registerClass()
    @Serenity.Decorators.resizable()
    @Serenity.Decorators.maximizable()
    export class DashboardChart extends Serenity.TemplatedWidget<any> {
        private areaChart: any;
        private barChartData: any;

        static initializeChart() {
            $(function () {

                Common.DashboardPageService.CountByStatus({}, response => {
                    this.areaChart = new Morris.Bar({
                        element: 'revenue-chart',
                        resize: true, parseTime: false,
                        data: response.Values,
                        xkey: 'Month',
                        ykeys: response.StatusKeys, labels: response.StatusLabels, hideHover: 'auto'
                    });
                });
            });
        }
    }
}
Step 3: You need an endpoint. I called mine DashboardEndpoint.cs
The endpoint has a REQUEST and a RESPONSE. These 2 are 2 classes that I declare in the DashboardModel.cs (but that's in the Step 4)
using System;
using System.Collections.Generic;
using YourSerenityAppName.Default.Entities;
using System.Linq;

using Serenity.Data;
using Serenity.Services;
using System.Data;
using System.Web.Mvc;
using Dapper;

namespace YourSerenityAppName.Common.Endpoints
{
    [ServiceAuthorize, RoutePrefix("Services/Dashboard/DashboardPage"), Route("{action}")]
    [ConnectionKey(typeof(PolicyRow))]
    public class DashboardPageController : ServiceEndpoint
    {
        public CountByStatusResponse CountByStatus(IDbConnection connection, CountByStatusRequest request)
        {
            var fld = PolicyRow.Fields;
            var year = DateTime.Today.Year;
            var startOfMonth = new DateTime(year, DateTime.Today.Month, 1);
            var startingFrom = startOfMonth.AddMonths(-11);

            var response = new CountByStatusResponse();
            var statusList = connection.List<PolicyStatusRow>(q => q.SelectTableFields().Where(PolicyStatusRow.Fields.StatusId > 10).OrderBy(PolicyStatusRow.Fields.Description));
            response.StatusKeys = statusList.Select(x => "s" + x.StatusId.Value).ToList();
            response.StatusLabels = statusList.Select(x => x.Description).ToList();

            var monthExpr = "DATEPART(MONTH, " + fld.AccountingDate.Expression + ")";

            var byMonth = connection.Query(
                new SqlQuery()
                    .From(fld)
                    .Select(monthExpr, "Month")
                    .Select(Sql.Count(), "Count")
                    .Select(fld.StatusId, "Status")
                    .GroupBy(monthExpr)
                    .GroupBy(fld.StatusId)
                    .Where(
                        fld.AccountingDate.IsNotNull() &
                        fld.StatusId.IsNotNull() &
                        fld.AccountingDate < startOfMonth.AddMonths(1) &
                        fld.AccountingDate >= startingFrom))
                    .ToDictionary(x => new Tuple<int, int>((int)x.Month, (int)x.Status), x => (int)x.Count);

            response.Values = new List<Dictionary<string, object>>();
            var month = startingFrom.Month;
            int mc;
            for (var i = 0; i < 12; i++)
            {
                var d = new Dictionary<string, object>();
                d["Month"] = new DateTime(1999, month, 1)
                    .ToString("MMM");

                foreach (var p in statusList)
                    d["s" + p.StatusId] = byMonth.TryGetValue(
                        new Tuple<int, int>(month, p.StatusId.Value), out mc) ? mc : 0;

                response.Values.Add(d);

                if (++month > 12)
                    month = 1;
            }

            return response;
        }

    }

}
Step 4: in the DashboardModel.cs, you need to create the request and response.
Another disclaimer... I don't know of this is the best place to put this. But it was already here! So I use it. the point is, be mindful of where you put your stuff.
    //--------------
    //- CHARTS!    -
    //--------------

    public class CountByStatusRequest : ServiceRequest
    {
    }

    public class CountByStatusResponse : ServiceResponse
    {
        public List<Dictionary<string, object>> Values { get; set; }
        public List<string> StatusKeys { get; set; }
        public List<string> StatusLabels { get; set; }
    }
That is the first implementation. Again, the samples in Serenity have everything you need to construct this, and also to raise a child...
The Second implementation is following the same principle of the dashboard example.
Build your data in the DashboardController and push it to the html with some of those weird tags. You know what I'm talking about... the ones with the thingy...
This implementation is with Chart JS, and I learn a lot from another GitHub project called ComplexChart or something like that (I lost the link and I did not starred... SORRY!)
Step 1: Change the cshtml with your chart tags and put the javascript code at the end
<!-- Main row -->
<div class="row">
    <!-- Left col -->
    <section class="col-lg-7 connectedSortable">
        <div class="box box-primary">
            <div class="box-header with-border">
                <h3 class="box-title">ChartJS</h3>
                <div class="box-tools pull-right">
                    <button class="btn btn-box-tool" data-widget="collapse"><i class="fa fa-minus"></i></button>
                    <button class="btn btn-box-tool" data-widget="remove"><i class="fa fa-times"></i></button>
                </div>
            </div>
            <div class="box-body">
                <div class="chart">
                    <canvas id="MyBarChart" style="height:250px"></canvas>
                </div>
            </div><!-- /.box-body -->
        </div><!-- /.box -->
<script type="text/javascript">
    jQuery(function () {

        //This is if we use the model loaded from the controller.
        // this put the info "readeble" if the user open the code of the page.
        var ctx = document.getElementById("MyBarChart").getContext("2d");
        var barChart = new Chart(ctx);

        var data = @(new HtmlString(Model.BarChart.ComplexData.ToJson()));

        var options = @(new HtmlString(Model.BarChart.ChartConfiguration.ToJson()));

        barChart.Bar(data, options);

    });
</script>
Step 2: I did implement the ComplexChart classes to help me remember the structure of each chart. This is not necessary. You can build some templates and just change the data. I'm saying this because you will se some types that you will not find in Serenity.
In the DashboardModel.cs I included one object for each chart just because I was testing. Be mindful of the names. Like for example... my mother is of type mother, but she likes to be called by her name.
        public LineChart LineChart { get; set; }
        public BarChart BarChart { get; set; }
        public RadarChart RadarChart { get; set; }
        public PolarAreaChart PolarAreaChart { get; set; }
        public PieChart PieChart { get; set; }
        public DoughnutChart DoughnutChart { get; set; }
Step 3: Create your data (another tint little disclaimer: I did not finish this implementation, so my data right now is hardcoded...)
In the ActionResult I added just one line.
model.BarChart = this.GetBarChart();
And then I added my function to build the data.
        private BarChart GetBarChart()
        {
            var chart = new BarChart();
            chart.ComplexData.labels.AddRange(FakeComplexChartData.Labels);
            chart.ComplexData.datasets.AddRange(FakeComplexChartData.Datasets);

            return chart;
        }
And then I added a bunch of garbage I still need to work on.
        public static class ColorHelper
        {
            public static string Red { get { return "#f56954"; } }
            public static string Green
            {
                get
                { return "#00a65a"; }
            }
            public static string Orange
            {
                get
                { return "#f39c12"; }
            }
            public static string LightBlue
            {
                get
                { return "#00c0ef"; }
            }
            public static string Blue
            {
                get
                { return "#3c8dbc"; }
            }
            public static string Gray
            {
                get
                { return "#d2d6de"; }
            }

        }
        public static class FakeComplexChartData
        {
            public static IEnumerable<string> Labels
            {
                get
                {
                    return new[]
                               {
                               "January",
                               "February",
                               "March",
                               "April",
                               "May",
                               "June",
                               "July"
                           };
                }
            }

            public static IEnumerable<ComplexDataset> Datasets
            {
                get
                {
                    return new List<ComplexDataset>
                           {
                               new ComplexDataset
                                   {
                                       label = "My First dataset",
                                       data = new List<double> { 10, 20, 30, 40, 50, 60, 70 },
                                       fillColor = ColorHelper.Blue,
                                       strokeColor = ColorHelper.Blue,
                                       pointColor = ColorHelper.Blue,
                                       backgroundColor = "#f56954",
                                       borderColor = "#f56954",
                                       pointBackgroundColor = "#f56954",
                                       pointBorderColor = "#fff"
                                   },
                               new ComplexDataset
                                   {
                                       label = "My Second dataset",
                                       data = new List<double> { 70, 60, 50, 40, 30, 20, 10 },
                                       fillColor = ColorHelper.Orange,
                                       strokeColor = ColorHelper.Orange,
                                       pointColor = ColorHelper.Orange,
                                       backgroundColor = "rgba(151,187,205,0.2)",
                                       borderColor = "rgba(151,187,205,1)",
                                       pointBackgroundColor = "rgba(151,187,205,1)",
                                       pointBorderColor = "#fff"
                                   }
                           };
                }
            }
        }
So I think this summarize all the changes I did.
I don't know if I'm going to continue with the first implementation or the second.
Good luck.
 gguadalupe
on 2 Jun 2017
gguadalupe
on 2 Jun 2017
Charts in serenity currently use the moris, chartjs, and flot opensource. I suggest you read up on their information. A quick google search should give you a good number of samples.
 sayuga
on 2 Jun 2017
sayuga
on 2 Jun 2017
@gguadalupe ,
hi Gustavo, although you call yourself a "copy&paster", this would make up a great wiki entry :-)
Will you make one out of it - so that others can find it easily? :-)
Would be great :-)
With kind regards,
John
 JohnRanger
on 6 Sep 2019
JohnRanger
on 6 Sep 2019
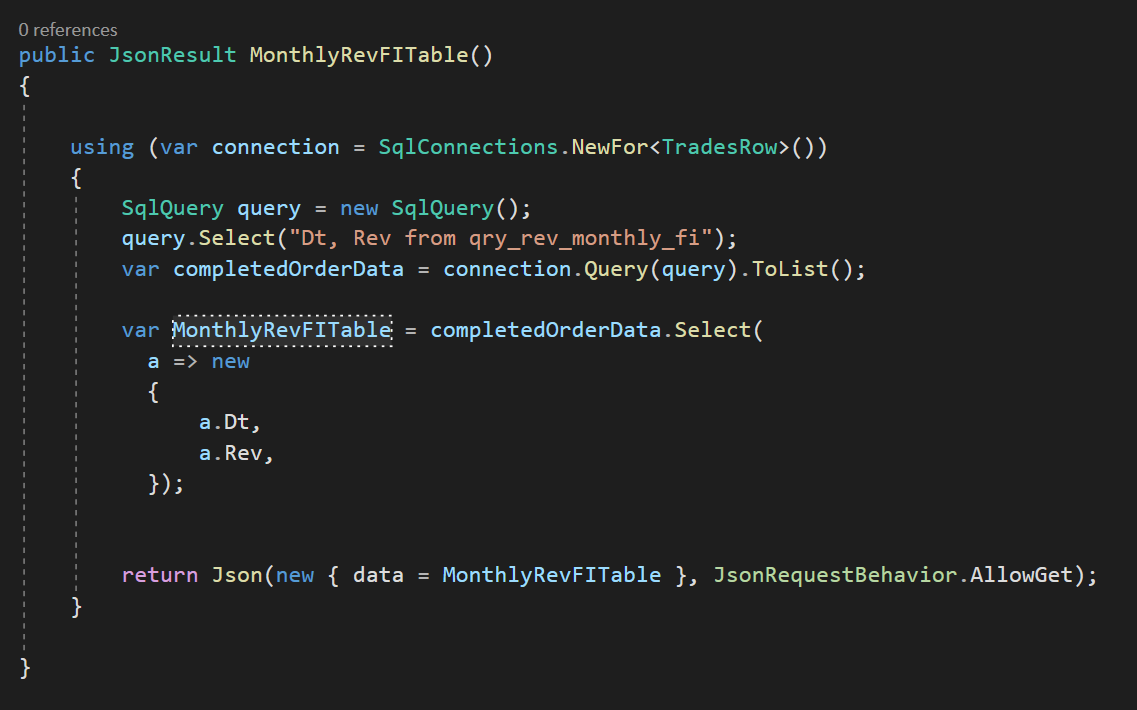
Hi all, I spent a lot of time on this searching on this issue and happy to share my result using ChartJS. The above thread helped me a great deal so thank you all for putting this here.
Most of the basic code is from serenity dashboard template examples. The below chart is simply displaying data returned from a MySQL view. The hard part (for me) was getting data from the DB to the chart in the correct format.
Apologies here for any errors or unattractive coding, my only coding experience was in Visual Basic.
I accomplished something similar with DataTables, happy to share that too...
[DashboardPage.cs] - controller
[DashboardIndex.cshtml]
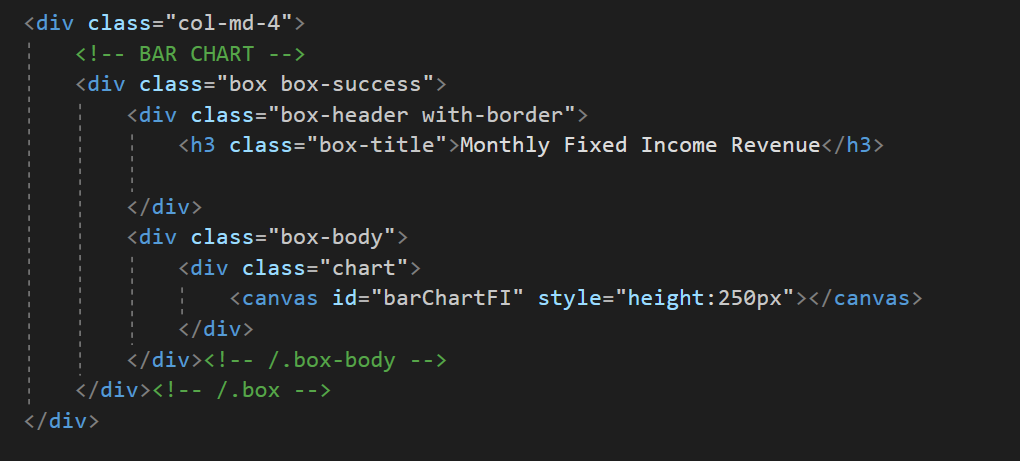
[DashboardIndex.cshtml] below between
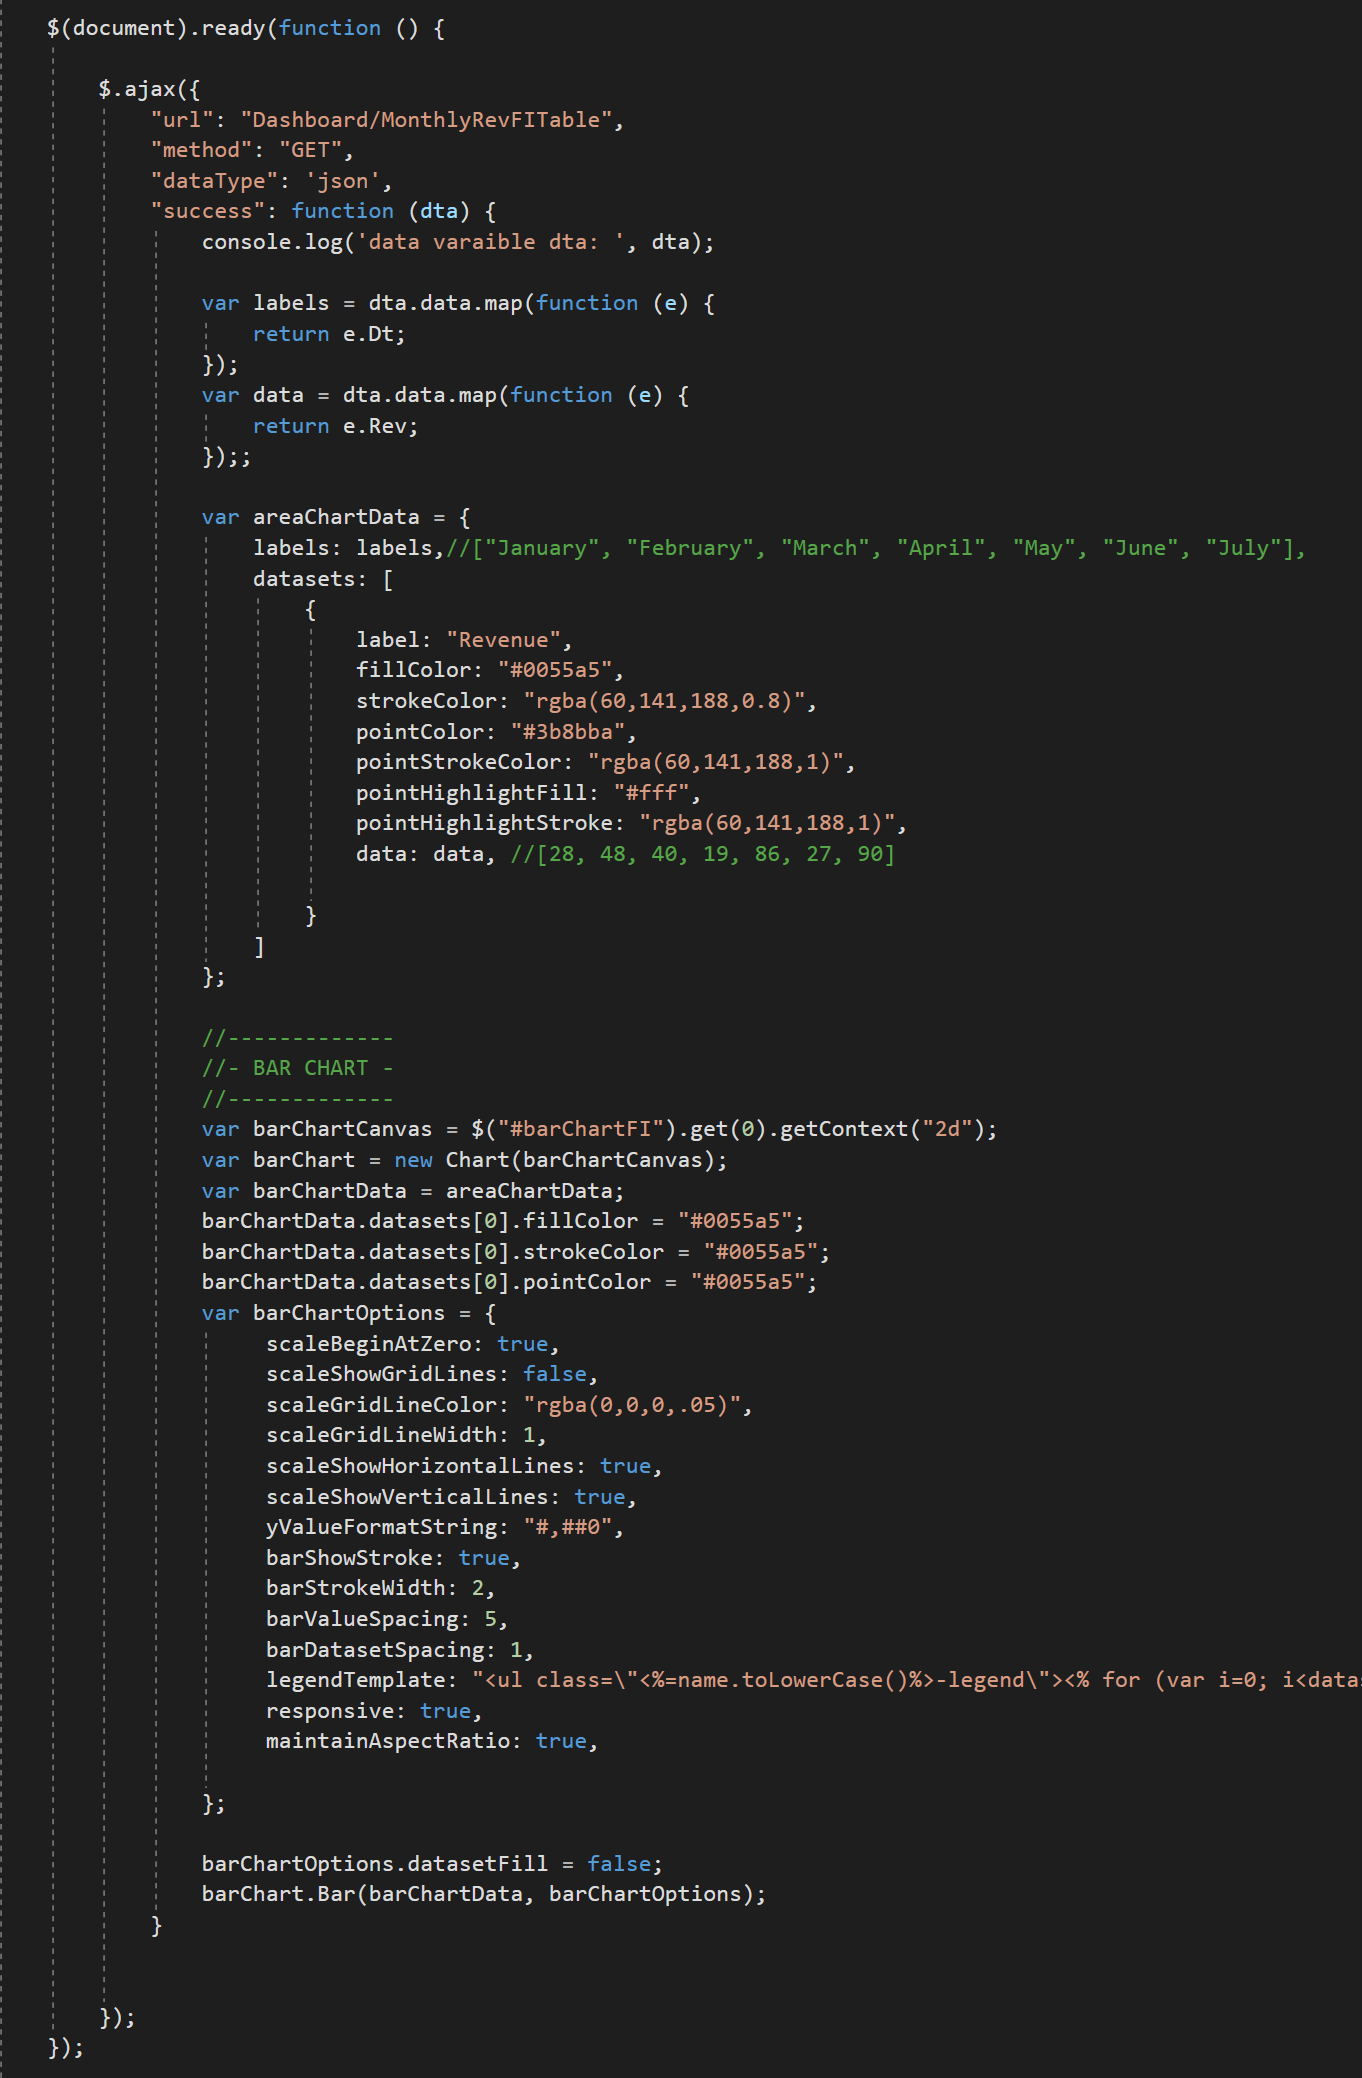
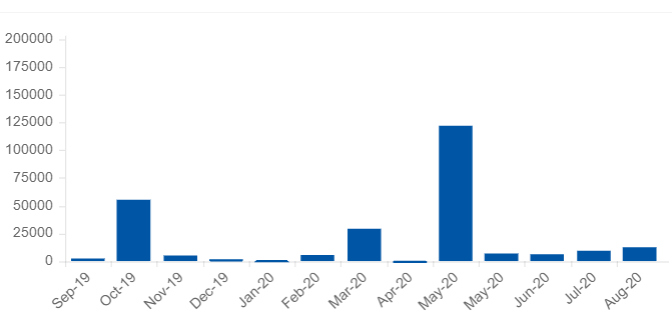
result:
 chrisomeara
on 24 Aug 2020
chrisomeara
on 24 Aug 2020
Hi, I run this example, but using google geo graphical donut trying to make turkey map, but if you help, please I am very novice somehow I failed I would be very pleased.
 fatihsimsekk
on 13 Nov 2020
fatihsimsekk
on 13 Nov 2020
Related issues
JohnRanger
·
3Comments
 dkontod
·
3Comments
dkontod
·
3Comments
 Akarsh03
·
3Comments
Akarsh03
·
3Comments
 Pinellus
·
3Comments
Pinellus
·
3Comments
 ga5tan
·
3Comments
ga5tan
·
3Comments
Most helpful comment
Hi, I did 2 different implementations of charts for the dashboard.
But before I continue a little disclaimer: I'm not a web developer. I know nothing of this tech. I'm just a copypaster (a good one, but just a copypaster). So these examples may be as wrong as the last reboot of fantastic four.
Anyway...
The first implementation is using typescript and the Morris chart. I build this example from the Chart In Dialog in Basic Samples (check the sample, is really useful).
Step 1: Change DashboardIndex.cshtml at the end add this code.
Step 2: Create a ts file for the dashboard. I call it DashboardChart.ts (I'm really, really, really not sure about the naming convention... so... yeah.)
In this file I added this code (see that I'm using the revenue chart. This is because that chart was working fine, so whatever I do I will know if I broke it, anyway, change the name revenue-chart to whatever you want, but also change it in the cshtml):
Step 3: You need an endpoint. I called mine DashboardEndpoint.cs
The endpoint has a REQUEST and a RESPONSE. These 2 are 2 classes that I declare in the DashboardModel.cs (but that's in the Step 4)
Step 4: in the DashboardModel.cs, you need to create the request and response.
Another disclaimer... I don't know of this is the best place to put this. But it was already here! So I use it. the point is, be mindful of where you put your stuff.
That is the first implementation. Again, the samples in Serenity have everything you need to construct this, and also to raise a child...
The Second implementation is following the same principle of the dashboard example.
Build your data in the DashboardController and push it to the html with some of those weird tags. You know what I'm talking about... the ones with the thingy...
This implementation is with Chart JS, and I learn a lot from another GitHub project called ComplexChart or something like that (I lost the link and I did not starred... SORRY!)
Step 1: Change the cshtml with your chart tags and put the javascript code at the end
Step 2: I did implement the ComplexChart classes to help me remember the structure of each chart. This is not necessary. You can build some templates and just change the data. I'm saying this because you will se some types that you will not find in Serenity.
In the DashboardModel.cs I included one object for each chart just because I was testing. Be mindful of the names. Like for example... my mother is of type mother, but she likes to be called by her name.
Step 3: Create your data (another tint little disclaimer: I did not finish this implementation, so my data right now is hardcoded...)
In the ActionResult I added just one line.
model.BarChart = this.GetBarChart();And then I added my function to build the data.
And then I added a bunch of garbage I still need to work on.
So I think this summarize all the changes I did.
I don't know if I'm going to continue with the first implementation or the second.
Good luck.