Sentry: GET /api/0/issue/{issue_number}/events/latest/ throws NotFoundError on 10.0.0
Important Details
How are you running Sentry?
- [ ] On-Premise docker [Version xyz]
- [ ] Saas (sentry.io)
- [X] Other [briefly describe your environment]
Installed using pip in a fresh virtualenv with python2.7.
Database migrated from version 9.1.2 to 10.0.0, after clickhouse and Snuba installation.
Using Snuba installed in a fresh virtualenv with python 3.7.
Running behind a NGinx RP.
Description
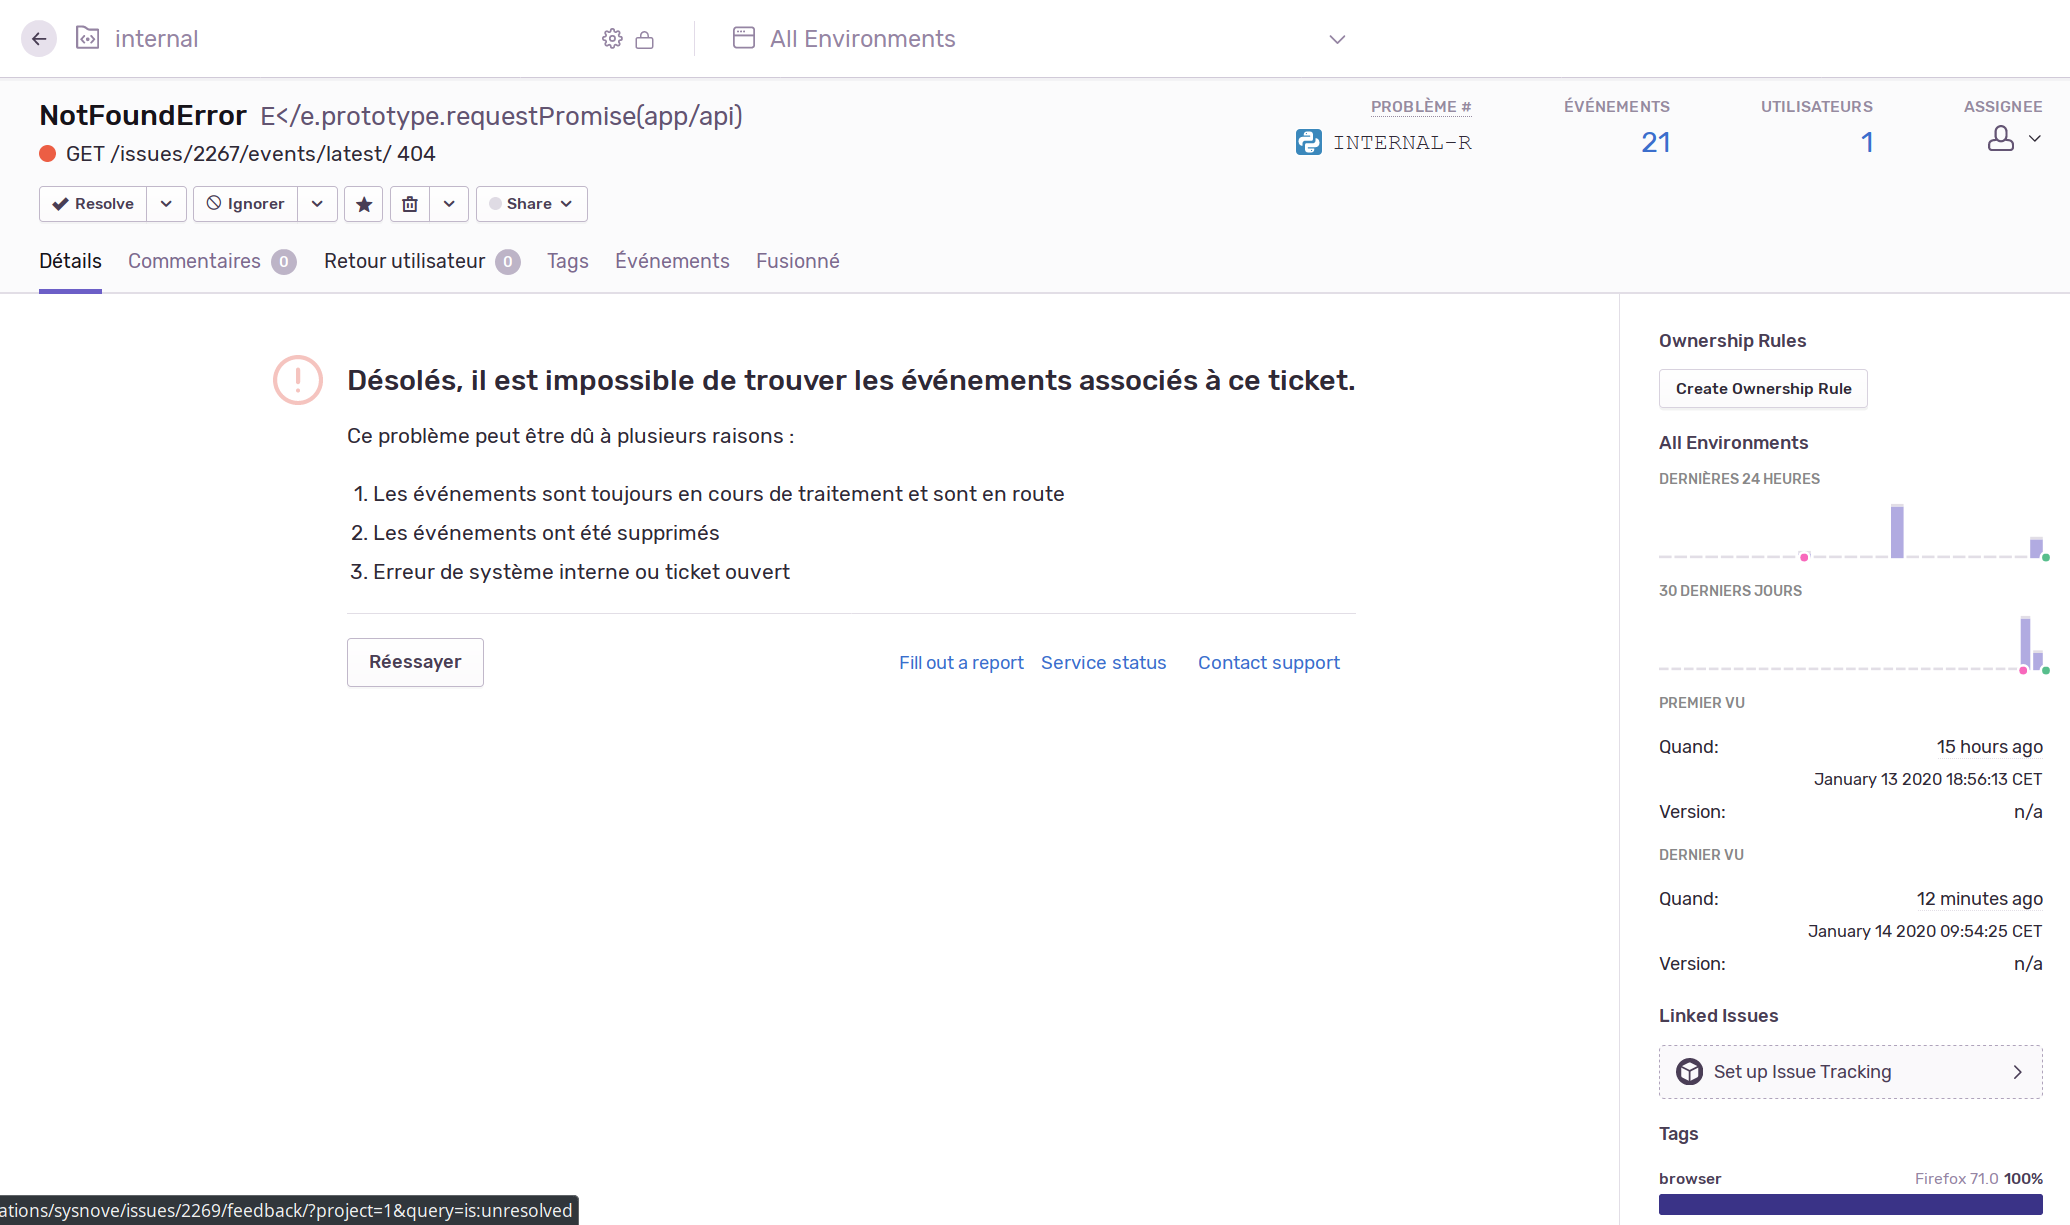
When I want to view an issue, I get an error "Impossible to find events linked to this issue" (may not be accurate as I translate the message from french).
It creates an issue in Internal, which generates the same event.
Steps to Reproduce
- Consult any issue in Sentry
- Go to Internal project and consult the new NotFoundError issue
- View the error message (this confirms it is not related to the client)
Good items to include here include:
- Include a stacktrace or other logs when relevant
No stack trace in the logs, just a 404 error.
I can get the list of events using CURL directly on the sentry instance :
# curl -v -H 'Authorization: Bearer XXX' http://localhost:10000/api/0/issues/2267/events/ | jq
  % Total    % Received % Xferd  Average Speed   Time    Time     Time  Current
                                 Dload  Upload   Total   Spent    Left  Speed
  0     0    0     0    0     0      0      0 --:--:-- --:--:-- --:--:--     0*   Trying 127.0.0.1...
* TCP_NODELAY set
* Connected to localhost (127.0.0.1) port 10000 (#0)
> GET /api/0/issues/2267/events/ HTTP/1.1
> Host: localhost:10000
> User-Agent: curl/7.52.1
> Accept: */*
> Authorization: Bearer XXX
>
< HTTP/1.1 200 OK
< Content-Length: 17440
< Access-Control-Allow-Headers: X-Sentry-Auth, X-Requested-With, Origin, Accept, Content-Type, Authentication, Authorization
< X-Content-Type-Options: nosniff
< Content-Language: en
< Access-Control-Expose-Headers: X-Sentry-Error, Retry-After
< Vary: Accept-Language, Cookie
< X-XSS-Protection: 1; mode=block
< Link: <https://sentry.mydomain.com/api/0/issues/2267/events/?&cursor=0:0:1>; rel="previous"; results="false"; cursor="0:0:1", <https://sentry.mydomain.com/api/0/issues/2267/events/?&cursor=0:100:0>; rel="next"; results="false"; cursor="0:
100:0"
< Allow: GET, HEAD, OPTIONS
< Access-Control-Allow-Origin: *
< Access-Control-Allow-Methods: GET, HEAD, OPTIONS
< Content-Type: application/json
< X-Frame-Options: deny
<
{ [15631 bytes data]
* Curl_http_done: called premature == 0
100 17440  100 17440    0     0   205k      0 --:--:-- --:--:-- --:--:--  207k
* Connection #0 to host localhost left intact
[
  {
    "eventID": "8d37e39619594403a46116c10314a79f",
    "tags": [
      {
        "value": "Firefox 71.0",
        "key": "browser"
      },
      {
        "value": "Firefox",
        "key": "browser.name"
      },
      {
        "value": "production",
        "key": "environment"
      },
      {
        "value": "no",
        "key": "handled"
      },
      {
        "value": "error",
        "key": "level"
      },
      {
        "value": "onunhandledrejection",
        "key": "mechanism"
      },
      {
        "value": "1",
        "key": "organization"
      },
      {
        "value": "Linux",
        "key": "os.name"
      },
      {
        "query": "user.id:\"2\"",
        "value": "id:2",
        "key": "user"
      },
      {
        "value": "/organizations/:orgId/issues/:groupId/",
        "key": "ui.route"
      },
      {
        "value": "https://sentry.mydomain.com/organizations/XXX/issues/2267/",
        "key": "url"
      }
    ],   "projectID": "1",
    "dateCreated": "2020-01-14T08:54:15Z",
    "user": {
      "username": null,
      "name": null,
      "ip_address": "80.14.165.126",
      "email": "[email protected]",
      "data": null,
      "id": "2"
    },
    "message": "E</e.prototype.requestPromise NotFoundError GET /issues/2267/events/latest/ 404 ./app/api.tsx E</e.prototype.requestPromise(app/api)",
    "id": "8d37e39619594403a46116c10314a79f",
    "culprit": "E</e.prototype.requestPromise(app/api)",
    "title": "NotFoundError: GET /issues/2267/events/latest/ 404",
    "platform": "javascript",
    "location": "./app/api.tsx",
    "crashFile": null,
    "event.type": "error",
    "groupID": "2267"
  },
…
]
I reduced the output to the first item in the list.
- Include a redacted version of your configuration when relevant
The main changes in the configuration are:
- the database connection information
- Snuba configuration as in the link https://github.com/getsentry/snuba#sentry--snuba (but got the same behaviour without those changes)
What you expected to happen
I should have no error, and the content of the last event of the issue.
Possible Solution
None for now.
 xals
xals
All 6 comments
Hi there! Please use our forums for questions like these as the issue board is only for the core Sentry code-related issues.
 BYK
on 21 Jan 2020
BYK
on 21 Jan 2020
@xals how to fix it?
 sansanboy
on 14 Apr 2020
sansanboy
on 14 Apr 2020
@sansanboy I have no idea, sorry.
The issue has been closed, telling me to use the forums because it seams that not being able to see the content of an issue it not an issue.
I do not want to register to another forum I will consult once a decade, so this became a status-quo here, and I am waiting for
- the next release to have a chance to fix it
- or another tool to replace Sentry (as I consider the architecture is now too complex and bug prone)
Regards.
xals
on 14 Apr 2020
I faced the same problem & from clickhouse debugging logs, I saw that sentry (snuba?) using a kind of compare timestamp >= toDateTime('2020-05-22T04:34:45', 'Universal') when it select events. So please ensure that your clickhouse is using UTC timezone to get events.
You can check by clickhouse-client --query="select timezone()" . Hope this will save you some time
 cucxabong
on 22 May 2020
cucxabong
on 22 May 2020
@xals - I understand the frustration regarding the forum being a separate place but what you are reporting seems to be a configuration issue with your custom setup, not a bug with Sentry hence the request to use the forums to keep issues focused on things that are broadly applicable to the Sentry project.
The issue board here is not a support forum or a help channel but the forums are.
the next release to have a chance to fix it
We keep publishing the latest masters of all projects to Docker Hub and default to installing those for people using the on-premise repository. You may want to try one of the newer builds or do a source build yourself if you are willing to try.
or another tool to replace Sentry (as I consider the architecture is now too complex and bug prone)
The new architecture may not be explained very well publicly but this doesn't make it more bug prone as sentry.io has been running with it for quite a while, and in a stable fashion. You know using the hosted service is also an option if hosting Sentry yourself is not your cup of tea.
@cucxabong thanks a lot for the helpful advise!
BYK
on 22 May 2020
@cucxabong : THANK YOU SO MUCH!!! That was actually the fix for the problem I saw since weeks! I already gave up on getting sentry to work.
For everybody else coming here: Try that solution.
 davelosert
on 9 Oct 2020
davelosert
on 9 Oct 2020
Related issues
 chavlin
·
3Comments
chavlin
·
3Comments
 mattrobenolt
·
3Comments
mattrobenolt
·
3Comments
 bruno-garcia
·
3Comments
bruno-garcia
·
3Comments
 dmnd
·
4Comments
dmnd
·
4Comments
 fatagun
·
4Comments
fatagun
·
4Comments
Most helpful comment
I faced the same problem & from clickhouse debugging logs, I saw that sentry (snuba?) using a kind of compare
timestamp >= toDateTime('2020-05-22T04:34:45', 'Universal')when it select events. So please ensure that your clickhouse is using UTC timezone to get events.You can check by
clickhouse-client --query="select timezone()". Hope this will save you some time