Sentry-laravel: [Performance feature] Configuration option traces_sample_rate has no effect.
Version sentry/sentry-laravel: 2.0.0
Configuration option traces_sample_rate works well enough to enable performance tracing of an app.
However, changing its value to any number greater than 0 and smaller than one (e.g. 0.1) makes all requests go through performance tracing.
Some examples on Vapor:
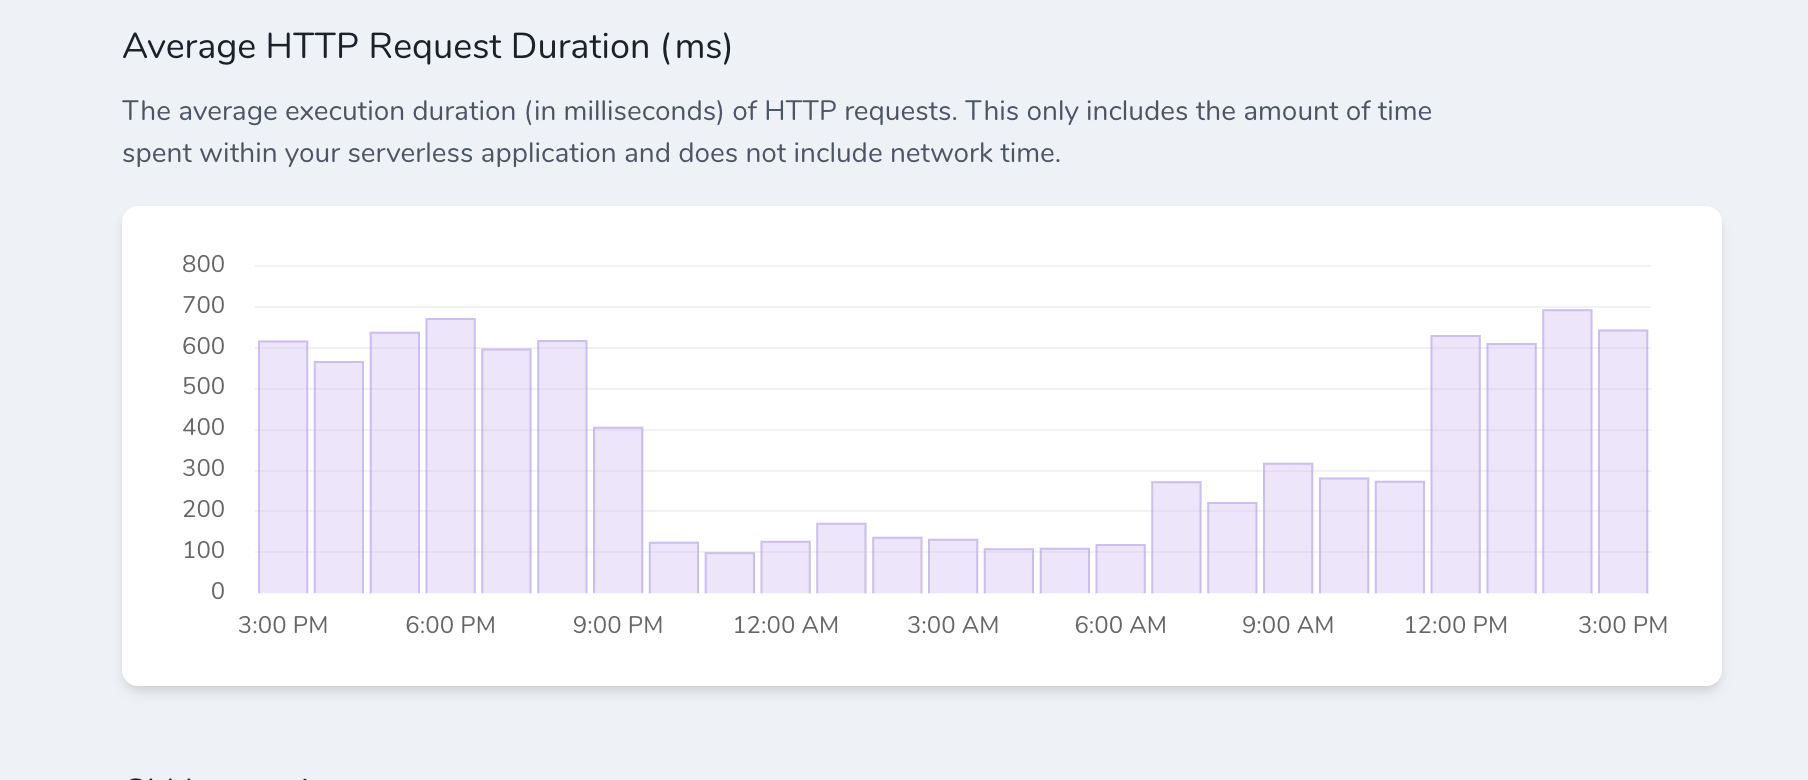
Before 9.00 pm traces_sample_rate was at a value of 1 (making all requests go through performance tracing. You can see a spike in response times.
From 9:00 pm to 12:00 am, the value was set to 0 (disabling the feature). Response times go down.
From 12:00 am onwards, the rate was set to 0.05 but the average response time went up to the same value as when the tracing percentage was at 1
 polbatllo
All 11 comments
This is because the sampling happens at the moment of sending the event, when the value is greater than 0 the tracing is started but the trace is never sent in the end if it's sampled out. Although that is how it should be... interesting thing is though that currently tracing is never fully disabled, not even setting the value to 0 (#390).
So I'm curious why the rise in the average duration since I would expect that to rise because the sending of the trace to sentry.io might take a few extra milliseconds (this effect also depends on the region the lambda is hosted vs where sentry.io is hosted) but considering a sample rate of 0.05 the effect should be minimal.
Although you are also not showing request numbers so these averages don't mean that much currently (busy site = longer response times as database gets loaded or requests are simply more complicated than an uptime monitor pinging your login page). You say at 12 AM you set the rate to 0.05 and the average rises almost not at all, but at ~7 am (early start of the day?) the duration starts to rise and at 12 - 3pm (busiest moment of the day?) it increases to the same level as before.
However these rises and falls (especially a fall in the nighttime) could be expected as traffic increases and decreases to your app, do you have numbers from before you deployed version 2.0.0? That way we can actually compare numbers with how your app behaved in similar times as the current screenshot and start to investigate if there is something to be done.
 stayallive
on 30 Sep 2020
stayallive
on 30 Sep 2020
@stayallive , thank you for your prompt follow up.
According to what you're saying, tracing could take longer because of the request being made to sentry.io. I wonder if moving that logic to a queue would help it (?).
It's strange that numbers go up when the only change deployed to production has been tracing.
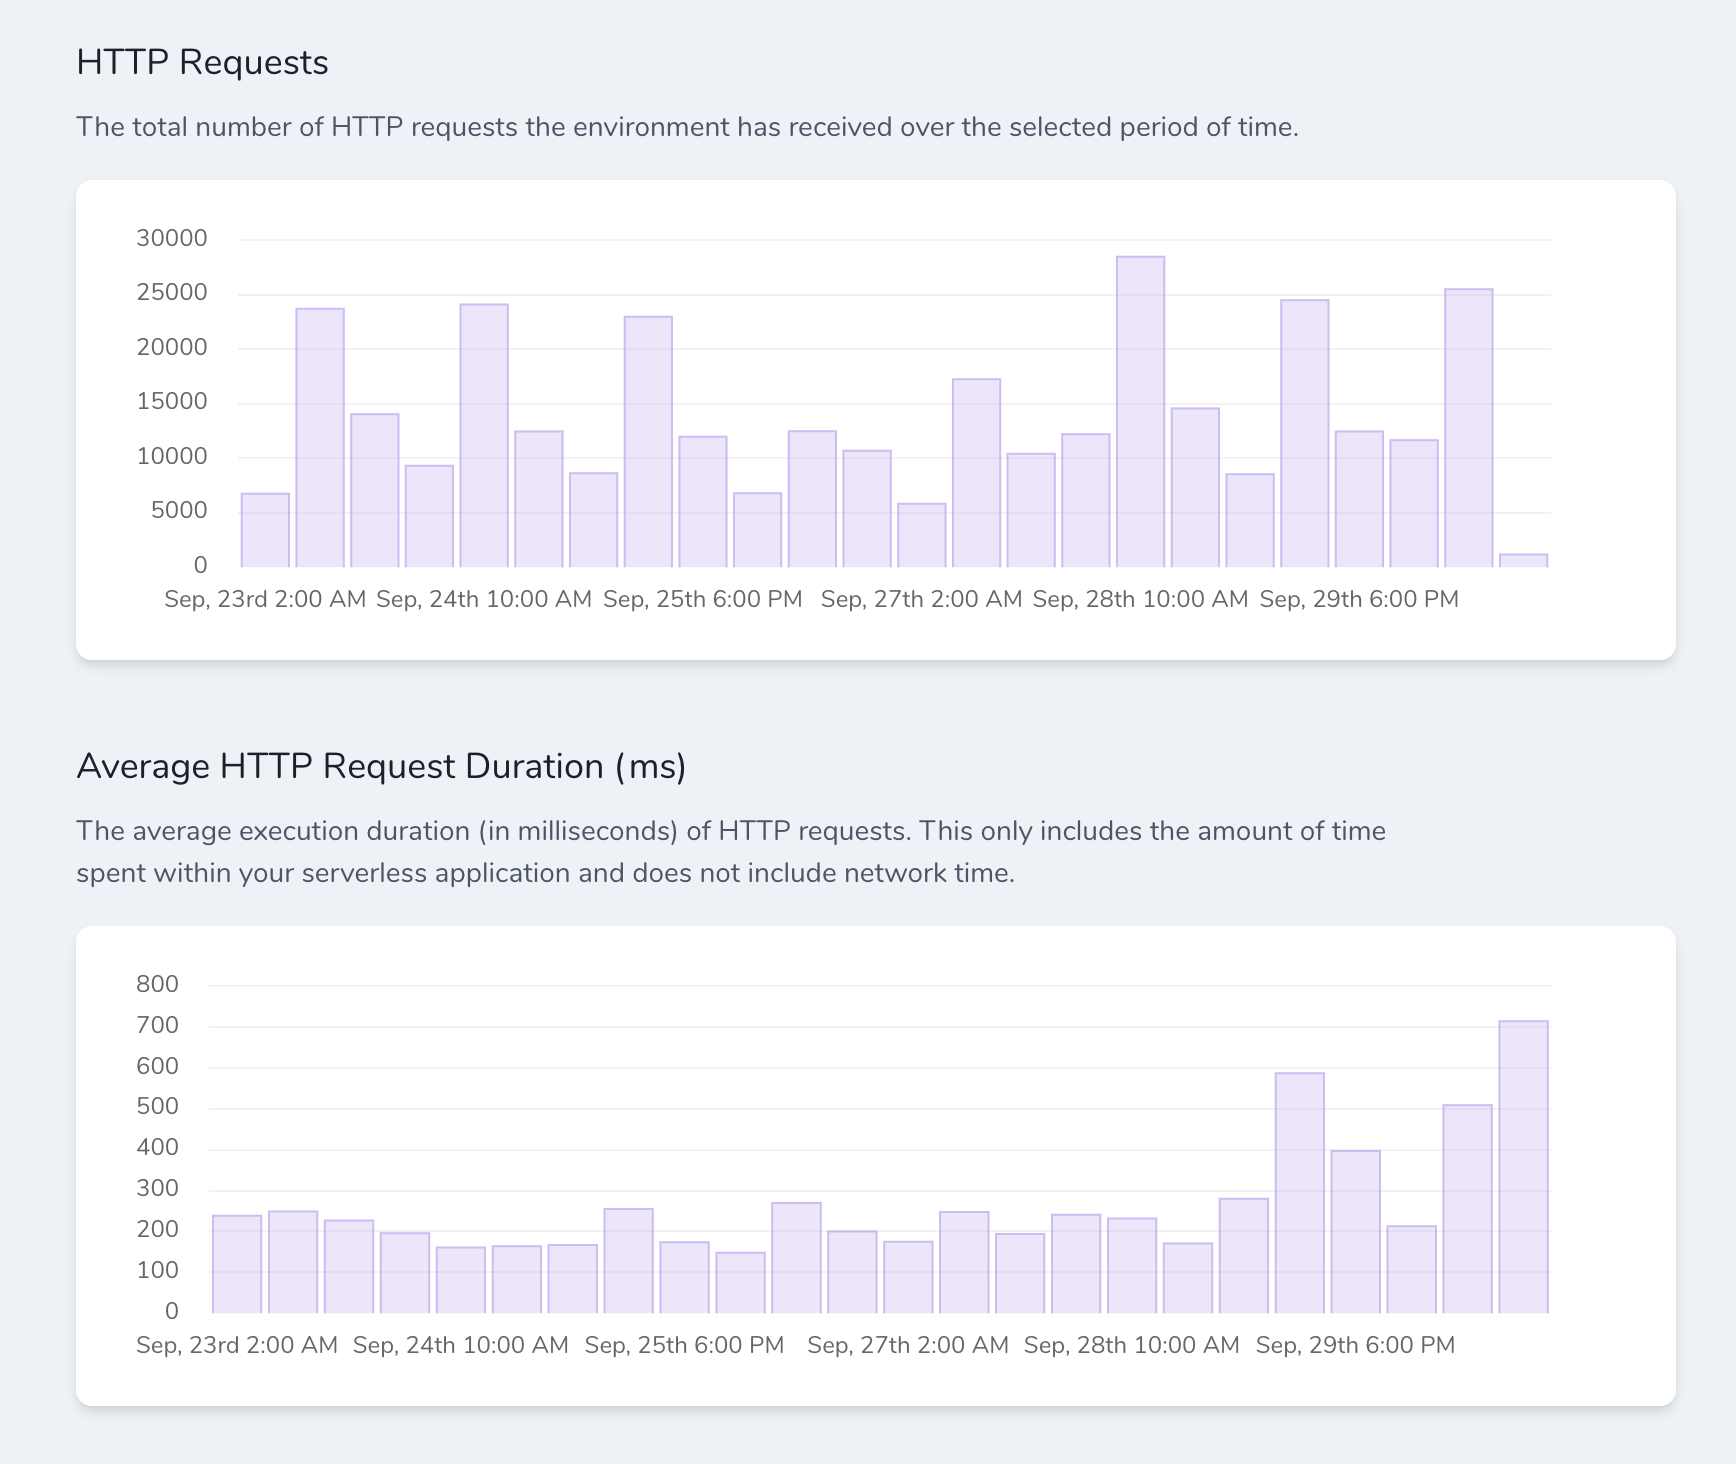
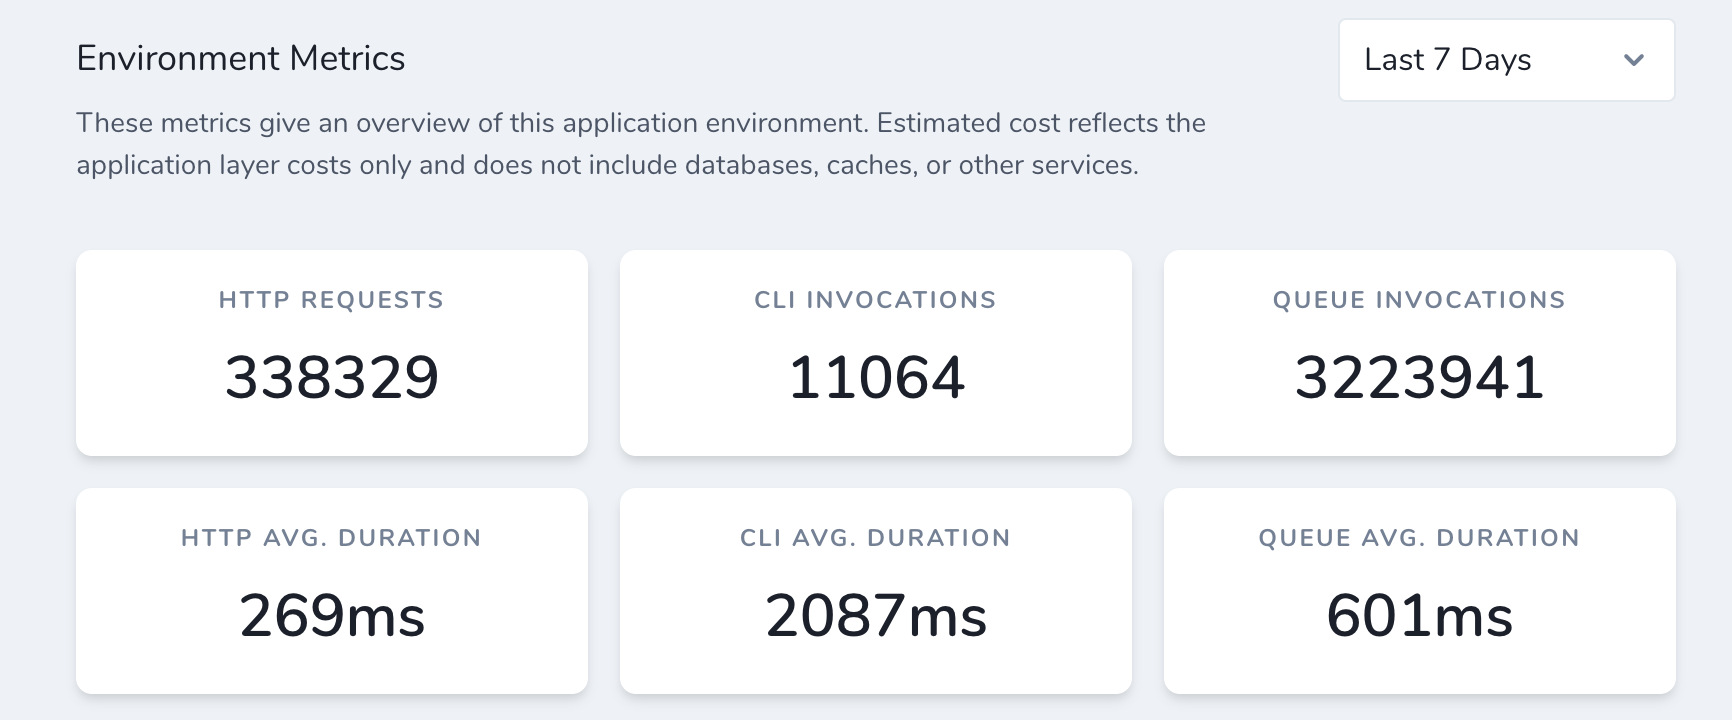
Attaching an image of the last 7 days. Performance tracing was enabled around 9:00 am on the 29th, before version 2.0.0
Also, I have to say that most of the workload in our app is made inside the queue system. And if I'm not mistaken, no tracing is taking place there.
polbatllo
on 30 Sep 2020
According to what you're saying, tracing could take longer because of the request being made to sentry.io. I wonder if moving that logic to a queue would help it (?).
Possibly but this is not implemented at this moment but might be added in the future. Even though you are using Laravel Vapor I do want to leave this here although this might not be a route you'd want to take: https://docs.sentry.io/platforms/php/performance/#improve-response-time.
I also want to add that any sending to sentry.io happens after the response has been sent to the user (in a terminable middleware), so the request times might look longer but the user is not waiting on a trace being sent to Sentry before it gets the response of your app.
Also, I have to say that most of the workload in our app is made inside the queue system. And if I'm not mistaken, no tracing is taking place there.
The tracing happens currently (for Laravel) by using a global middleware, so yes only for HTTP requests.
When you changed the sample rate to 0.05, did you also see the amount of traces coming into Sentry being decreased or did that not change too vs when it was on 1.0?
I am trying to figure out what is going on, looking at my own stats (over a 12 hour period) I don't see any appreciable increase in response times, but we only deployed 2.0.0 and did not at any point enable tracing yet (deployment happend in the middle of this graph).
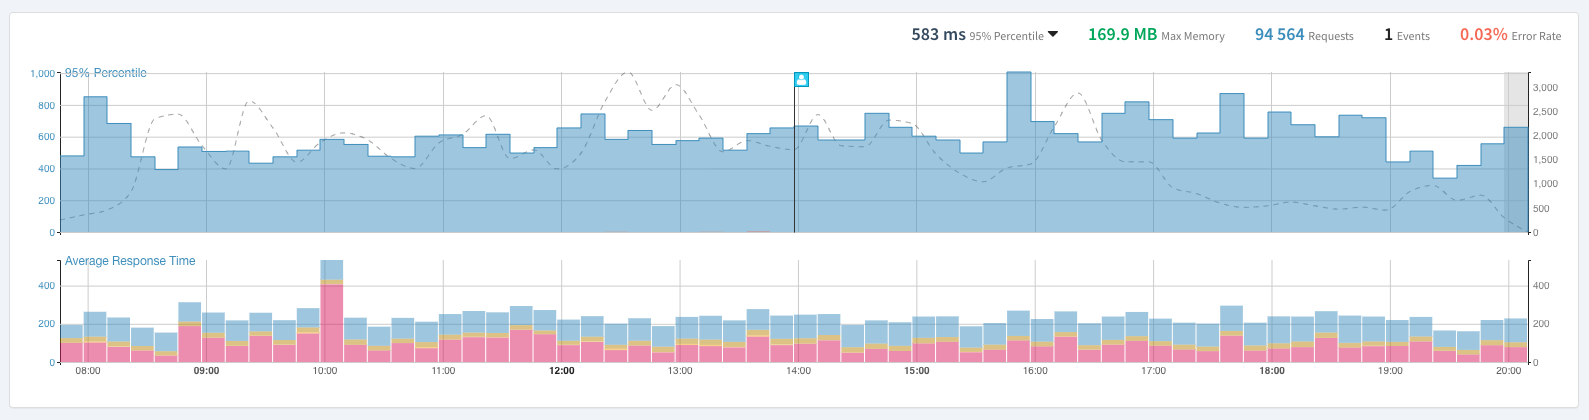
This was also not on Vapor, so that might be related too somehow.
Thank you for sharing all this information by the way, it is much appreciated!
stayallive
on 30 Sep 2020
My pleasure. I wrote too fast as I was in a rush and forgot to mention some things... but you reminded me with:
When you changed the sample rate to 0.05, did you also see the amount of traces coming into Sentry being decreased or did that not change too vs when it was on 1.0?
Good catch!
No, tracing did not decrease, which is strange right? I'm beginning to wonder if I misconfigured something, although that seems unlikely since I double-checked pretty much everything.
I'll dig further ☺️
polbatllo
on 30 Sep 2020
If the transactions did not decrease I feel like something is indeed not configured correctly or the changed value was not propagated correctly somehow.
I feel like you would have thought about it but just to be 100% sure. Did you hit redeploy in Vapor after changing the config (assuming you changed it in an environment variable)? And or do you have php artisan config:cache in your deployment steps in your vapor.yml (I believe you shouldn't but I'm not a 100% sure it matters).
Keep me posted!
stayallive
on 30 Sep 2020
I'm experiencing the same issues as @polbatllo . Even locally when when I try to adjust the traces_sample_rate value I either get all or nothing. Exactly the same as above (0 => no transactions, 1 => 100% of transactions, 0.1 => 100% of transactions). I havent yet got far into debugging it, however echoing out the $sampleRate after line 235 in Sentry\Client it always seems to equal 1.0 no. That's with config cached and config cleared.
 Hornet-Wing
on 1 Oct 2020
Hornet-Wing
on 1 Oct 2020
@Hornet-Wing well yes, that is because we have 2 sample rates 😉
That sample rate is not applied for transactions: https://github.com/getsentry/sentry-php/blob/b39248013660036d222681a359990284904a5db3/src/Client.php#L237.
HOWEVER, I did notice we made a mistake somewhere else...
https://github.com/getsentry/sentry-php/pull/1106 🤦♂️
Thank you both for bringing this to our attention, this will be released shortly 😄
stayallive
on 1 Oct 2020
I did double-check @stayallive , all good config-wise.
Thank you for checking on this.
polbatllo
on 2 Oct 2020
Yeah you are also hitting the bug exactly as you described in the first post @polbatllo, as long as you put a number above 0.0 the regular sample rate would be used (which is 1.0 by default) so even setting 0.05 will send everything... PR is pending and shall be released as a bugfix. Thanks again for your detailed reports.
stayallive
on 2 Oct 2020
So we just released version 3.0.2 of the sentry/sentry package: https://github.com/getsentry/sentry-php/releases/tag/3.0.2.
This should fix the problem and use the correct sample rate.
A composer update should be enough to fix it!
If somehow still not please reopen the issue or create a new one. Thanks again for your patience and detailed reports, much appreciated 👍
stayallive
on 2 Oct 2020
Thanks a lot for quick update!
Hornet-Wing
on 2 Oct 2020
Related issues
 acidjazz
·
4Comments
acidjazz
·
4Comments
 andrey-helldar
·
7Comments
andrey-helldar
·
7Comments
 straube
·
5Comments
straube
·
5Comments
 Dalabad
·
3Comments
Dalabad
·
3Comments
 jstolp
·
4Comments
jstolp
·
4Comments
Most helpful comment
@Hornet-Wing well yes, that is because we have 2 sample rates 😉
That sample rate is not applied for transactions: https://github.com/getsentry/sentry-php/blob/b39248013660036d222681a359990284904a5db3/src/Client.php#L237.
HOWEVER, I did notice we made a mistake somewhere else...
https://github.com/getsentry/sentry-php/pull/1106 🤦♂️
Thank you both for bringing this to our attention, this will be released shortly 😄