Seaborn: displot(kind='ecdf',..., log_scale=True) not working
The following line of code gives an error:
sns.displot(kind='ecdf', data=df, x='col_1', log_scale=True)

UserWarning: Data has no positive values, and therefore cannot be log-scaled.
My data is all positive and kind='hist' or 'kde' works just fine.
 JanHomann
All 10 comments
Please share:
- A sample of your data, or a simulated dataset with similar characteristics that produces the error
- The full traceback with the error message
- The versions of matplotlib and seaborn
As requested here.
Thanks!
 mwaskom
on 11 Mar 2021
mwaskom
on 11 Mar 2021
This here works:
sns.displot(kind='ecdf', x=np.random.lognormal(mean=-1, sigma=1, size=1000), log_scale=True);
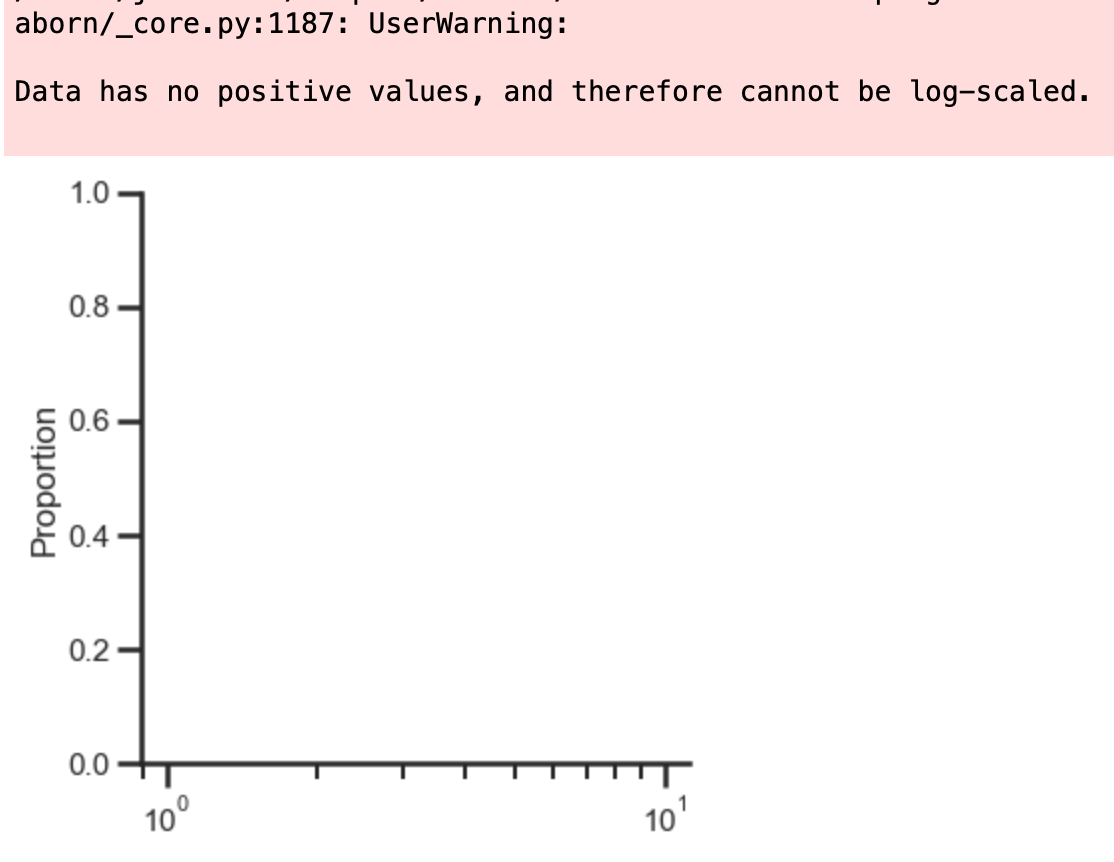
While this here doesn't (note that the values are smaller (roughly between 10^-6 and 10^-3)):
sns.displot(kind='ecdf', x=np.random.lognormal(mean=-10, sigma=1, size=1000), log_scale=True);
Using hist works:
sns.displot(kind='hist', x=np.random.lognormal(mean=-10, sigma=1, size=1000), log_scale=True);
There is no traceback because it's just a warning and not an error. the plot appears empty (screenshot below).
sns.__version__
'0.11.1'

matplotlib.__version__
'3.3.1'
JanHomann
on 11 Mar 2021
Thanks; I can reproduce.
You can turn a warning into a full stack trace with
import warnings
warnings.simplefilter("error", UserWarning)
when I do that, the problem is in the guts of matplotlib and will take some figuring out.
In the meantime, because the ecdf is just based on quantiles, it doesn't matter if the log scaling happens before or after you calculate it. So you could do
g = sns.displot(..., kind="ecdf")  # No log_scale
g.set(xscale="log")
for the same effect.
mwaskom
on 11 Mar 2021
Actually, I think there is a bigger problem. Even with the numbers that are bigger it doesn't give a reasonable cumulative distribution.
Have a look at this:
sns.displot(kind='ecdf',x=np.random.lognormal(mean=-1,sigma=1,size=1000), log_scale=True);

sns.displot(kind='hist',x=np.random.lognormal(mean=-1,sigma=1,size=1000),
            log_scale=True, cumulative=True,
            element='step', bins=1000);
I think those plots should end up roughly the same. The upper plot is definitely wrong.

JanHomann
on 11 Mar 2021
Sorry, I don't know why my plots are so big. I use a 4K monitor.
JanHomann
on 11 Mar 2021
Your suggested solution (thank you!) gives the correct result. So I think there is generally a problem with displot 'ecdf' and log_scale=True, even when it works. The numbers seem to be transformed in a way that is not correct.
g = sns.displot(kind='ecdf',x=np.random.lognormal(mean=-1,sigma=1,size=1000));
g.set(xscale='log')

JanHomann
on 11 Mar 2021
Yes I think ecdfplot is missing the step that transforms the data back from log space for plotting after calculating the distribution — this is currently a rough edge.
mwaskom
on 11 Mar 2021
Okay, good to know.
So essentially NOONE should be using displot(kind='ecdf', log_scale=True) right now. because even if it works, it gives (or can give) the wrong result. Correct?
JanHomann
on 11 Mar 2021
Indeed, though fortunately the result ends up being fairly obviously wrong visually, as you discovered.
mwaskom
on 11 Mar 2021
Yes. Me and you have enough "common sense" to see that. But there are a lot of people walking around that don't have that. :sweat_smile:.
JanHomann
on 11 Mar 2021
Related issues
 Bercio
·
3Comments
Bercio
·
3Comments
 amelio-vazquez-reina
·
4Comments
amelio-vazquez-reina
·
4Comments
 wenhaosun
·
3Comments
wenhaosun
·
3Comments
 alexpetralia
·
3Comments
alexpetralia
·
3Comments
 rrbarbosa
·
3Comments
rrbarbosa
·
3Comments